
Qtum is a hybrid blockchain system designed to handle business applications developed for different business domains. Qtum merges the reliability of Bitcoin’s unfailing blockchain with the adaptability of Ethereum’s smart contract capabilities. It’s a hybrid platform, designed for real-world, business-oriented applications. Its unique proposition lies in its ability to execute smart contracts on a secure and stable blockchain, making it a compelling choice for developers and investors alike. As a digital asset, Qtum’s stock reflects its growing adoption and potential in the blockchain ecosystem.
This article explores Qtum’s future financial prospects, providing a detailed price forecast for 2024 and the years that follow, up to 2026 and beyond. With insights from industry experts and thorough market analysis, we aim to offer readers a comprehensive understanding of Qtum’s potential trajectory. Whether you’re a seasoned investor or new to the cryptocurrency scene, this forecast will equip you with the knowledge needed to navigate the ever-evolving digital currency landscape.
The article covers the following subjects:
Highlights and Key Points: Qtum Price Forecast 2024–2030
- As of 11.07.2024, Qtum is experiencing volatility, with recent data showing its price fluctuating around 2.275. This reflects the dynamic and uncertain nature of the cryptocurrency market.
- For 2024, there’s no clear consensus on QTM market performance at the moment. Some experts see the altcoin fluctuating heavily within $1.6 – $4.7, some predict a calm year with nothing but side movement, and some suggest that the token will start gaining strength rising up to $4.17 by the year-end.
- Moving into 2025, some experts see a bullish perspective with the maximum projected price being $4.65. Additionally, experts disagree on whether the growth will be stable or see some fluctuations along the way.
- Long-term Price 2026 – 2030: Different agencies have varying projections, but the overall consensus remains bullish. Some evaluations state that the altcoin will breach the level of $6 in 2026, the others predict even higher levels. In 2030, the maximum price ranges between $17.10 and $24.46.
Qtum Price Today, Сoming Days and Week
Predicting the exact price movements of Qtum or any cryptocurrency in the coming days is challenging due to the volatile nature of the crypto market, which is influenced by a variety of factors such as market sentiment, regulatory news, and technological developments. Updates within the Qtum blockchain can drive adoption and investor interest. Overall market sentiment towards cryptocurrencies significantly impacts price movements. Also, investors and traders might want to closely monitor regulatory news, as changes in cryptocurrency regulations can affect market conditions. Additionally, broader market trends and the performance of leading cryptocurrencies often influence the prices of altcoins like Qtum, so keeping an eye on the overall market sentiment could provide clues about its potential price movements in the near term.
Qtum Price Forecast for 2024 – Expert Predictions
Let’s look at different agencies’ insights. Some experts predict that the coin will be fluctuating heavily, some expect slow and steady growth, and there are those who predict that the asset’s price will see minor changes during the rest of 2024. That lack of consensus among experts might suggest that one should approach investing in Qtum with caution and keep risk management in mind.
Gov Capital
Price Range in 2024: $1.67 – $4.72 (as of July 11, 2024)
The forecast from Gov Capital suggests that the second half of 2024 promises to be turbulent for QTUM. The price is projected to skyrocket to $3.66 from $1.98 by the end of the summer only to drop a bit in September. Then, it will steadily climb to its peak in November and end up dropping to its yearly low. Analysts pinpoint that this year is definitely not the best time to invest in QTUM.
| Month | Average, $ | Minimum, $ | Maximum, $ |
|---|---|---|---|
| July | 1.98 | 1.68 | 2.28 |
| August | 3.66 | 3.12 | 4.21 |
| September | 3.23 | 2.74 | 3.71 |
| October | 3.29 | 2.79 | 3.78 |
| November | 4.10 | 3.49 | 4.72 |
| December | 1.96 | 1.67 | 2.26 |
DigitalCoinPrice
Price Range in 2024: $1.89 – $5.01 (as of July 11, 2024)
DigitalCoinPrice predicts a small raise and then a side movement for QTMUSD exchange rate in 2024. An average price will fluctuate in the range of $2.16 – $4.17 without any sharp oscillations.
| Month | Minimum, $ | Average, $ | Maximum, $ |
|---|---|---|---|
| July | 2.29 | 2.29 | 2.29 |
| August | 1.92 | 2.16 | 5.01 |
| September | 1.89 | 3.38 | 4.92 |
| October | 1.98 | 4.17 | 4.90 |
| November | 1.91 | 2.71 | 4.82 |
| December | 1.96 | 3.81 | 4.90 |
PricePrediction
Price Range in 2024: $2.13 – $3.00 (as of July 11, 2024)
Contrastingly, PricePrediction forecasts steady bullish movement with QTMUSD average rate slowly rising to $2.76 from $2.36 during six months. Despite having hard times in the market, the altcoin is expected to start gaining strength for the rest of 2024.
| Month | Minimum, $ | Average, $ | Maximum, $ |
|---|---|---|---|
| July | 2.13 | 2.36 | 2.42 |
| August | 2.36 | 2.45 | 2.54 |
| September | 2.41 | 2.52 | 2.64 |
| October | 2.46 | 2.58 | 2.74 |
| November | 2.54 | 2.65 | 2.87 |
| December | 2.65 | 2.76 | 3.00 |
QTMUSD Technical Analysis
The entire history of QTMUSD quotes is presented on the weekly time frame:
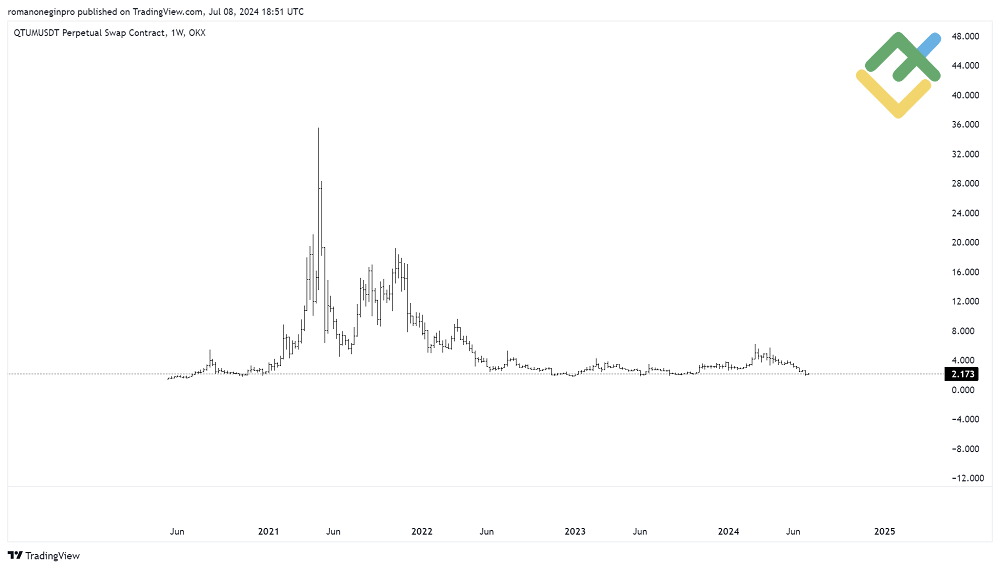
The chart displays two general trends – upward and downward. The Qtum price grew for two years from the moment the cryptocurrency appeared. We see a particularly rapid rise in 2021. Since May 2021, a bearish trend has started. Notably, this trend may end soon.
The daily and 4-hour time frames can be used for a more accurate analysis. In addition, proper technical analysis requires the following tools and indicators:
- The Elliott waves theory will help identify price patterns as well as predict price movement;
- Trend lines show the prevailing price direction;
- Fibonacci retracement levels help to identify potential pivot points;
- Candlestick patterns are used to assess market behavior and psychology, as well as to determine potential price targets.
Get access to a demo account on an easy-to-use Forex platform without registration
QTMUSD Analysis For Next Three Months
Let’s apply technical indicators to the daily chart to build a possible scenario for the next three months:
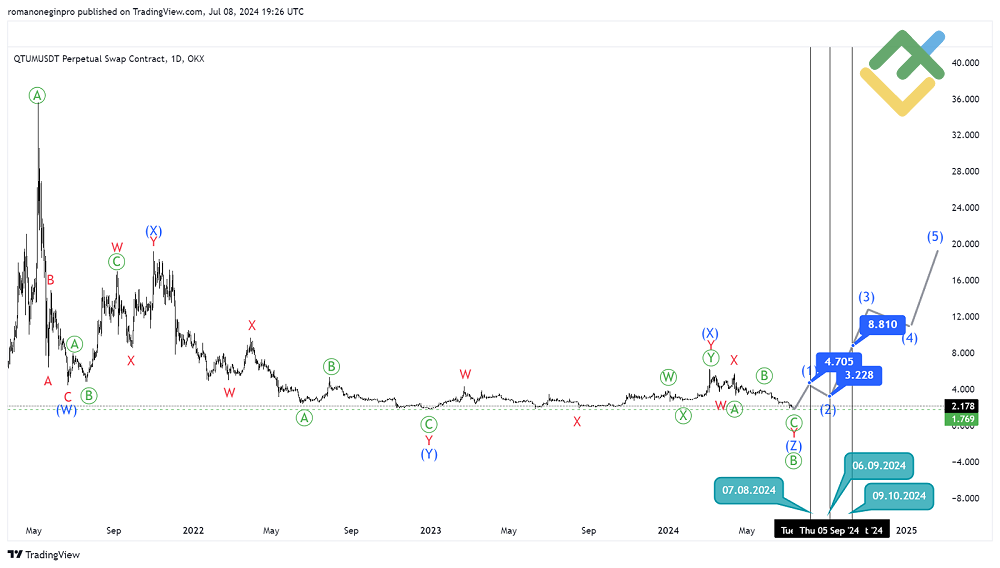
The Elliott wave analysis reveals that the QTMUSD is forming a large zigzag, consisting of three waves [A]-[B]-[C]. In May 2021, an impulse wave [A], the first part of this pattern, was completed. After the impulse wave ended, the price started to decline within a major corrective wave [B].
The correction [B] has a complex internal structure, unfolding as a triple zigzag (W)-(X)-(Y)-(X)-(Z). Since this corrective pattern seems to be completed, namely sub-waves (W)-(X)-(Y)-(X), the triple zigzag may end near the previous low of $1.76. Earlier, the motive wave (Y) was completed at this mark.
Thus, the final motive wave (Z) and correction [B] may reach the low of $1.76. At this level, the downtrend may reverse.
The following scenario is possible in the next three months:
- In July-August, Qtum may reverse and form a sub-wave (1) to $4.70;
- In August-September, the price will likely decline within a small correction (2) to $3.22;
- In September-October, a stronger impulsive sub-wave (3) is expected to push the asset to $8.81 and higher.
The approximate timeline for the above scenario is shown on the chart.
Long-Term QTMUSD Technical Analysis for 2024
Let’s use the 4-hour time frame to make a forecast until the end of this year:
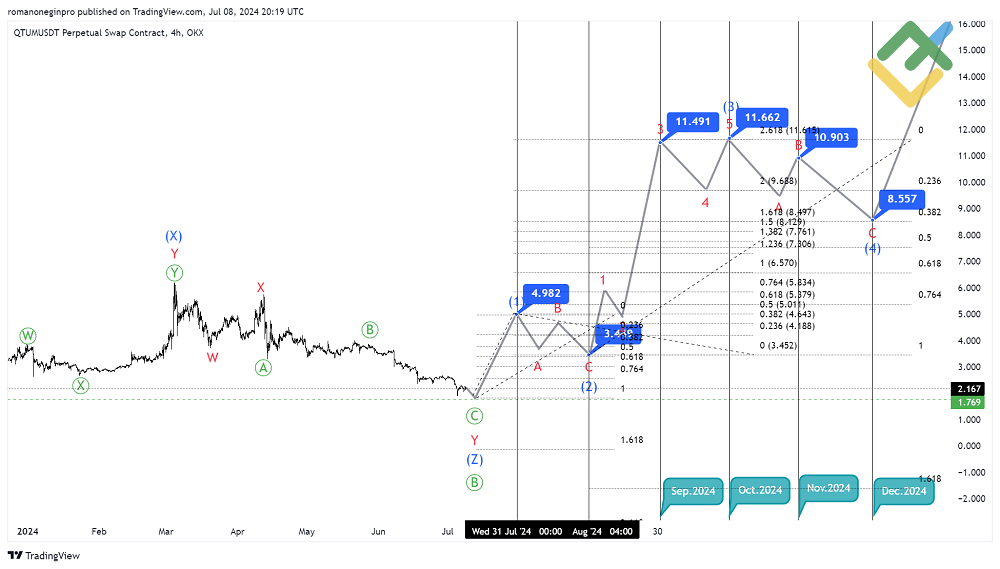
As stated above, the trend will likely reverse in the near term. The Qtum price may start moving within a bullish trend. Once the correction [B] is completed, bulls may start building a powerful impulse wave [C]. On the chart, trend lines show the wave’s initial part.
By the end of July, the first part of a major impulse wave, a sub-wave (1), may be built. In August, the cryptocurrency may move within the correction (2), which is likely to take a zigzag shape. Its end is determined using the Fibonacci levels. The wave (2) will likely retrace 61.8% of the sub-wave (1), so the price may decline to $3.44.
In September, Qtum may increase rapidly within a sub-wave (3), which may take two months to develop. The wave (3) could be 261.8% of the impulse sub-wave (1). In November and December, the asset may start a corrective movement, forming a sub-wave (4) as a zigzag A-B-C, as shown on the chart. The correction (4) will likely retrace 38.2% of the impulse wave (3). Thus, the quotes may fall to $8.55.
The correction is likely to end by the end of the year. In 2025, the cryptocurrency may start to rise within the fifth wave.
| Month | QTMUSD Projected Values | |
|---|---|---|
| Minimum, $ | Maximum, $ | |
| July | 1.76 | 4.98 |
| August | 3.44 | 4.98 |
| September | 3.44 | 11.49 |
| October | 9.70 | 11.66 |
| November | 9.70 | 10.90 |
| December | 8.55 | 10.90 |
Long-Term Trading Plan for QTMUSD
Let’s make a trading plan for three months and until the end of the year:
- Due to a projected trend reversal, consider buying the instrument at the current level with a target of $4.98, where the sub-wave (1) is predicted to end;
- A bearish correction within wave (2) is expected in August. Thus, it is recommended to consider selling the asset with the target of $3.44;
- From the beginning of fall, consider opening long trades with a take-profit order placed at $11.49. The first half of the major impulse wave (3) may end at this mark.
As for long-term trading, long trades can be initiated at the current level with a take-profit order set at $11.66. At this level, the most powerful impulse sub-wave (3) may be completed, followed by a pullback in correction (4).
Start trading with a trustworthy broker
Qtum Price Predictions for 2025
Let’s look at what the agencies suppose to be happening with cryptocurrency in 2025. This time, experts tend to agree that QTM will enter the bullish phase in 2025, hitting its yearly highs.
DigitalCoinPrice
Price Range in 2025: $4.82 – $5.93 (as of July 11, 2024)
Digital Coin Price’s forecast for Qtum in 2025 states that the side movement continues. The average monthly prices are projected to hover mainly within $4.95 – $5.46, showing nevertheless a significant growth compared to the previous years. The highest price predicted in September at around $5.93. The lowest price is anticipated in November at $4.82.
| Month | Minimum, $ | Average, $ | Maximum, $ |
|---|---|---|---|
| January | 4.83 | 4.97 | 5.04 |
| February | 4.83 | 4.88 | 5.22 |
| March | 4.88 | 4.98 | 5.85 |
| April | 4.91 | 5.35 | 5.81 |
| May | 4.90 | 5.17 | 5.76 |
| June | 4.83 | 5.04 | 5.35 |
| July | 4.85 | 5.28 | 5.79 |
| August | 4.88 | 5.10 | 5.74 |
| September | 4.87 | 5.46 | 5.93 |
| October | 4.89 | 5.00 | 5.34 |
| November | 4.82 | 5.44 | 5.61 |
| December | 4.83 | 4.95 | 5.27 |
PricePrediction
Price Range in 2025: $2.65 – $4.65 (as of July 11, 2024)
For QTMUSD in 2025, PricePrediction experts anticipate the continuation of 2024’s bullish trend. Average prices will continue rising, reaching a peak of $4.65 in December.
| Year | Minimum, $ | Average, $ | Maximum, $ |
|---|---|---|---|
| January | 2.65 | 2.90 | 2.98 |
| February | 2.84 | 2.95 | 3.10 |
| March | 2.90 | 03.01 | 3.24 |
| April | 2.97 | 3.10 | 3.39 |
| May | 3.12 | 3.23 | 3.55 |
| June | 3.21 | 3.33 | 3.71 |
| July | 3.32 | 3.46 | 3.84 |
| August | 3.46 | 3.60 | 4.02 |
| September | 3.57 | 3.70 | 4.16 |
| October | 3.67 | 3.78 | 4.35 |
| November | 3.75 | 3.89 | 4.50 |
| December | 3.86 | 3.97 | 4.65 |
Qtum Price Predictions for 2026
Let’s look at what the agencies suppose to be happening with the cryptocurrency in 2026.
DigitalCoinPrice
Price Range in 2026: $6.63 – $8.30 (as of July 11, 2024)
DigitalCoinPrice‘s forecast for Qtum in 2026 again states a side movement throughout the year, indicating, however, a higher price levels. The average price, despite some corrections along the way, is expected to grow up to $7.29, while the maximum projected price may breach the $8 level at some point. Despite this, QTM continues its side movement.
| Month | Minimum, $ | Average, $ | Maximum, $ |
|---|---|---|---|
| January | 6.67 | 6.95 | 7.03 |
| February | 6.68 | 7.35 | 7.65 |
| March | 6.67 | 7.70 | 7.92 |
| April | 6.63 | 7.15 | 7.37 |
| May | 6.69 | 6.92 | 7.45 |
| June | 6.67 | 6.96 | 8.19 |
| July | 6.67 | 8.01 | 8.30 |
| August | 6.68 | 6.79 | 8.28 |
| September | 6.65 | 8.00 | 8.20 |
| October | 6.66 | 7.30 | 8.07 |
| November | 6.68 | 7.25 | 7.84 |
| December | 6.70 | 7.29 | 7.91 |
PricePrediction
Price Range in 2026: $3.81 – $6.76 (as of July 11, 2024)
PricePrediction’s forecast promises the bullish outlook for QTM in 2026, showing constant monthly growth with no corrections. The max price is expected to reach $6.76 in December, showing growing investors’ confidence in the asset.
| Year | Minimum, $ | Average, $ | Maximum, $ |
|---|---|---|---|
| January | 3.81 | 4.17 | 4.29 |
| February | 4.14 | 4.33 | 4.45 |
| March | 4.35 | 4.51 | 4.67 |
| April | 4.44 | 4.60 | 4.85 |
| May | 4.62 | 4.78 | 5.08 |
| June | 4.77 | 4.93 | 5.27 |
| July | 4.91 | 5.07 | 5.52 |
| August | 5.08 | 5.28 | 5.77 |
| September | 5.18 | 5.38 | 5.98 |
| October | 5.29 | 5.49 | 6.20 |
| November | 5.50 | 5.65 | 6.47 |
| December | 5.72 | 5.88 | 6.76 |
A Price Timeline: Qtum Outlook
Qtum (QTUM-USD) has shown notable fluctuations over the past year, as evidenced by its trading history on Yahoo Finance.
Qtum’s inception in 2017 was met with considerable enthusiasm. The coin leveraged the security of Bitcoin’s UTXO model and the Ethereum Virtual Machine’s smart contract functionality, presenting a unique proposition in the crypto space. Its initial coin offering (ICO) was a resounding success, reflecting the optimism of investors about its potential.
However, like many cryptocurrencies, Qtum was not immune to the volatility that characterizes these early stages of blockchain projects. The years 2017 to 2019 were a rollercoaster, with the coin experiencing sharp increases in value followed by steep declines.
As the market matured, Qtum began to find its footing. The years 2020 to 2022 marked a period of stabilization and gradual growth for Qtum. This phase was bolstered by the growing interest in decentralized finance (DeFi) and non-fungible tokens (NFTs), sectors where Qtum’s technology found practical applications.
Looking towards the long-term forecast, Qtum’s outlook appears promising but, as with all cryptocurrencies, not without challenges. The broader market’s movement towards greater regulatory clarity and institutional investment could play a significant role in Qtum’s performance.
Long Term Qtum Predictions 2027-2030
For the 2027-2030 period, experts tend to agree on a bullish scenario. Thus, DigitalCoinPrice forecasts Qtum to breach the $17 level, indicating the significant growth from the current price levels.
| Year | Minimum, $ | Average, $ | Maximum, $ |
|---|---|---|---|
| 2027 | 8.79 | 9.77 | 10.37 |
| 2028 | 8.79 | 9.77 | 10.37 |
| 2029 | 10.85 | 11.62 | 12.28 |
| 2030 | 15.42 | 16.38 | 17.10 |
The forecast provided by PricePrediction is even more bold. The experts suggest that the altcoin’s price will exceed $22 in 2030.
| Year | Minimum, $ | Average, $ | Maximum, $ |
|---|---|---|---|
| 2027 | 7,16 | 7,43 | 8,01 |
| 2028 | 10,28 | 10,70 | 11,72 |
| 2029 | 14,90 | 15,52 | 17,00 |
| 2030 | 21,20 | 22,09 | 24,46 |
With that being said, the analysts see huge potential in QTM’s future market performance.
Factors that Can Affect the Qtum Price
Qtum, a hybrid of Bitcoin’s security and Ethereum’s smart contract functionality is a significant player in the cryptocurrency market. Understanding the factors influencing its price is essential for investors.
1. Market Sentiment and Technical Indicators:
Market sentiment, reflected in technical indicators like the Relative Strength Index (RSI) and moving averages, plays a crucial role in Qtum’s price movements.
2. Blockchain Innovations:
Updates and innovations in Qtum’s platform, particularly in intelligent contract capabilities, significantly impact investor confidence and price.
3. Regulatory Environment:
Regulatory changes in key markets can cause price volatility, affecting investor confidence in Qtum.
4. Market Capitalization and Liquidity:
Qtum’s market cap and liquidity are critical indicators of its stability and growth potential.
5. Adoption and Partnerships:
Real-world adoption and strategic partnerships can enhance Qtum’s utility and attract investors.
6. Competition and Market Position:
Qtum’s ability to maintain its unique value proposition in a competitive market is crucial for its price stability.
7. Global Economic Factors:
Global economic trends, such as inflation and currency fluctuations, indirectly impact Qtum’s price.
8. Technological Security:
The security of Qtum’s blockchain technology is paramount. Security breaches can lead to a loss of investor trust and price drops.
9. Social Media Influence:
Social media and public figures’ opinions can rapidly alter market sentiment, leading to price fluctuations.
10. Investor Psychology:
Investor behavior, driven by factors like FOMO or FUD, significantly influences Qtum’s market movements.
Various technical, economic, and psychological factors shape Qtum’s price. Investors should consider these elements alongside the potential and risks of the cryptocurrency market.
Conclusion: Is Qtum A Good Investment?
Evaluating Qtum’s investment potential in the cryptocurrency market presents a complex picture-predictions for 2024 and beyond show significant volatility and growth potential. Agencies like PricePrediction and DigitalCoinPrice provide optimistic yet highly volatile forecasts, reflecting the unpredictable nature of cryptocurrencies.
Gov Capital suggests substantial volatility, while Digital Coin Price and PricePrediction offer a more bullish perspective, though DigitalCoinPrice experts are more cautious in their projections. These differing views highlight the speculative and fluctuating market environment.
Long-term projections up to 2030 are generally more bullish. Digital Coin Price foresees a consistent upward trend, reinforcing a positive outlook.
However, potential investors must recognize the high risk due to market volatility. Qtum, with its innovative combination of Bitcoin’s security and Ethereum’s smart contracts, holds promise. Still, its future hinges on market dynamics, technological advancements, and investor sentiment.
In conclusion, while Qtum offers intriguing long-term prospects, it is an investment suited for those willing to weather the market’s inherent unpredictability. Careful analysis of trends and Qtum’s unique position in the cryptocurrency market is essential for informed decision-making.
FAQs on QTUM Forecast
Qtum combines Bitcoin’s security with Ethereum’s innovative contract capabilities, making it a unique player in the blockchain space. Investors should care about its price predictions due to its innovative approach and potential market impact.
As of today, 11.07.2024, the QTM price is $2.275.
Some analysts foresee a bullish outlook for QTM in 2025, with prices potentially reaching $4.65.
Experts consider past price trends, technical analysis, market sentiment, and blockchain innovations to predict Qtum’s future prices. Regulatory changes and global economic factors also play a role.
Analysts expect QTUM to be steadily rising between 2024 and 2030, potentially reaching $22. Though one should consider the high volatile nature of cryptocurrencies and approach those forecasts as a suggestion.
Blockchain innovations, regulatory changes, real-world adoption, and competitive dynamics in the cryptocurrency market could influence Qtum’s price.
Qtum price predictions should inform, not dictate, investment decisions. They should be used alongside broader market analysis and personal risk assessment.
Price chart of QTMUSD in real time mode

The content of this article reflects the author’s opinion and does not necessarily reflect the official position of LiteFinance. The material published on this page is provided for informational purposes only and should not be considered as the provision of investment advice for the purposes of Directive 2004/39/EC.
{{value}} ( {{count}} {{title}} )
This post is originally published on LITEFINANCE.


