
The Relative Strength Index (RSI) is a popular momentum indicator in technical analysis, offering traders powerful insights into market behavior. Used effectively, RSI trading strategies can help traders achieve consistent success by identifying potential buying and selling opportunities. In this article, we’ll break down three proven RSI trading strategies you can incorporate into your trading arsenal. These strategies rely on understanding overbought and oversold conditions, divergences, and how to combine the RSI with other technical tools for greater accuracy. By the end, you’ll have a comprehensive understanding of how to use RSI trading strategies effectively.
What Is the Relative Strength Index (RSI)?
The Relative Strength Index (RSI) is a momentum indicator that measures the speed and change of price movements. It oscillates between 0 and 100, giving traders insights into whether an asset is overbought or oversold. Readings above 70 indicate overbought conditions, suggesting a potential price drop. Readings below 30 indicate oversold conditions, hinting at a potential rebound.
Created by J. Welles Wilder, the RSI is widely used in technical analysis across various markets, including stocks, commodities, and cryptocurrencies. By tracking the momentum of price changes, the RSI helps traders identify possible trend reversals. The indicator works especially well in trending markets, allowing traders to time their entries and exits with precision.
How to Read RSI for Effective Trading?
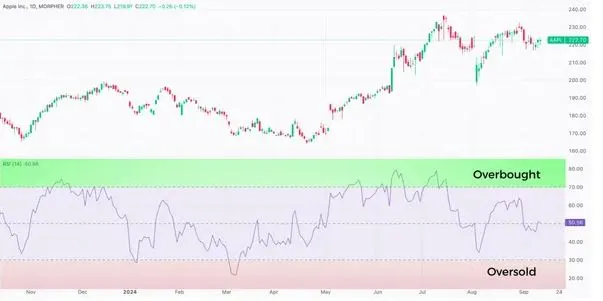
To successfully implement RSI trading strategies, it’s essential to understand how to interpret the indicator. Generally, an RSI reading above 70 signals that a security is overbought, while a reading below 30 indicates oversold conditions. However, these signals should not be taken in isolation.
For example, a stock can remain overbought or oversold for extended periods in strong trends. Therefore, it’s important to combine RSI readings with other technical tools to confirm potential reversals. Traders often use RSI alongside trendlines, moving averages, and other momentum indicators to build a more comprehensive picture of market conditions.
Spotting Divergences with RSI
One of the most effective ways to use RSI is by spotting divergences between the RSI and price movements. A divergence occurs when the price of an asset moves in the opposite direction of the RSI. This divergence signals that the current trend may be weakening, and a reversal could be on the horizon.
- Bullish Divergence: This happens when the price is making lower lows, but the RSI is making higher lows. It suggests that although the price is falling, the momentum is shifting, indicating a potential reversal to the upside.
- Bearish Divergence: In contrast, bearish divergence occurs when the price is making higher highs, but the RSI is making lower highs. This suggests that the upward momentum is fading, potentially leading to a price decline.
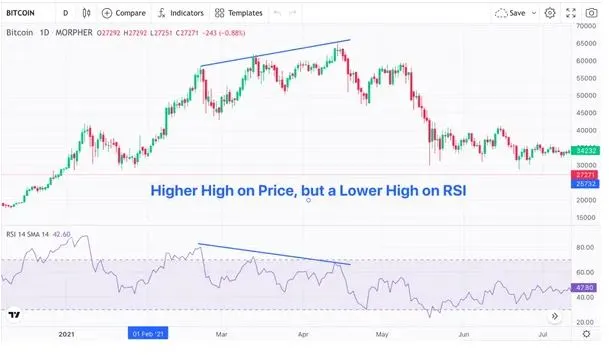
Divergences are powerful tools for traders using RSI trading strategies, especially in volatile markets where reversals can happen quickly. They are particularly useful in spotting overbought and oversold conditions before the broader market reacts.
Strategy 1: Candlestick Patterns and RSI
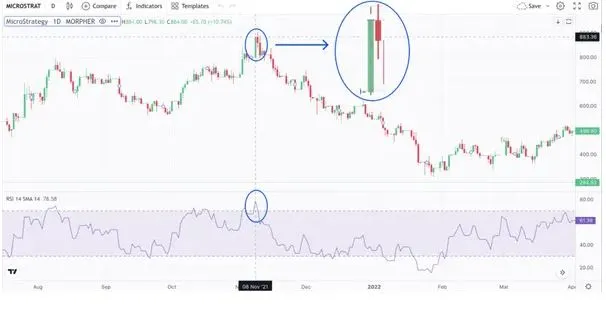
Combining RSI with candlestick patterns is one of the most reliable RSI trading strategies. Candlestick patterns offer valuable insights into market sentiment, while the RSI helps confirm whether a market is overbought or oversold.
One of the best combinations is using the Tweezer Top or Tweezer Bottom candlestick patterns with RSI. For example, if the RSI is above 70 and a Tweezer Top pattern forms, it indicates a likely reversal from an overbought condition. Traders can enter a short position with a stop-loss set above the Tweezer Top pattern’s high.
On the other hand, if the RSI is below 30 and a Tweezer Bottom pattern appears, it signals that the market is oversold. Traders can enter a long position, expecting a price reversal. Candlestick patterns, combined with the RSI, provide a solid foundation for timing trades with high accuracy.
Rules for Candlestick and RSI Strategy:
- Look for RSI above 70 for overbought or below 30 for oversold conditions.
- Identify a candlestick pattern (e.g., Tweezer Top for shorts, Tweezer Bottom for longs).
- Confirm the trade with a small candle body and set a stop-loss above the pattern’s high or low.
- Enter the trade in the direction of the reversal and use other technical indicators for additional confirmation.
Strategy 2: Mean Reversion and RSI
Mean reversion is a popular concept in trading that assumes prices will eventually return to their average or mean after a period of deviation. This strategy works particularly well with the RSI because it helps identify when an asset has moved too far from its average.
In this RSI trading strategy, traders wait for the RSI to signal overbought (above 70) or oversold (below 30) conditions. Once these signals are confirmed, they enter a trade in the opposite direction, assuming that the price will revert to its mean.
For example, in an oversold condition where the RSI falls below 30, traders anticipate a price rebound and enter a long position. Conversely, in an overbought market, traders expect the price to fall back toward the mean and enter a short position.
Rules for Mean Reversion and RSI Strategy:
- Wait for the RSI to reach overbought (above 70) or oversold (below 30) levels.
- Confirm a potential mean reversion by observing price action and other technical indicators.
- Enter a position opposite the current trend once the RSI signals a likely reversal.
- Exit the trade when the price moves back toward its mean, and the RSI approaches 50.
Strategy 3: Momentum Indicators and RSI
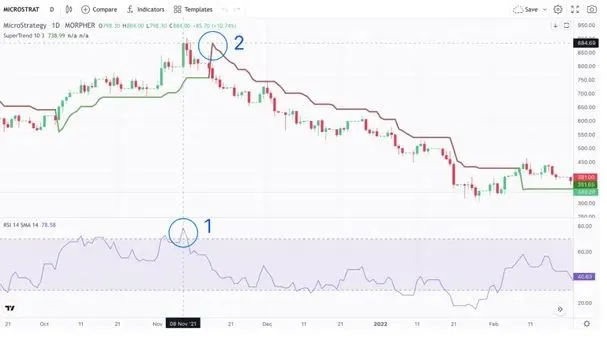
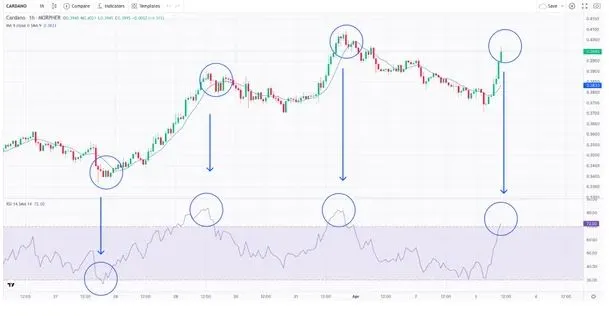
Another powerful RSI trading strategy involves combining the RSI with other momentum indicators like the SuperTrend. This strategy helps traders identify and capture market trends with greater accuracy.
The SuperTrend indicator provides entry and exit signals based on the average true range (ATR) and moving averages. When used alongside RSI, it can confirm overbought or oversold conditions and give traders more confidence in their trades.
For example, if the RSI is above 70, signaling an overbought condition, and the SuperTrend changes from green to brown, it indicates a potential trend reversal. Traders can then enter a short position, expecting a price decline. Conversely, if the RSI is below 30 and the SuperTrend shifts from brown to green, it signals an oversold market and a potential buying opportunity.
Rules for Momentum Indicators and RSI Strategy:
- Look for RSI readings above 70 or below 30 to identify potential reversals.
- Confirm the signal with the SuperTrend or another momentum indicator.
- Enter a position when both indicators signal a change in market direction.
- Use stop-loss orders and other risk management techniques to protect against potential losses.
The Importance of Risk Management
While RSI trading strategies can be highly effective, they should always be used with proper risk management. No strategy guarantees success in every market condition. It’s important to set stop-loss levels and position sizes to protect your capital.
Traders should also avoid over-relying on the RSI or any other single indicator. Combining the RSI with other technical and fundamental analysis tools provides a more complete view of market conditions and reduces the risk of false signals.
Conclusion
RSI trading strategies offer traders a reliable method for identifying overbought and oversold conditions, spotting divergences, and timing market entries and exits. By combining the RSI with candlestick patterns, mean reversion, and momentum indicators, traders can build a well-rounded trading plan. Whether you’re a novice or an experienced trader, using the RSI in conjunction with other technical tools can increase your chances of consistent success. Remember, successful trading requires discipline, risk management, and continuous learning. With the right approach, RSI trading strategies can be a valuable part of your trading toolkit.
Click here to read our latest article Blue Gold: A Critical Path to Safeguarding Our Future
This post is originally published on EDGE-FOREX.


