A long-legged doji is part of the broader doji family. This candlestick pattern has long wicks or shadows. Traders use it to predict price reversals in the market. The pattern consists of a candlestick with a small body, which has almost the same opening and closing price. A long-legged doji also features long upper and lower shadows, pointing to market indecision. This candlestick pattern helps traders make more informed trading decisions and grasp market sentiment correctly.
The article covers the following subjects:
Major Takeaways
- A long-legged doji candle is characterized by long shadows, which indicate price movement during trading, and a small real body, which suggests a balance between market forces.
- This candlestick pattern is often used in combination with other indicators to confirm signals and increase the efficiency of trading decisions.
- The appearance of a Doji at significant support or resistance levels serves to reinforce the signal’s reliability.
- The color of the candlestick can influence its interpretation: a red candle indicates a Bear Flag pattern, while a green one suggests a potential Bull Flag.
- The doji pattern is a valuable tool for traders seeking profitable entry or exit points.
- Understanding the long-legged doji candle pattern helps a potential change in the price direction or a shift in market sentiment.
What Is the Long-Legged Doji?
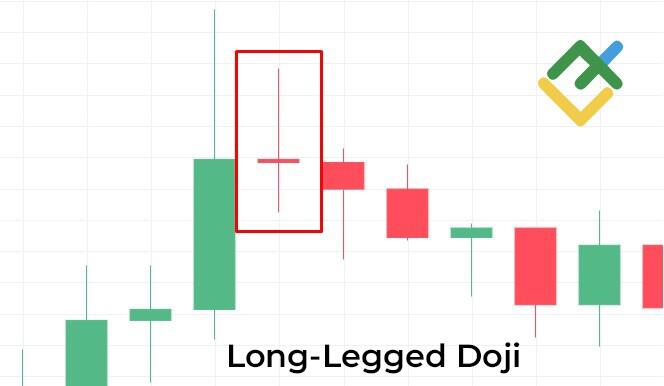
A long-legged doji is a candlestick pattern that can be frequently observed across various time frames, such as hourly and weekly charts, and serves as a crucial tool in technical analysis. It is distinguished by a small candle body and long upper and lower shadows, suggesting significant market uncertainty.
A doji pattern features extended upper and lower shadows that indicate equilibrium between buyers and sellers, a potential trend reversal on Forex, or the onset of a consolidation period. It assists traders in predicting potential shifts in price movement, such as bearish or bullish reversals, and empowers them to craft effective trading strategies.
When used in conjunction with other indicators, using long legged doji enhances the precision of trading decisions, aiding in the analysis of uptrends or downtrends.
How to Identify the Long-Legged Doji
Multiple time frame analysis can be used to recognize a doji with long wicks. The pattern is easy to spot due to its unique appearance:
- a small body in the center of the candle;
- long upper and lower shadows.
Long shadows indicate a strong price movement during the trading session, which indicates a high level of uncertainty in the market. It is important to remember that the length of shadows should be much longer than the candle body.

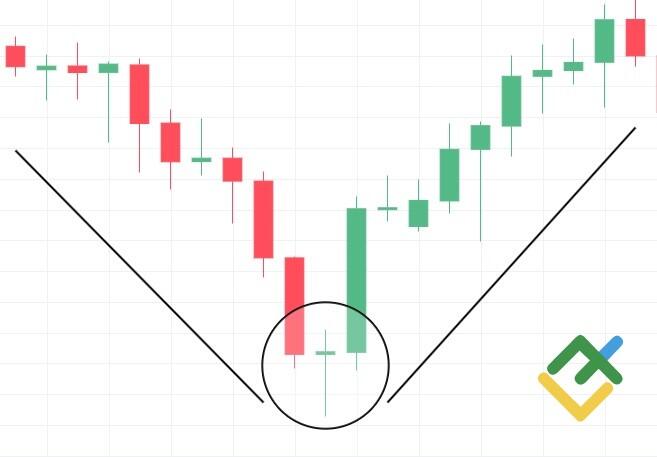
Identifying a long-legged doji during a bullish or bearish trend allows traders to detect possible bearish reversals or bullish reversals. For example, if the pattern appears near a resistance or support level, it may signal the beginning of a potential reversal.
Doji Candlestick Signals
The signal generated by the long-legged doji candlestick frequently requires confirmation. Despite its illustrative nature, the candlestick is not always a reliable reversal indicator. Therefore, traders should use additional technical analysis tools such as support and resistance levels, the RSI and MACD indicators, etc. Combining these tools with the long-legged doji pattern confirms the expected reversal and increases the probability of a successful trade.
Traders can avoid false signals and improve the accuracy of their forecasts by confirming signals received from the long-legged doji pattern. For instance, if a doji emerges at a support or resistance level, it offers a robust sign that a price reversal is imminent. In addition, technical indicators such as the RSI or MACD can help confirm the obtained signal if they also point to a trend reversal. If a doji candle appears when the RSI is in an overbought or oversold zone or when the price hits a new high or low, but the MACD does not increase, it reinforces the validity of the signal.
What Does Red Long-Legged Doji Candlestick Indicate?
A red bearish candlestick with long shadows on the chart often suggests that the bullish market may reverse. It is a candlestick pattern that signals uncertainty when the opening and closing prices are at almost similar levels, and the long shadows above and below suggest a balance between buyers and sellers. A red candle, especially after a strong uptrend, can warn traders of a bearish reversal, creating an opportunity to open a short position.
Furthermore, long-legged dojis may mark a period of consolidation or growth, after which the price falls. To confirm a trend reversal, traders may consider trading volume and employ additional indicators such as the RSI or MACD. In addition, it is essential to wait for confirmation by observing subsequent price action before making trading decisions solely based on candlestick patterns.

What Does Green Long-Legged Doji Candlestick Tell?
A green doji candlestick pattern signals a possible upward trend reversal. This pattern emerges when the opening and closing prices are at the same level or close to each other, with long upper and lower shadows indicating that the forces of supply and demand are nearing equilibrium. A green long-legged doji candlestick suggests that buyers are stronger despite sellers’ attempts to push the price down. When such a candle appears after a long downtrend, it may indicate the start of an uptrend, also known as a bullish reversal.
However, it is essential to consider other confirming signals, such as an increase in trading volume or tick volume, commonly used in the Forex market, and signals received from technical indicators to enhance the reliability of the forecast. A green long-legged doji can imply that a bullish sentiment is gaining traction and the market is ready to start an uptrend.
Does It Matter if A Long-Legged Doji Candlestick Is Red or Green?
The color of a doji candlestick with long shadows provides crucial insights into market sentiment, offering a more nuanced perspective on market trends. Specifically, a red doji candlestick signals a bear market when a closing price is lower than the opening price. This suggests that despite the ongoing battle between the buyers and sellers, the market is maintaining a bearish trend.
Conversely, a green candle assumes that bulls gain the upper hand in the market, suggesting an upward trend reversal, particularly if the candle appears after a prolonged downward movement.
Therefore, the color of the candle is crucial for traders to discern market sentiment and gauge the strength of a potential bullish reversal or a bearish reversal.
When Does Long-Legged Doji Candlestick Happen?
A long-legged doji candlestick indicates uncertainty in the market and fluctuating prices during a trading period. This candlestick is formed when the opening and closing prices are almost identical, but the long shadows indicate significant price movement in both directions.
A long-legged doji may appear due to high volatility, uncertain market conditions, or strong trading activity by buyers and sellers. This pattern often occurs when the market is experiencing short-term fluctuations or preparing for a trend reversal.
How Often Does Long-Legged Doji Candlestick Occur?
The long-legged doji candlestick emerges less frequently than other patterns, such as a common doji or a hammer candlestick. However, it is deemed a significant harbinger of a trend reversal, especially when it forms near support or resistance levels. Despite its rarity, its appearance often signals a possible change in market sentiment. As the pattern suggests that forces of supply and demand are almost even, it should be regarded as an important indicator, especially when confirmed by other technical signals.
How to Trade the Long-Legged Doji
Let’s analyze the EURUSD pair on a one-minute (M1) time frame to delve into the intricacies of the trading strategy based on the long-legged doji candlestick pattern. The first step is to analyze the market situation.
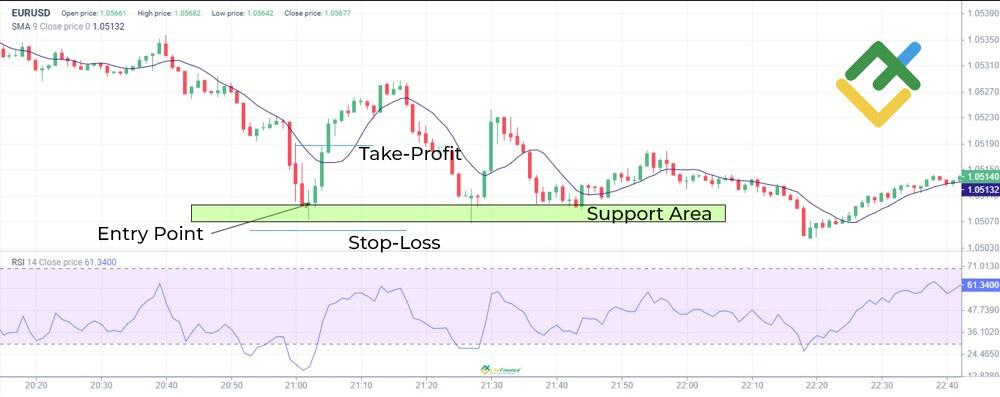
The chart shows that the RSI is at 17.83, indicating that the asset is significantly oversold. A long-legged doji pattern emerged in the oversold zone, signaling an upward trend reversal. In this scenario, the pattern is confirmed by RSI values, enhancing the likelihood of a precise market entry.
Once the signal was confirmed, a long trade was opened at 1.05097, corresponding to the candlestick’s closing price. To mitigate potential risks, a stop-loss order was set at 1.05057, just below the lower shadow. A take-profit order is placed at 1.05187, slightly below the nearest resistance level. As a result, this trading strategy can bring profits on an anticipated price reversal.
It is crucial to not only establish protective orders but also manage them properly after opening a trade. If a trading instrument showcases a sustained upward movement, it is better to move your stop-loss order to a breakeven point closer to the entry point, thereby reducing potential losses. In a similar manner, a take-profit order can be moved slightly higher. Meanwhile, it is essential to adhere to the principles of risk management. In addition, you can apply moving averages (SMA) to confirm your trading decision. If the price remains above the MA, the upward movement is strong.
After opening the trade, the price moved in the predicted direction, reaching 1.05187 and triggering the take-profit order. This approach helps to trade the long-legged doji effectively, minimizing risks and increasing the chances of a stable profit.
Pros and Cons
A long-legged doji candlestick has both advantages and disadvantages. It can be an indispensable tool for identifying trend reversals. However, as with any pattern, its signals require confirmation by additional indicators.
What Are the Advantages of a Long-Legged Doji Candlestick?
The doji candle boasts several key advantages that make it a staple pattern for traders:
- Uncertainty indicator. The pattern points to a balance of power between buyers and sellers, which may hint at a potential reversal.
- Clear visual identification. The long shadows make the candle easily distinguishable on the chart, facilitating recognition.
- Entry and exit points. Traders use this candlestick pattern to identify entry or exit points, provided they are confirmed by other indicators.
- Support and resistance levels. The emergence of the doji pattern in key areas can facilitate the identification of support and resistance levels.
- Effectiveness in combination with other tools. This candlestick pattern pairs well with technical indicators, enhancing its performance.
What Are the Disadvantages of a Long-Legged Doji Candlestick?
At the same time, a long-legged doji candle also has several drawbacks to consider:
- Poor accuracy without confirmation. The pattern may fail to generate accurate signals without other indicators.
- It often appears in conditions of market uncertainty. The long-legged doji pattern is associated with short-term market uncertainty, which does not always indicate a long-term trend.
- Exposure to false signals. Another potential pitfall of this pattern may appear when the market is moving sideways, giving false reversal signals.
- Dependence on market conditions. The pattern’s efficiency decreases in highly volatile market conditions or during periods of low liquidity.
- Interpretation is not always straightforward. It can be difficult for beginners to interpret and trade the pattern correctly.
Long-Legged Doji vs. Other Doji Patterns
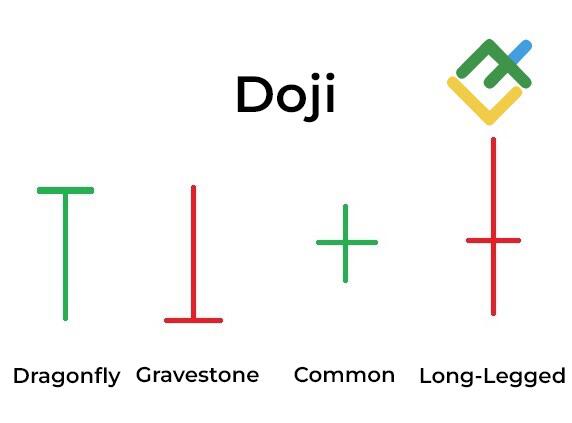
Depending on the characteristics of the shadows, there are several types of doji candles:
- A common or standard doji is a candlestick with short or almost no shadows. It reflects the balance between buyers and sellers in the market. The pattern often precedes a reversal or continuation of an existing trend.
- A dragonfly doji is characterized by a long lower shadow and an insignificant or absent upper shadow, indicating that the volume of sales exceeded the volume of purchases at the opening of the candle. However, after the price declined, more buy orders appeared in the order book, and the price recovered. This candlestick pattern may signal a bullish reversal.
- A gravestone doji pattern is defined by a long upper shadow and an absent lower shadow. This candlestick suggests that at the time of opening, buyers pushed the price lower, but sellers eventually prevailed. This pattern frequently signals a potential downward price reversal.
Compared to other types of doji, a long-legged doji candlestick most clearly illustrates market fluctuations. However, its interpretation requires deeper analysis and confirmation signals such as support and resistance levels or complementary indicators. At the same time, dragonfly and gravestone dojis provide more straightforward signs of a trend reversal, which makes them easier to use.
What Candlestick Pattern is Similar to Long-Legged Doji Candlestick?
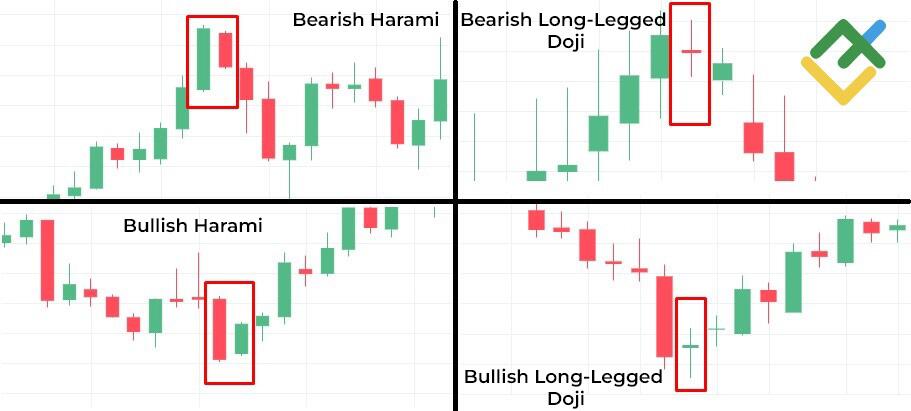
The harami pattern is similar to a long-legged doji and can also signal a trend reversal. The harami consists of two candles: the first one is long, and the second one is short, with the body of the first candle fully overlapping the body of the second one.
The similarities with the long-legged doji lie in the fact that both patterns indicate uncertainty in the market when bullish and bearish forces are in equilibrium. Equilibrium or indecision means that the price is no longer moving in the direction it once was, and market sentiment may change. Like the long-legged doji, the harami pattern suggests that the current trend is losing strength. However, unlike the long-legged doji, two candlesticks of the harami candlestick chart pattern do not have long shadows.
What is the Opposite of Long-Legged Doji Candlestick?
An engulfing candlestick pattern is the opposite of the long-legged doji. It consists of two candles: the first is a small bullish or bearish candlestick, and the other is a large candle of the opposite color, which completely overlays the body of the previous one. This signals a strong change in market momentum.
Unlike a long-legged doji, which reflects market uncertainty, an engulfing pattern points to a strong bearish or bullish trend. In a bull market, it may signal a continuation of an upward trend, while in a bear market, it may indicate a potential decline. The engulfing candlestick pattern provides traders with a clear signal for making trading decisions.

Conclusion
The long-legged doji candlestick is a key market uncertainty pattern that assists traders in anticipating a potential trend reversal. This pattern, distinguished by its long shadows and small real body, reflects an equilibrium of market forces, making it a valuable analysis tool.
Since this candlestick pattern may generate false signals in high volatility conditions, it is recommended to use other technical indicators to enhance the reliability of obtained signals. When employed effectively, the pattern serves as a reliable guide for identifying price reversals, facilitating the development of successful trading strategies.
Long-Legged Doji Candlestick Pattern FAQs
A long-legged doji is a valuable tool for assessing market uncertainty. Combined with other indicators, it can provide signals for determining optimal market entry and exit points. It can be applied to short-term trading and long-term investing.
A standard doji has a symmetrical body and short shadows, while a long-legged doji features long shadows and a small candlestick body. Long shadows signal a strong price movement during the candlestick formation.
A long-legged doji at the end of a downtrend signals a possible reversal. Long shadows indicate that the forces of supply and demand are nearing equilibrium, which creates uncertainty and indicates a possible change in market direction.
Unlike a long-legged doji, a spinning top candlestick has a larger body, indicating a greater dominance of one side. The spinning top is a more neutral pattern as it does not always signal a clear trend reversal, unlike the doji, which shows uncertainty and may signal an imminent trend reversal.
A long-legged doji with high volume indicates a significant clash between buyers and sellers, reflected in the pattern’s long shadows and high tick volume. Each tick represents a completed transaction, contributing to the formation of the doji. This suggests a high degree of market uncertainty and significant price shifts.
A long-legged doji differs from a dragonfly doji primarily in the length of the shadows on both sides. A dragonfly doji has only a lower shadow, suggesting that buyers are outperforming sellers. Meanwhile, a long-legged doji has long shadows below and above the candle’s body.
The content of this article reflects the author’s opinion and does not necessarily reflect the official position of LiteFinance broker. The material published on this page is provided for informational purposes only and should not be considered as the provision of investment advice for the purposes of Directive 2014/65/EU.
According to copyright law, this article is considered intellectual property, which includes a prohibition on copying and distributing it without consent.
{{value}} ( {{count}} {{title}} )
This post is originally published on LITEFINANCE.