
Candlestick charts, rooted in 18th-century Japan, continue to illuminate the complexities of financial markets, offering traders and investors a useful tool for insightful analysis.
Japanese candlesticks, created by rice merchant Munehisa Homma, represent four key parameters: the opening and closing price and the highs and lows for a specific period.
There are bullish and bearish patterns that help predict market movement and signal trend reversals or continuations.
This guide explores bullish candlestick patterns, which serve as signals allowing you to initiate profitable long trades.
The article covers the following subjects:
Major Takeaways
| Main thesis | Conclusions and key points |
| What is a bullish pattern? | A bullish candlestick pattern is a single candlestick or a combination of several Japanese candlesticks on the chart, reflecting the asset’s volatility and signaling potential upward price movement. |
| What are the types of bullish patterns in candlestick analysis? | There are two types of bullish patterns in trading: those that signal a price reversal after a prolonged decline, such as a Hammer, a Morning Star, or a Piercing Line, and those that confirm the continuation of an uptrend, like the Rising Three Methods, the Three White Soldiers, and the Bullish Marubozu. |
| How do bullish patterns influence the market? | Bullish patterns significantly influence the market, reflecting the psychology of price movement and traders’ behavior. Patterns represent key moments in the market and reflect the impact of various factors on the quotes. |
| Why do bullish patterns appear on the chart, and what do they mean? | Candlesticks display price performance over a certain period, indicating price opening and closing levels, as well as lows and highs. Bullish candlesticks or their combinations signal an upcoming change of direction after a long bearish trend or the end of a short-term correction. |
| Trading strategies using bullish candlestick patterns | Candlestick analysis can be effectively applied in short-, medium-, and long-term trading. One of the popular strategies within this approach is Price Action. |
| What are the best time frames for trading bullish patterns? | Different time frames are suitable for trading bullish patterns, depending on the chosen strategy. Generally, the higher the time frame, the stronger the signal for a reversal or trend continuation. Notably, lower time frames are often prone to producing false signals due to market noise. |
| Which financial assets form bullish patterns, and where do they matter most? | Bullish patterns can emerge across various financial instruments, including stocks, currency pairs, and cryptocurrencies. However, in the stock and commodity markets, they tend to provide stronger signals. |
What is a Bullish Candlestick?
A bullish candlestick is a candlestick where the closing price is higher than the opening price. On a chart, it is usually green or white, depending on a trading platform’s settings.
A bullish candlestick shows four parameters:
- Opening price;
- Closing price;
- Lowest price;
- Highest price.
A candlestick becomes bullish when the price rises in a certain period. A set of single bullish candlesticks or their combination form a candlestick pattern that suggests a possible change in the market. These bullish candlestick patterns warn traders of an upward price reversal or a continuation of the ongoing uptrend.
Bullish Candlestick Patterns: Continuations vs. Reversals
Bullish candlestick patterns’ appearance on the price chart indicates buyers’ dominance in the market, which means that demand for an asset outweighs supply. As a result, the price will highly likely rise.
When trading volumes increase notably alongside the emergence of bullish candlestick patterns, it serves as a strong indicator of an impending correction or potential upward reversal.
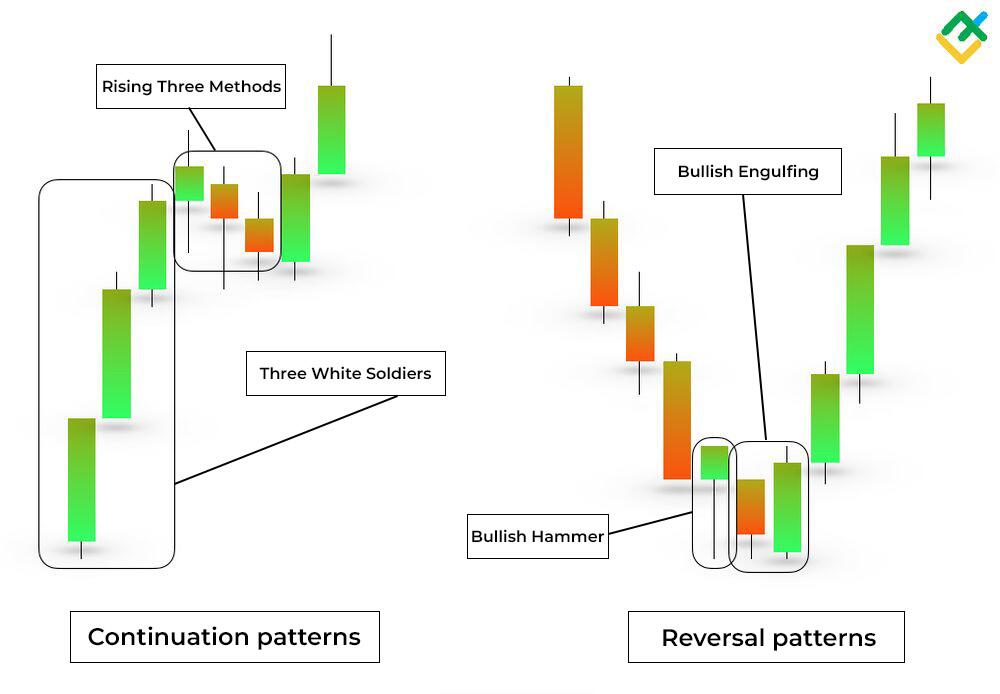
There are two types of bullish patterns:
- Reversal patterns are candlesticks that occur at the end of a downtrend, signaling a possible upward reversal. These patterns include the Hammer, Bullish Engulfing, Inverted Hammer, Piercing Line, Morning Star, Bullish Harami, and more.
- Continuation patterns appear in an existing uptrend and indicate its extension. Such patterns include the Three White Soldiers, the Rising Three Methods, a Bullish Marubozu, the Separating Lines, and various types of price gaps.
Common Bullish Candlestick Patterns
In candlestick analysis, many bullish patterns can be combined. These Japanese candlesticks include the Bullish Belt Hold, a Bullish Counterattack, a Tower Bottom combination, the Upside Tasuki Gaps, and many others.
Hammer and Inverted Hammer
A Hammer and Inverted Hammer candlestick patterns are crucial tools in technical analysis. Traders utilize these patterns to identify potential reversals in the market.
A Hammer is a bullish reversal candlestick pattern that forms at the bottom of a downtrend, signaling a potential bullish reversal. It features a small green or red body near the top of the price range and a long lower wick, indicating strong buying pressure.
An Inverted Hammer can also appear at the bottom of a downtrend, signaling a potential upward reversal. This pattern features a small body located at the bottom of the candle and a long upper wick. It reflects the struggle between buyers and sellers, where buyers attempted to gain control but were ultimately pushed back by sellers. Nonetheless, this pattern shows a steady advance of buying pressure.
Both patterns need extra confirmation, such as checking trading volume or looking for subsequent reversal candles. This provides assurance of the pattern’s validity and helps minimize the chances of false signals. Early pointing of these candlestick patterns allows traders to make better-informed decisions.
An example of these patterns is shown below on the Boeing Company (#BA) weekly chart.
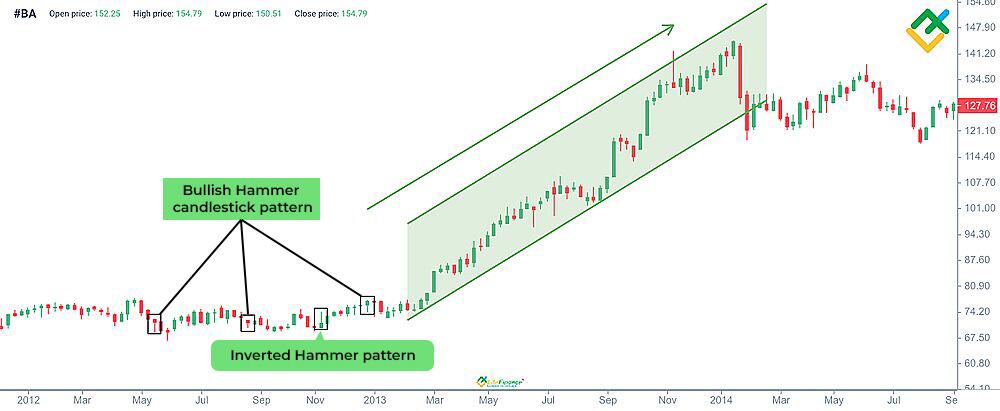
A series of Hammer and Inverted Hammer patterns appear following a prolonged consolidation, which is considered a bullish signal. As anticipated, the stock price begins to rise, surging from $67.50 to $141.20 during the uptrend.
Bullish Engulfing
A Bullish Engulfing pattern helps traders identify potential trend reversals.
This pattern is formed by two consecutive candlesticks. The first candlestick is bearish, while the second one is bullish, closing above the first candle’s closing price. The first candle is entirely within the range of a second one. A Bullish Engulfing pattern suggests buyers are beginning to take control over sellers, which may signal the start of an uptrend.
When this pattern emerges, traders usually open long positions. Notably, a Bullish Engulfing pattern works best within a broader technical analysis, including determining support and resistance levels, studying trading volume, etc.
Furthermore, when combined with technical indicators such as oscillators or trend lines, a Bullish Engulfing pattern can significantly increase the probability of successful trading. The daily gold (XAUUSD) chart below shows an example of a Bullish Engulfing pattern.
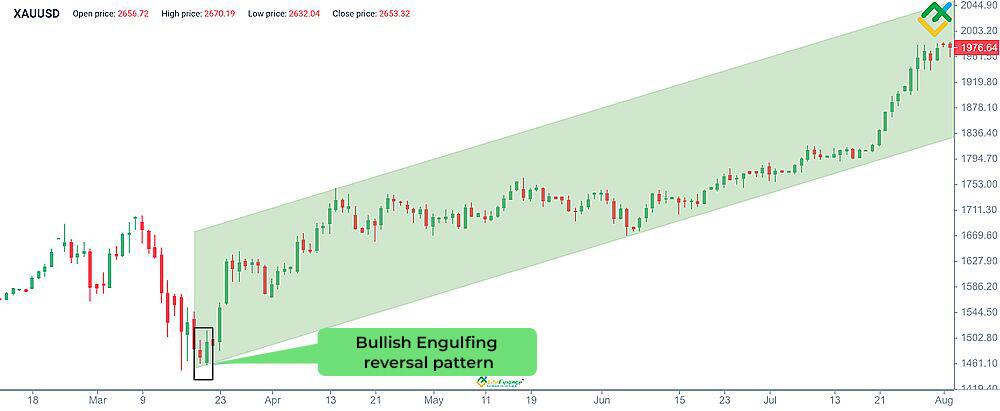
After a one-week price decline, a Bullish Engulfing candlestick pattern appeared on the chart, signaling a potential trend reversal in the market. Consequently, the price of the precious metal has soared from $1,461.10 to $1,976.64.
Morning Star
A Morning Star pattern is considered one of the most essential signals of an uptrend reversal in trading.
This pattern consists of three candlesticks. The first candlestick is a strong, bearish bar. The second one is a small candlestick with a short body positioned below the close of the first candlestick, indicating market uncertainty. The third one is a bullish bar, confirming the trend reversal.
A Morning Star often appears at the end of a long downtrend and signals that sellers’ momentum is fading.
Under these conditions, traders look for optimal points to enter long positions. The pattern is mostly observed on daily and weekly charts.
To successfully employ a Morning Star pattern, traders should use additional technical tools such as trading volume, indicators and support/resistance levels, helping confirm signals and minimize risks associated with trading.
An example of a Morning Star pattern is shown below on the daily NASDAQ100 index (NQ) chart.
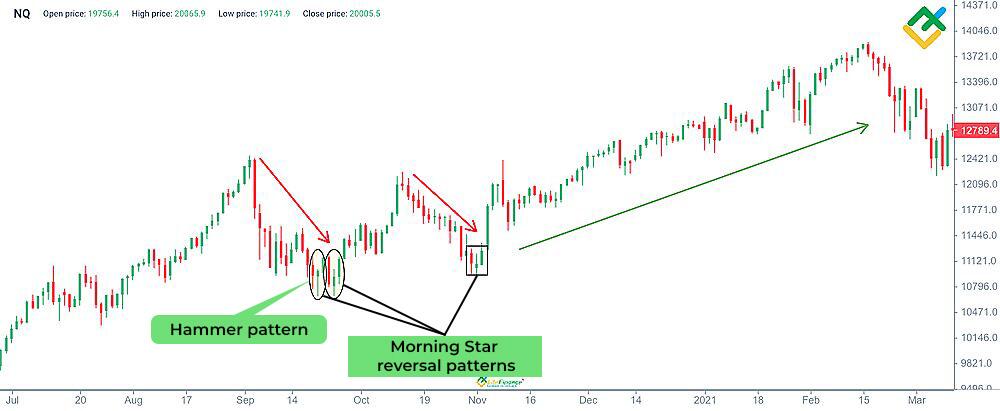
The Morning Star pattern indicates here that the asset has reached a low price area. A series of these patterns, along with Hammer patterns, confirm a bullish trend.
Three White Soldiers
A Three White Soldiers candlestick pattern is one of the most reliable and prominent signals in technical analysis. Traders often use this pattern to identify potential price reversals or to confirm the continuation of an uptrend in the market.
This pattern occurs following the end of a downtrend or after a downward correction within an uptrend. It includes three consecutive bullish candlesticks, each of them closing higher than the previous candle, reflecting an increase in buying interest.
The first candlestick is typically small, indicating a reduction in selling pressure. The body of the second candle increases significantly, suggesting the onset of confident buying. The third candlestick is always bullish (green or white). It completes the pattern and confirms the rapid growth of the price. The fourth candlestick and those that follow generally exhibit similar behavior. Thus, the candlesticks close progressively higher on each subsequent trading day.
An important feature of this pattern is its formation near a support level. When the Three White Soldiers pattern appears on the chart, traders often open long positions in anticipation of further gains. However, this pattern requires additional confirmation.
An example of a Three White Soldiers pattern is presented below on the 4-hour Nvidia Corp. stock (NVDA) chart.
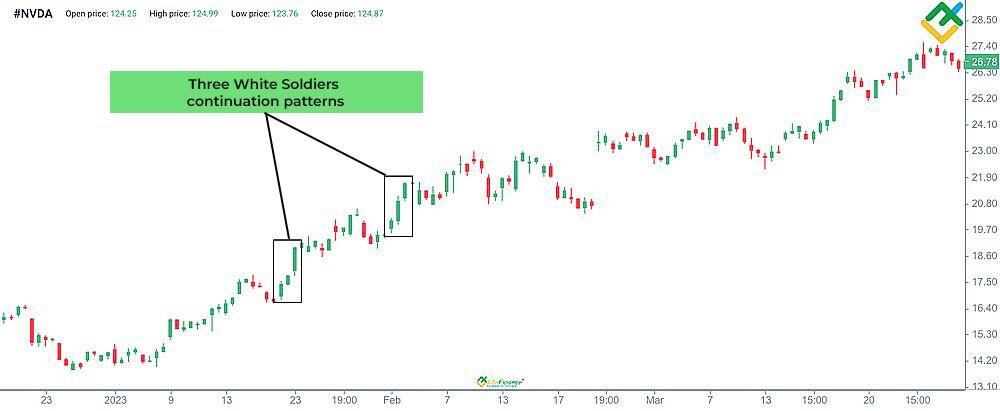
In this case, the Three White Soldiers patterns signal the continuation of an uptrend. Once the patterns form, the value of the securities continues to advance.
Doji
A Doji candlestick pattern reflects market uncertainty, showing that the powers of bulls and bears are temporarily equal. The candlestick is characterized by almost identical opening and closing prices.
This pattern can signal both a possible reversal and trend continuation, depending on the market situation.
Let’s take a closer look at the bullish Doji types and their features:
- A regular Doji is a classic pattern with nearly equal opening and closing prices, indicating market uncertainty.
- A Long-Legged Doji indicates significant price fluctuations during the period, yet the price ultimately returns to the starting point. This situation suggests a tussle between buyers and sellers, highlighting ongoing market indecision.
- A Dragonfly Doji forms when the price drops considerably during a trading period, only to return to the opening level. This pattern can indicate a potential uptrend, suggesting that bears have failed to maintain their positions.
The weekly AT&T Inc. (#T) stock chart below shows an example of the Doji and Dragonfly Doji patterns.
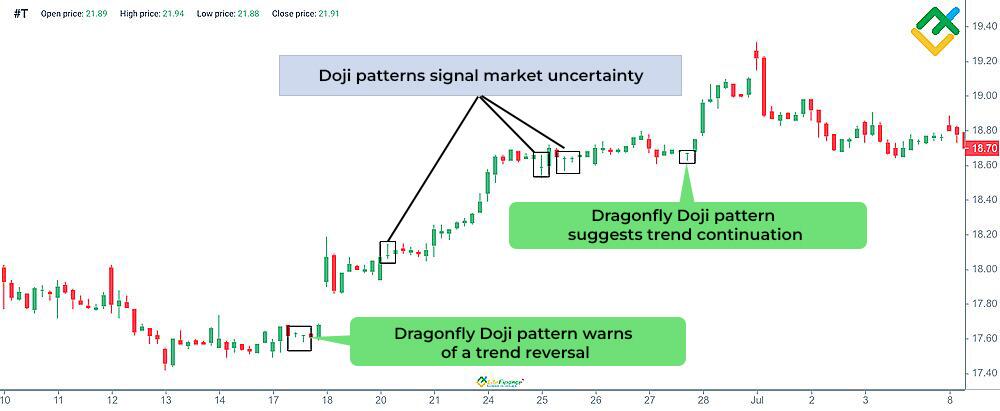
A Dragonfly Doji bullish pattern bolsters the asset’s price appreciation. Subsequent Doji patterns indicate market uncertainty.

Bullish Harami
A Bullish Harami candlestick pattern serves as a reversal signal in the market, often marking the end of a downtrend and the beginning of an upward momentum.
This combination consists of two candlesticks. The first one is a large bearish candle, reflecting the significant selling pressure. The second one is a smaller bullish candlestick, which is entirely within the body of the first candlestick.
After a prolonged price decline, the appearance of a Bullish Harami often signals to traders that bearish momentum is weakening. The second candlestick reflects market indecision, suggesting that bulls may be preparing to take control.
The pattern becomes more reliable when the market confirms it with an upward move, such as a price gap or a subsequent candle closing above the high of a Harami pattern’s second candlestick.
Additionally, the second candlestick of a Bullish Harami pattern can be a Doji. Such a phenomenon is called Harami Cross, which makes the pattern more effective.
Like other candlestick patterns, a Bullish Harami should be viewed as a supplementary analysis tool. Thus, it is essential to seek confirmation from additional indicators and fundamental factors.
A prime example of a Bullish Harami pattern is demonstrated below on the daily WTI (USCRUDE) chart.
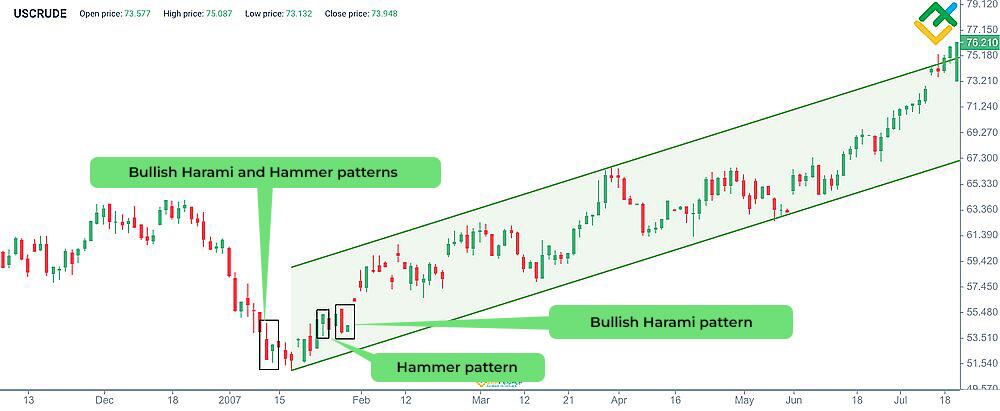
The appearance of a Hammer pattern, which turned out to be a Bullish Harami pattern, signaled a price reversal. Subsequent candlestick patterns confirmed the opening of major long trades, and the price continued to advance within a new uptrend.
Piercing Line
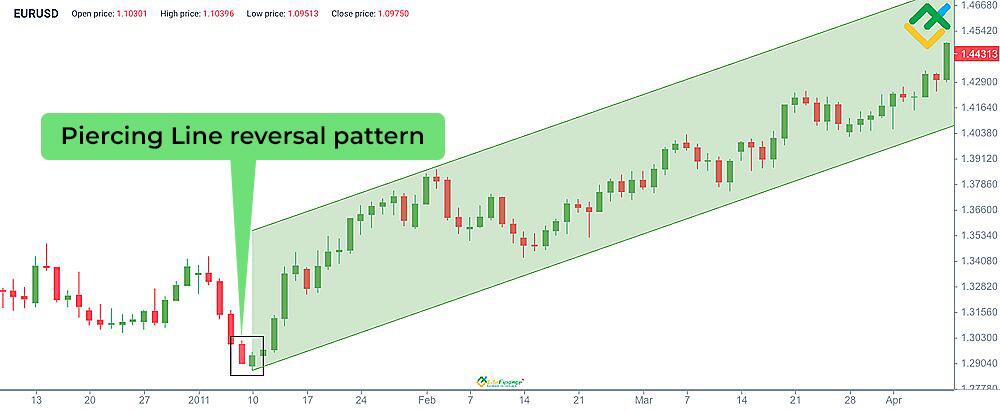
A Piercing Line candlestick pattern is considered an important technical analysis tool. This pattern is formed by two candlesticks and signals a possible change from a downtrend to an uptrend.
The pattern consists of a long bearish candle, indicating the continuation of the current downtrend, followed by a second candle that opens below the previous candle’s low but closes above the middle of its body. Such a close indicates the strength of bulls and the exhaustion of bears, pointing to a potential trend reversal.
Traders often consider long positions when this pattern occurs on a chart. A stop-loss order should be set below the first candle’s low.
An example of a Piercing Line pattern is presented on the daily EURUSD chart.
Tweezer Bottoms
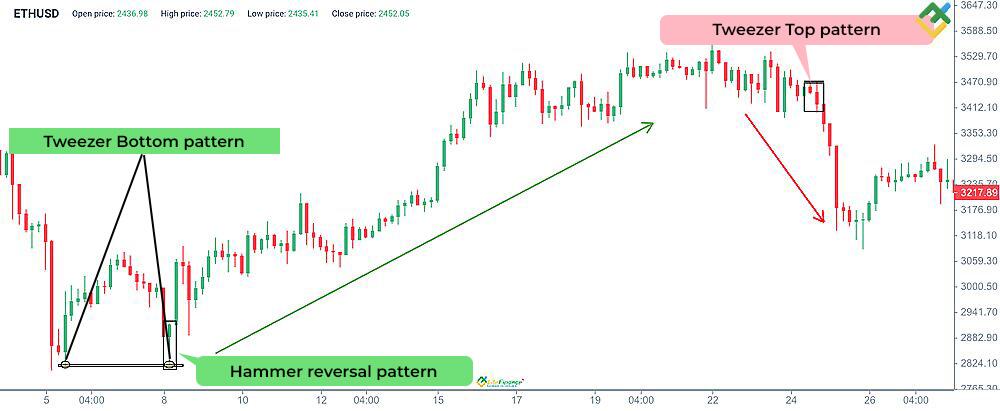
The Tweezer Bottom candlestick pattern usually appears after a prolonged bearish trend. Its key feature is the presence of two consecutive candles with the same low, creating a shape that resembles a pair of tweezers.
The Tweezer Bottom emergence on a chart can indicate that sellers are weakening and buyers are gaining strength. When this pattern forms, traders often close their short positions or set a trailing stop order.
The 4-hour ETHUSD chart below shows an example of a Tweezer Bottom pattern.
How to Identify Bullish Patterns
Follow these simple rules to identify bullish patterns:
- Determining market trends. Bullish patterns usually form in a rising market, at the end of a downtrend, or during consolidation phases. Use moving averages, trend lines, and indicators to identify the current market phase.
- Recognizing classic bullish patterns. Learn to identify key bullish patterns such as a Hammer, a Bullish Engulfing, a Piercing Line, and a Morning Star. These patterns signal a possible change in trend direction or trend continuation.
- Using volume for confirmation. Trading volume confirms the formation of bullish reversal patterns or candlesticks, signaling buyers are beginning to take control of the market.
- Indicator analysis. The MACD, RSI, and stochastic indicators can provide additional signals of bullish momentum. For example, the MACD rising above the signal line or the RSI value leaving the oversold zone may indicate a bullish sentiment.
- Risk assessment and capital management. Even after successfully identifying a bullish pattern, it is important to evaluate risks and identify possible exit points. Use stop-loss and limit orders to minimize losses in case of unexpected market changes.
- Confirmation with chart patterns. The Double Bottom or Bull Flag chart patterns are additional indicators of a bullish trend.
- Market monitoring and strategy adjusting. Constantly watch market developments and update your strategy as conditions change.
Using Bullish Candlestick Patterns in Trading: A Practical Example
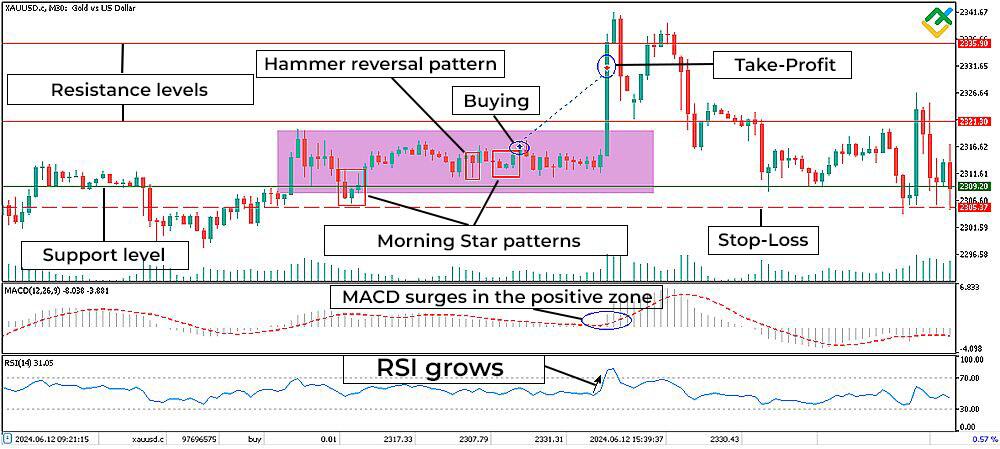
This section focuses on the use of bullish candlestick patterns in the XAUUSD pair trading.
- Technical analysis of the gold price has revealed key support and resistance levels.
- The Morning Star and Hammer candlestick patterns were identified within the long accumulation channel.
- The second Morning Star pattern confirmed the previous patterns, allowing traders to enter a long position with the minimum lot size at $2,317.33.
- The MACD crossed above the zero line and began to rise steadily in the positive zone, while RSI values held at 50 before starting to increase, providing a strong bullish signal.
- A stop-loss order, in this case, was placed at $2,307.79 below the identified candlestick patterns.
- A take-profit order was preliminary set at $2,331.31.
- The breakout of the upper boundary of the channel has prompted the growth towards the nearest resistance level of $2,321.30.
- The trade was closed with a profit at the $2,330.43 level.
Risk Management with Bullish Candlestick Patterns
When the market faces high volatility and uncertainty, experienced traders scrutinize candlestick patterns. Bullish candlestick patterns are particularly significant as they can signal a potential upward reversal or growth continuation.
To apply these patterns effectively, you need to understand their meaning and know how to integrate them into your risk management strategy.
The most popular candlestick patterns indicating rising prices include a Bullish Engulfing, a Hammer, an Inverted Hammer, a Piercing Line, a Morning Star, and the Three White Soldiers. Each of these patterns forms on the chart in a specific market situation and can be a signal to open long positions.
| Pattern | Description | Reliability | Stop-Loss |
| Bullish Engulfing | A large bullish candlestick that completely engulfs the previous bearish one. | High near strong support levels. | Below the second candlestick’s low or support. |
| Hammer | A small body at the top of the candlestick with a long lower shadow. | High near support levels. | Below the candlestick’s low. |
| Piercing Line | A combination of one red candle followed by a bullish one that overlaps a significant portion of the previous bearish candlestick. | Moderate during a correction. | Below the right candlestick’s low. |
| Inverted Hammer | A small body at the bottom of the candlestick with a long upper wick. | Moderate near support or correction ending point. | Below the candlestick’s low. |
| Morning Star | A combination of three candlesticks: a bearish candle with a large body, one short-bodied candle, and a long white/green one. | High near key support levels. | Below the pattern or support. |
| Three White Soldiers | The pattern consists of three or more bullish candlesticks in a row. The second and third candles should be larger than the others. | High near support or correction ending point. | Below the first candlestick’s low. |
You should always follow money management rules when using patterns. Moreover, pay attention to the stop-loss and take-profit orders and review your trades regularly. This approach will enhance your trading efficiency and help reduce potential losses.
Conclusion
Trading using bullish candlestick patterns involves the ability to read and interpret price charts to make informed trading decisions. These patterns provide valuable clues for entering and exiting trades.
Nevertheless, despite their effectiveness, these candlesticks do not provide a complete assurance of success. Thus, it is advisable to utilize them with other analysis tools and adhere to the risk management rules.
The context in which a pattern emerges, including factors like support and resistance levels, trading volume, and various indicators, influences its reliability and effectiveness.
Try to trade bullish candlestick patterns on a LiteFinance demo account.
Get access to a demo account on an easy-to-use Forex platform without registration
FAQ’s
One of the most reliable bullish patterns is a Bullish Engulfing pattern. Traders often view this candlestick pattern as a signal of a possible market reversal and the beginning of an upward movement.
A bullish pattern is a combination of Japanese candlesticks on a chart that signals a possible upward reversal or continuation of the present uptrend. Investors and traders use these patterns to identify favorable moments to buy assets.
A daily bullish pattern is a chart pattern used to predict reversals or continuation of an uptrend. This pattern is formed on the D1 time frame. Each candlestick of the pattern displays the range of price changes over a given period.
To determine a bullish trend, look for a consistent increase in highs and lows on the price chart. This movement reflects strong buyer interest and their readiness to buy the asset at progressively higher prices.
One of the most common bullish candlestick patterns is a Hammer. This pattern appears after a decline and indicates a potential upward trend reversal. A Hammer candlestick has a small body and a long lower shadow that is at least twice the length of the body.

The content of this article reflects the author’s opinion and does not necessarily reflect the official position of LiteFinance. The material published on this page is provided for informational purposes only and should not be considered as the provision of investment advice for the purposes of Directive 2004/39/EC.
{{value}} ( {{count}} {{title}} )
This post is originally published on LITEFINANCE.


