A capital spillover from the US dollar to its Canadian counterpart amid a decelerating US economy and expectations of the Fed’s monetary expansion dragged USDCAD quotes down. However, the loonie will have to pay the price for its August rally in September. Let’s discuss this topic and make a trading plan.
The article covers the following subjects:
Highlights and key points
- The S&P 500 rally and the greenback selling in August boosted the loonie.
- September is the worst month for US stock indices.
- Coupled with the continuing BoC rate cut cycle, the USDCAD pair risks starting an upward correction.
- The pair may reach 1.359 and 1.364.
Weekly Canadian dollar fundamental forecast
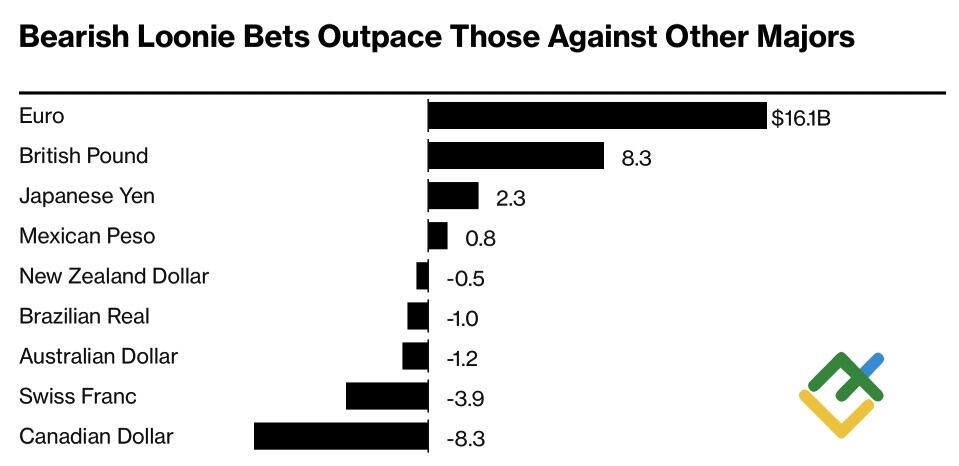
It is easy to swim if another holds up your chin. This is how the position of USDCAD bears can be described in August. The slowdown of the US economy and hopes for aggressive monetary expansion of the Fed forced investors to turn away from the greenback. One of the beneficiaries was the Canadian dollar, with speculative net shorts decreasing from a record $14 billion to $8.3 billion. However, as the autumn season arrives, everything risks turning upside down.
Speculative positions on G10 currencies
Source: Bloomberg.
The desire to divest the US dollar was so strong that hedge funds and asset managers set aside the Bank of Canada’s intention to maintain the monetary easing cycle and overlooked the impact of declining oil prices on the Canadian economy, which relies heavily on oil exports. They have factored in the anticipated reduction of the federal funds rate by 100 bps in 2024 and the improvement of global risk appetite amid the rally of US stock indices.
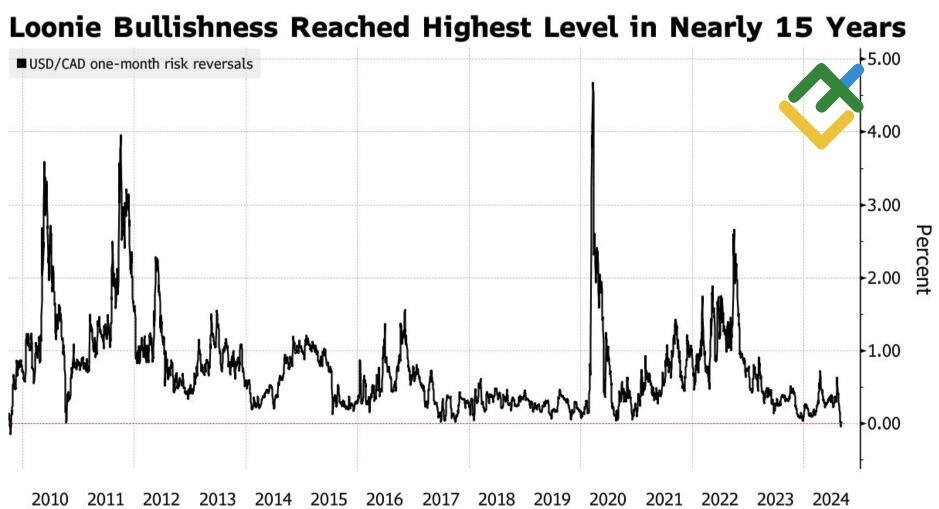
As a result, the USDCAD risk reversals have become negative for the first time since 2010, indicating a greater likelihood of a decline in the pair’s value.
USDCAD risk reversals
Source: Bloomberg.
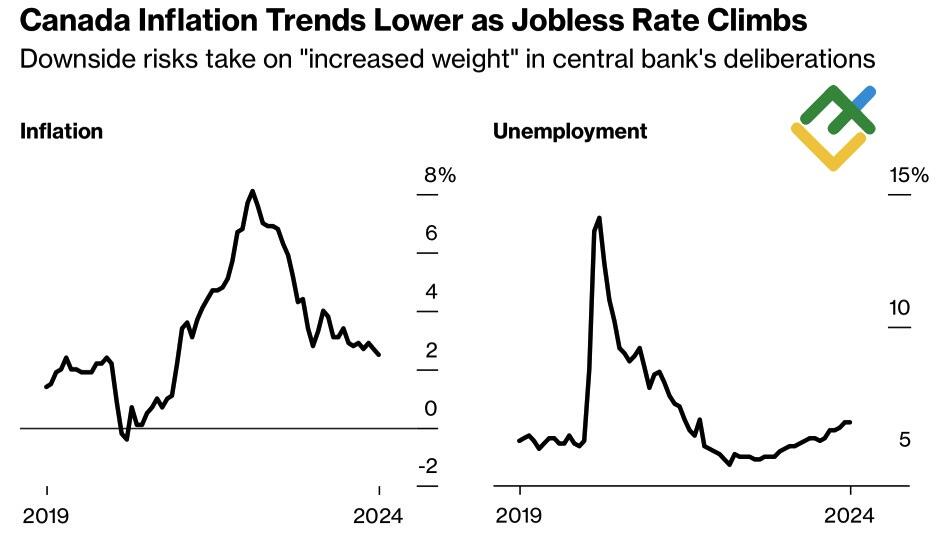
Following the summer vacation period, investors realized that it was too early to write off the US dollar. In contrast to the actions taken by the Fed, the Bank of Canada has already reduced the overnight rate twice from 5% to 4.5%. A third reduction is expected at the regulator’s September 4 meeting. The primary factors cited are the rising unemployment rate, which has reached a two-year high, and the inflation rate, which has remained within the 1-3% target range for seven consecutive months.
At previous meetings, the Bank of Canada has not signaled future action but noted that its decisions will depend on the data. Bloomberg experts predict that the central bank will cut the overnight rate at the next five meetings, including the September meeting. As a result, borrowing costs will fall to 3.25% by April 2025. After that, there will be a pause.
Canada’s inflation and unemployment rate
Source: Bloomberg.
It is a big question whether the Fed will cut the fed funds rate by 100 basis points in 2024. Furthermore, the decline in US stock indices evoked a sense of déjà vu, commencing in a similar fashion to that observed in August. The tech giant NVIDIA‘s market cap tumbled by $280 billion in a single day, representing the fastest decline for any US company in history. Stock indices have embarked on a downward journey, and it is unclear whether they will recover in September, which is historically the worst month for them. As they say in the stock market: “Wake me up when September ends.”
Weekly USDCAD trading plan
USDCAD bears lost an important advantage – support from the US stock indices, and the continuation of the monetary expansion cycle of the Bank of Canada gives grounds to open long trades, adding them to the ones initiated at 1.3475. The bullish targets are 1.359 and 1.364.
Price chart of USDCAD in real time mode
The content of this article reflects the author’s opinion and does not necessarily reflect the official position of LiteFinance. The material published on this page is provided for informational purposes only and should not be considered as the provision of investment advice for the purposes of Directive 2004/39/EC.
{{value}} ( {{count}} {{title}} )
This post is originally published on LITEFINANCE.


