
The most profitable trading strategies in the Forex market often employ candlestick patterns. The Kicker candlestick pattern stands out as one of the most reliable and effective.
This simple yet powerful pattern is classified as a trend reversal formation. The Kicker candlestick pattern can significantly enhance trading outcomes, with some traders reporting earnings of up to 8–10% of their initial deposit per one such pattern. This article provides essential knowledge you need to trade Kicker patterns effectively.
The article covers the following subjects:
Major Takeaways
|
What is the Kicker pattern |
On the chart, a Kicker pattern represents a two-bar candlestick formation that appears after a sustained uptrend or downtrend, indicating a shift in market sentiment and signaling a looming trend reversal. |
|
What are the differences between bullish and bearish Kicker patterns? |
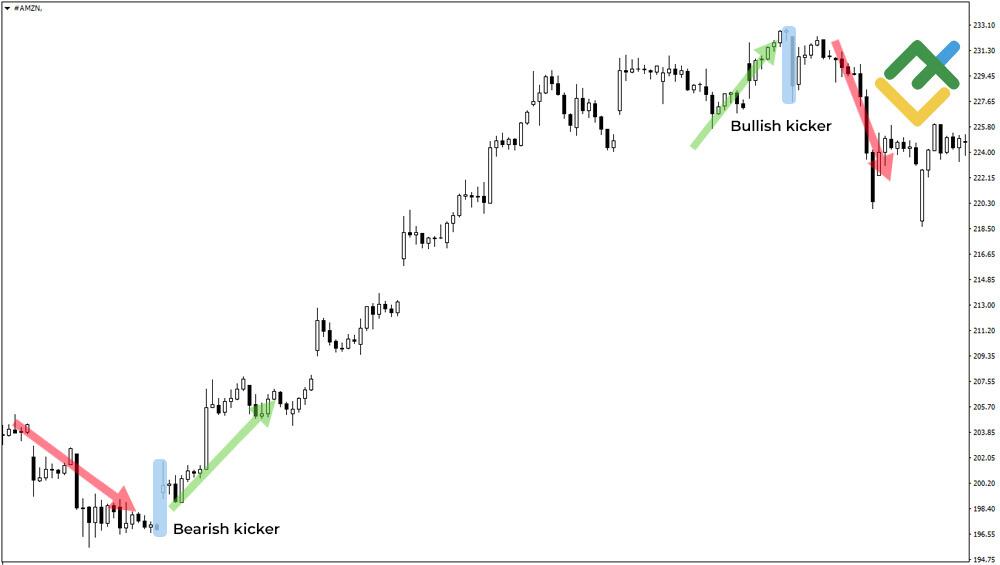
The bearish Kicker pattern appears after an uptrend at market highs, while the bullish Kicker candlestick pattern emerges at market lows after a bearish trend. |
|
How does the pattern affect the financial market? |
The Kicker pattern is a trend reversal pattern that forms at the end of a trend, signaling an impending market reversal and a change in trading volume. |
|
How does the pattern work? |
You place a buy or sell order at the closing price of the pattern’s second candlestick. Once your order is triggered, set a trailing stop to safeguard your trade. |
|
How to find the Kicker pattern on the chart? |
An example of a Kicker candlestick pattern on a chart is two candles, where the first is a continuation of the existing trend, and the second is opposite to it, often opening with a gap. |
|
The Kicker pattern’s features |
The Kicker candlestick pattern is relatively straightforward to identify on a price chart. However, it rarely appears, which makes it less suitable for intraday trading. As a rule, it is frequently used in the commodity and stock markets, where low liquidity can generate gaps on the chart. |
|
Pros of the Kicker pattern |
Among its key advantages are its straightforward structure, its compatibility with any time frame, and its reliable performance as a reversal signal. |
|
Cons of the Kicker pattern |
Regarding disadvantages, the pattern rarely appears on the chart, can be confused with other candlestick patterns, lacks clear profit-taking levels, and requires opening trades at the market price. |
|
Applicable time frames |
The pattern can be applied to any time frame, but as with most candlestick patterns, it is more likely to occur on higher time frames. |
|
Stop-loss order management |
Stop-loss orders can be set only after the second candlestick closes. Most often, this can be done after a buy or sell order is already placed. |
What Is a Kicker Candlestick Pattern?
The Kicker is a reversal candlestick pattern that is widely regarded as one of the most reliable signals of a trend reversal, accompanied by a sharp change in trading volume.
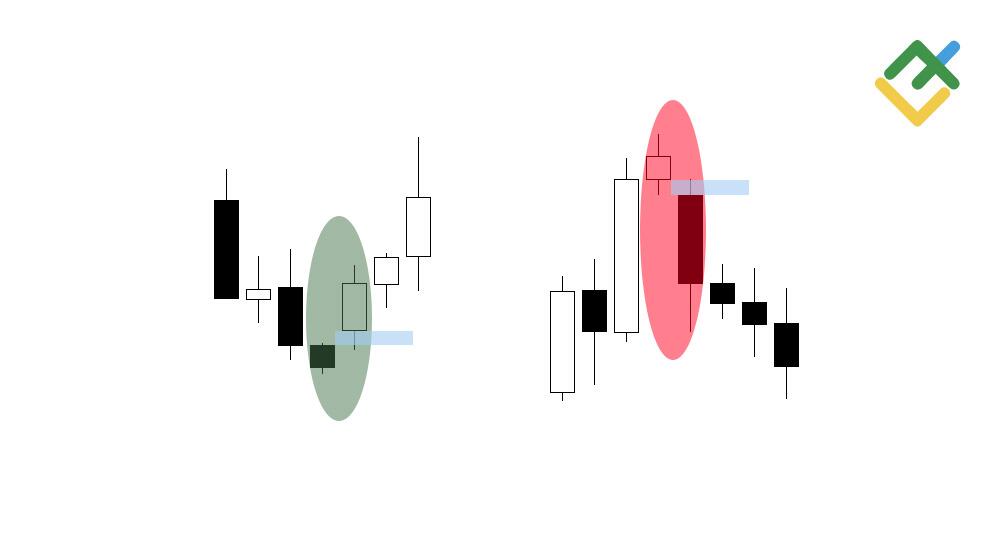
When using the bullish Kicker pattern and the bearish Kicker candlestick pattern, one can notice that they consist of two consecutive candlesticks that differ in color and, as a rule, open with a small price gap. However, there are also Kickers where the second candlestick opens at the opening level of the first candle, thereby reversing the trend.
The Kicker is also one of the few candlestick formations that takes into account the strength of the trend reversal signal. The longer the body of the second reversal candlestick, the stronger the signal the pattern generates. On the contrary, the shorter the body, the weaker the signal.
The strongest reversal signal can be observed when the second candlestick opens with a price gap, much lower or higher than the opening price of the first candlestick. Since bullish and bearish Kicker patterns point to a reversal, they can offer both sell and buy signals. A buy signal occurs when the first candlestick is black and the second one is white. A sell signal occurs when the first candlestick is white and the second one is black.
Kicker Candlestick Pattern Formation
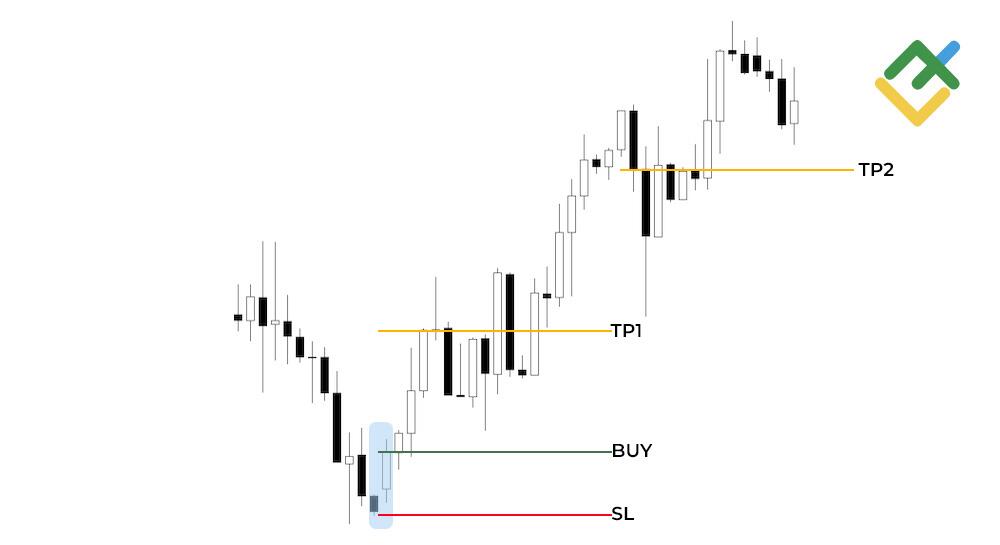
The chart below shows oil quotes. As you can see, a Kicker pattern appeared at the lowest point. In this case, this bullish Kicker signal indicates an imminent upward reversal.
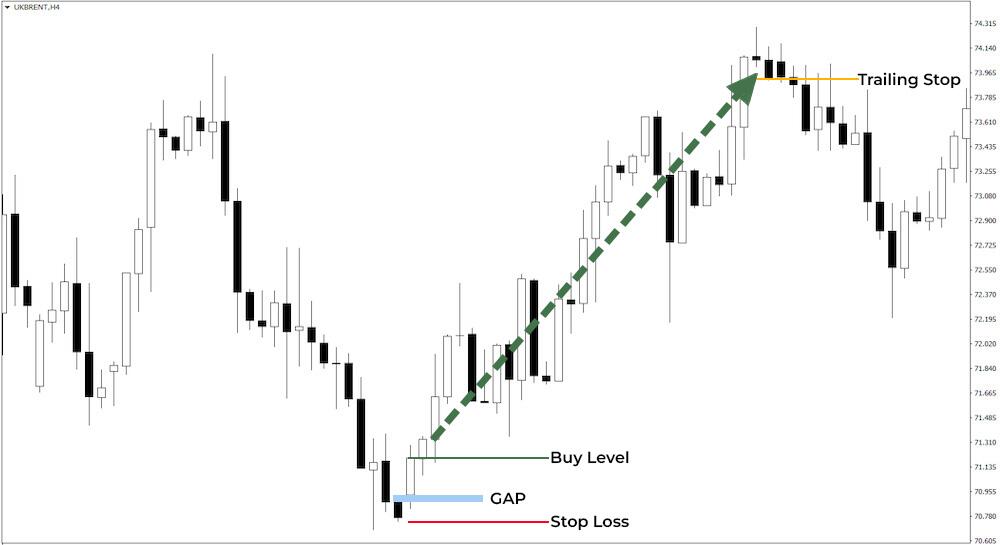
The signal was strong and reliable because an additional condition was met: a price gap emerged between the first black candlestick and the second white one.
This bullish Kicker indicates that the selling volume was completely absorbed, and buyers started to dominate the market. The significant price difference indicates a substantial advantage for buyers, which could lead to the development of a new, protracted bullish trend.
In this scenario, one can open a long trade at the closing price of the pattern’s second candlestick. The trade can be accompanied by a trailing stop to ensure maximum potential profit. There are also other methods for locking in profits, ranging from the most basic trend lines to signals generated by technical indicators.
What Does the Pattern Tell Traders?
Understanding the Kicker pattern helps traders make more confident and informed decisions when interpreting reversal signals. Its essence lies in demonstrating the struggle between sellers and buyers near support and resistance levels. At first, a stable trend prevails in the market, but at some point, the opposing force injects a large volume of trades and reverses the trend. Since reversals occur both at the top and bottom of the trend, the Kicker can be either bullish or bearish.
Bullish Kicker Pattern
The bullish Kicker pattern forms when the price hits the bottom of the downtrend. The chart pattern implies that bears are still pushing the price down, maintaining sales volume, and forming a swing low. However, after the price touches this low, a large portion of short positions are closed, causing the price to rebound from the support level and form a gap.
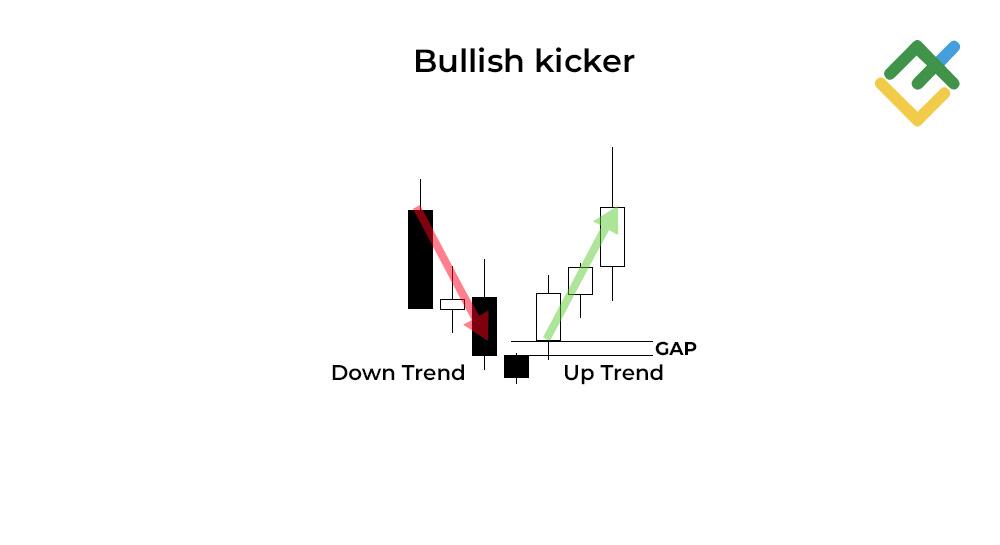
The following candlestick signals a bullish reversal. Bears are no longer able to sustain downward pressure, selling volume is insufficient to drive prices lower, and bulls swiftly push prices upward, forming a white candlestick that typically has a long body and a short upper shadow. The result of this formation is a complete absorption of the entire selling volume and an upward trend reversal with a shift from bearish to bullish sentiment.
Bearish Kicker Pattern
The bearish reversal pattern Kicker occurs when the price approaches the top of the uptrend amid an overbought market condition. A bearish Kicker candlestick pattern at the uptrend’s peak suggests that bulls are still trying to push the price higher, maintaining the volume of purchases and forming a swing high. However, once the price hits this high, most of the long positions are closed, and the price rebounds from the resistance level, forming a down gap.
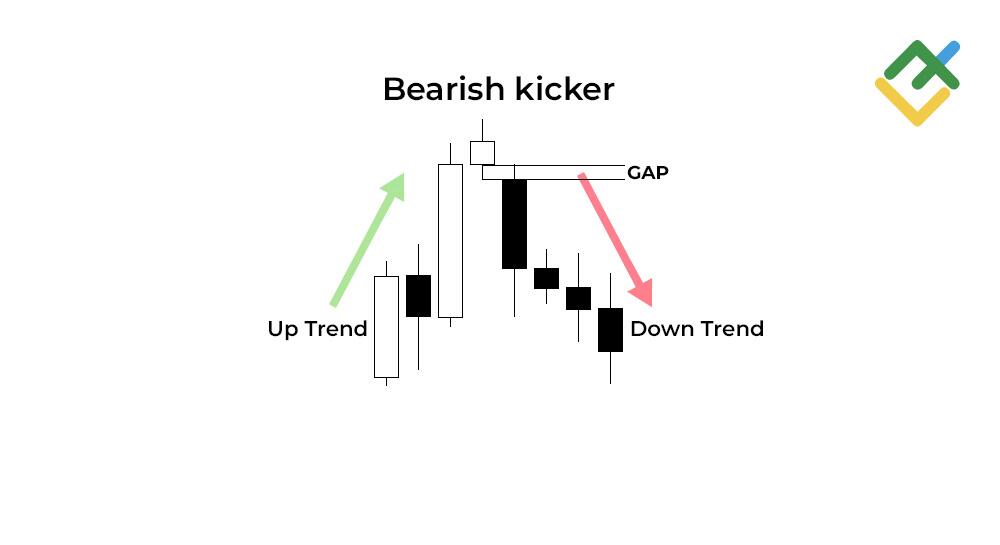
The subsequent candlestick is crucial as it gives a bearish reversal signal. In this scenario, bulls are no longer able to push the price higher, buying volume is insufficient to continue growth, and bears sharply drag the price down, forming a black candlestick often characterized by a long body and a short lower shadow. The formation has resulted in the complete absorption of the entire purchase volume. As a result, a bearish reversal occurs, which is confirmed by new black candlesticks.
Bullish Kicker Pattern vs. Bearish Kicker Pattern
Bullish and bearish Kicker patterns are essentially the same pattern, only appearing in different trends. Despite this, there are some details that can be used to distinguish these candlestick patterns from each other:
-
It is better to trade the bullish Kicker pattern at the lows of the downtrend and the bearish Kicker pattern at the peaks of the uptrend.
-
The bullish Kicker is often accompanied by oversold conditions, while the bearish Kicker can often be found in overbought markets.
-
The first candlestick of a bullish Kicker is always black, while the bearish Kicker’s first candlestick is always white.
-
The second candle of a bullish Kicker pattern is also white, while the bearish Kicker pattern’s second candlestick is black.
-
The second candlestick of the bullish pattern always closes above the opening price of the first bearish candlestick. In the case of a bearish Kicker, the second bearish candle always closes below the opening price of the first candlestick.
How to Identify a Kicker Candlestick Pattern
While this pattern is not frequently observed on price charts, it is relatively easy to identify.
-
The chart shows a clear downward or upward trend before the pattern begins to shape.
-
The pattern’s first candlestick almost always marks a low or high point in the existing trend.
-
The pattern’s second candlestick always has a different color.
-
The opening price of the second candlestick is always higher or lower than the closing price of the first candlestick.
-
There is often a price gap between the first and second candlesticks.
-
The body of the second candlestick is almost always larger than that of the first candlestick.
-
The first candlestick often has short shadows.
How to Trade Kicker Pattern
Unlike other reversal patterns, the Kicker has fairly simple rules for opening trades.
-
The pattern appears at trend extremes, so if the price is close to them, you should keep an eye on each new candlestick.
-
When you see a bullish candlestick opening at or above/below the opening price of the previous one, wait for it to close.
-
If the second candlestick changes color and is about to close, repeat step 2.
-
If conditions 2 and 3 are met and the candlestick closes, it is most likely a Kicker pattern.
-
If there is a price gap between the opening prices of the two candlesticks, it is a powerful Kicker pattern.
-
In this case, open a position in the direction of the second candlestick immediately at the opening price of the third candlestick. If the second candlestick is white, open a long position, and if it is black, open a short position.
-
Set a stop-loss order at or slightly below/above the low/high of the pattern’s first candlestick.
-
A take-profit level can be floating, and the order is usually not set immediately. Instead, traders use a trailing stop.
-
A trailing stop should be placed at the break-even point where the trade was opened.
Pros and Cons of Using Kicker Pattern
The Kicker candlestick pattern is a fairly reliable formation that predicts a trend reversal. However, as is the case with most patterns, it has several drawbacks that require traders to exercise caution when trading.
|
Advantages |
Disadvantages |
|
The pattern’s signals are highly reliable, suggesting an 81% chance of a trend reversal. |
The pattern rarely forms with a gap, and sometimes you have to wait over a month for it to appear on higher time frames. |
|
The pattern can appear on any time frame, but to increase the reliability of the signal, it is not recommended to trade on time frames lower than one hour. |
On modern candlestick charts, there are many interpretations of this pattern, some of which are extremely unreliable. |
|
When trading the Kicker pattern, a position is most often opened at the market price. A trader can then set a trailing stop, moving their stop-loss order to a break-even level. This strategy can help maximize profits while keeping the trade open until the prevailing trend reverses. |
Since it is necessary to enter the market immediately after the second candlestick closes, it is practically impossible to use pending orders. Therefore, it is almost impossible to automate trading based on this pattern. |
|
The pattern consists of only two candlesticks, so it takes little time to complete. |
|
|
The pattern is formed very quickly. A profitable trade can be opened at the first candlestick after the pattern is complete. |
|
|
The pattern does not require confirmation with technical indicators. |
Trading Strategy for the Kicker Pattern
One of the most common trading strategies for the Kicker pattern is to combine it with the Relative Strength Index.
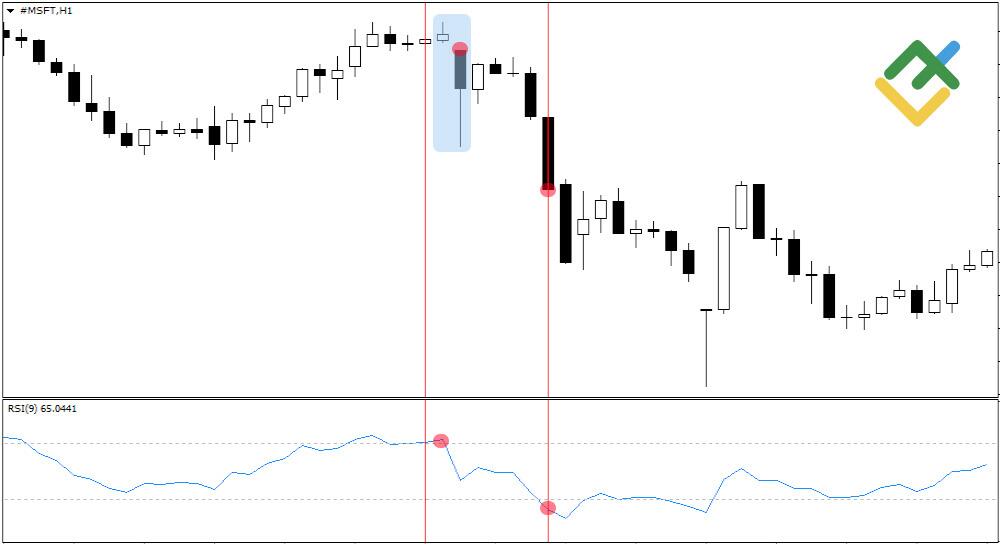
Before you start trading, add the RSI to the price chart and set it to the selected chart time frame. In this case, the pattern is formed on the hourly time frame, so the best choice for the indicator period would be 7, 9, and 13.
If the RSI shows an overbought or oversold condition, the signal is confirmed. In this case, the last high of the uptrend coincides with the RSI being in the overbought zone.
Once the second signal candlestick closes, the moving average of the RSI exits the overbought zone, confirming a bearish reversal and providing a sell signal. You can open a short position at this point.
A stop-loss order is set at the high of the first Kicker candle. When the RSI’s exponential moving average slides into the oversold zone, you need to wait for the forming candlestick to close and lock in profits.
Conclusion
Trading candlestick patterns is an effective strategy for traders who are just starting out or have limited capital. When selecting candlestick patterns for trading, it is essential to thoroughly assess all potential risks to prevent potential losses. If you opt for position trading, the Kicker pattern is an excellent alternative to most other trading methods.
However, an effective trading strategy is only successful when you conduct comprehensive market analysis and adhere to established and effective risk and money management rules. If you have any remaining questions, our candlestick patterns cheat sheet is designed to help you develop a profitable trading strategy.
Kicker Candlestick Pattern FAQs
The Kicker pattern gives a very strong trend reversal signal, often confirmed by technical indicators. This is due to the tracking of changes in trading volume indicated by the pattern.
The Kicker pattern can give both bullish and bearish signals, depending on the existing primary trend. If the Kicker candle is in a bear market, the pattern will be considered bullish; conversely, if the candle is in a bullish market, the pattern will be considered bearish.
The Kicker pattern forms very quickly, developing in just two stages. If a trader spots the pattern on an hourly chart, it will take just two hours to form. On a daily chart, it will take two days to complete.
The Kicker pattern is a reversal candlestick pattern that signals a trend reversal on the chart. If a bullish impulse precedes the pattern, the Kicker will signal a downward reversal; conversely, if there is a decline, it will indicate an upward reversal.
The Kicker pattern, like any other technical analysis pattern, may fail. However, the pattern’s success rate exceeds 80%, making it one of the best candlestick patterns.

The content of this article reflects the author’s opinion and does not necessarily reflect the official position of LiteFinance broker. The material published on this page is provided for informational purposes only and should not be considered as the provision of investment advice for the purposes of Directive 2014/65/EU.
According to copyright law, this article is considered intellectual property, which includes a prohibition on copying and distributing it without consent.
{{value}} ( {{count}} {{title}} )
This post is originally published on LITEFINANCE.