The White House convinced S&P 500 traders that tariffs would not be imposed, or consumers would absorb the cost increases. As a result, the stock market began to ignore bearish factors. Will the labor market force market participants to reassess the risks? Let’s discuss this topic and develop a trading plan.
The article covers the following subjects:
Major Takeaways
- The S&P 500 rally was facilitated by the “Trump put.”
- News about trade negotiations overshadows negative factors.
- A recession will resolve the uncertainty.
- If the S&P 500 fails to settle above 5,600, short trades can be opened.
Weekly Fundamental Forecast for S&P 500
If market participants decide to follow the long-standing principle and rush to sell their assets in May, US stock bulls may suffer. US stock indices have experienced an eight-day rally, the longest since August. However, seasonal factors may exert pressure on bulls. Since 1993, investments in S&P 500-tracking funds have returned 171% during the May-to-October period, compared to 731% from November to April. And that’s not the only reason for caution.
In early April, the broad stock index fell into bear territory due to the US sweeping tariffs, concerns about a potential recession, and disillusionment with Donald Trump’s ability to boost the market. These factors contributed to capital flow from the US to Europe, fueled by a decline in American exceptionalism and a sell-off of G7 securities.
Price to Earnings Ratio and Price to Sales Ratio
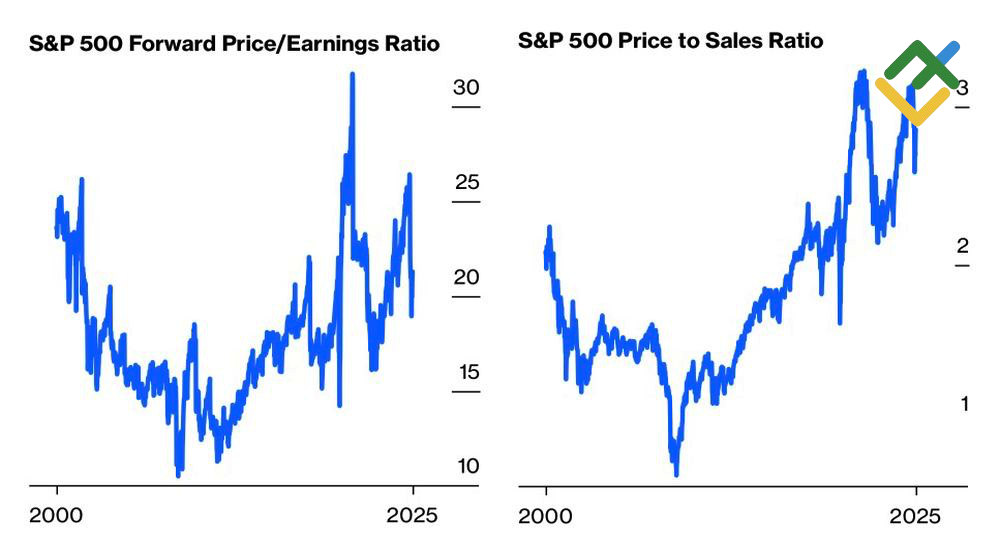
Source: Bloomberg.
In early May, the S&P 500 index approached the levels from which it began to fall on US Independence Day, triggering renewed investor optimism regarding Donald Trump’s interest in the stock market. Positive comments from Trump and US administration officials about trade negotiations sparked a rally in the broad index. Investors were hopeful that tariffs would either be avoided or passed on to consumers, as reflected in the price-to-earnings and price-to-sales ratios.
Neither assumption has materialized. In many countries, tariffs are lower than in the US, and they have little to offer in negotiations. Canada feels it has time, while China is committed to fighting till the end, and Japan hints at its advantage with substantial US Treasury reserves. The S&P 500 will likely lose patience with the US administration’s conciliatory approach and will turn its attention to other factors. Unfortunately, these factors do not favor the bulls.
S&P 500 After US Presidential Inaugurations
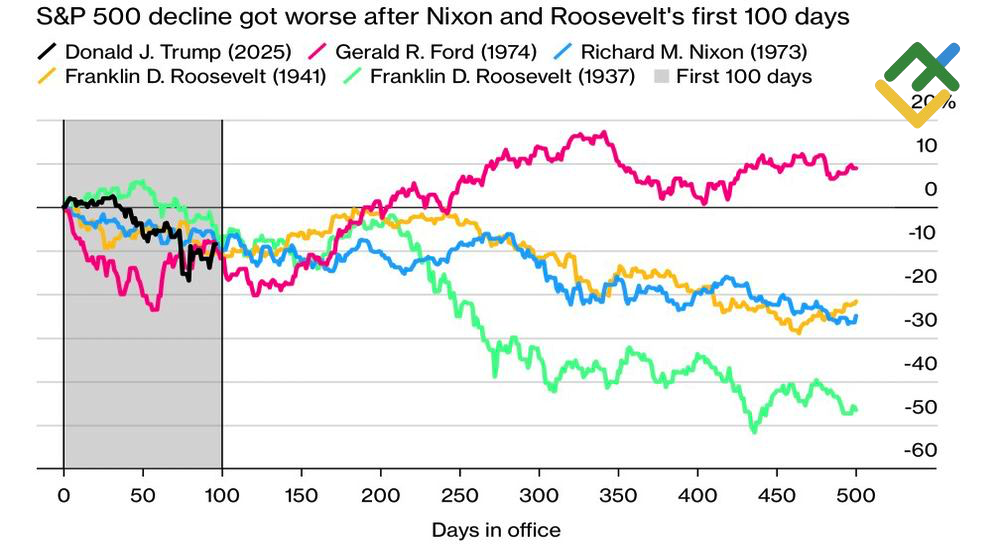
Source: Bloomberg.
The first 100 days of Donald Trump’s presidency marked one of the most challenging periods in the history of the broad stock index, with the S&P 500 dropping around 8%. Historically, in similar situations with other presidents, the index typically failed to regain its losses by the end of the year. Nevertheless, Gerald Ford’s presidency was a notable exception to this trend.
Weekly Trading Plan for S&P 500
Recent statistics indicate that tariffs are cooling the US economy, impacting GDP, the labor market, PMIs, and consumer confidence. Disappointing April employment data may force the S&P 500 to acknowledge the severity of the situation. Donald Trump’s measures may fall short, and the Fed is unlikely to help due to rising inflation concerns linked to tariffs. Therefore, if the index fails to consolidate above 5,600 or reach 5,700, short trades can be opened.
This forecast is based on the analysis of fundamental factors, including official statements from financial institutions and regulators, various geopolitical and economic developments, and statistical data. Historical market data are also considered.
Price chart of SPX in real time mode

The content of this article reflects the author’s opinion and does not necessarily reflect the official position of LiteFinance broker. The material published on this page is provided for informational purposes only and should not be considered as the provision of investment advice for the purposes of Directive 2014/65/EU.
According to copyright law, this article is considered intellectual property, which includes a prohibition on copying and distributing it without consent.
{{value}} ( {{count}} {{title}} )
This post is originally published on LITEFINANCE.


