When conducting technical analysis, traders typically assess price actions regularly formed on the chart. Analyzing patterns and price formations is the most common indicator used in technical analysis, counting about 50 chart patterns, including rare ones and those that can be found almost on every time frame.
A “Triple bottom” and “Triple top” are among the popular patterns in trading. Although these patterns are actually the same, a “Triple bottom” is more widespread on price charts due to the prevalence of market downtrends, at the end of which this pattern appears.
The article covers the following subjects:
Key Takeaways
|
What is a “Triple bottom” pattern |
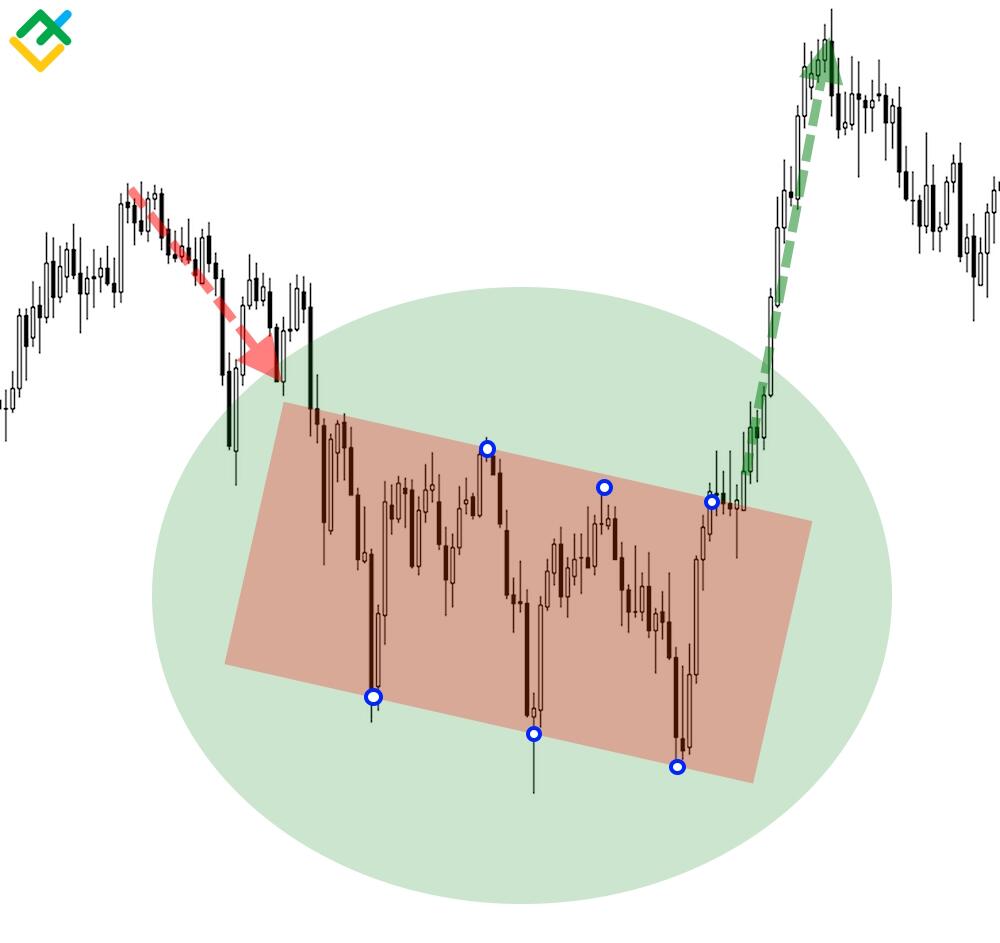
A “Triple bottom” is a graphical pattern that appears on a price chart after a prolonged downtrend. |
|
What is the difference between a “Triple bottom” and a “Triple top“ |
A “Triple bottom” pattern occurs at the market lows following a downtrend, while a “Triple top” pattern emerges at the highs after an uptrend. |
|
How the pattern affects the market |
A “Triple bottom” is classified as a trend reversal pattern used in technical analysis, forming at the end of a trend, signaling an imminent change in market direction. |
|
How the pattern works |
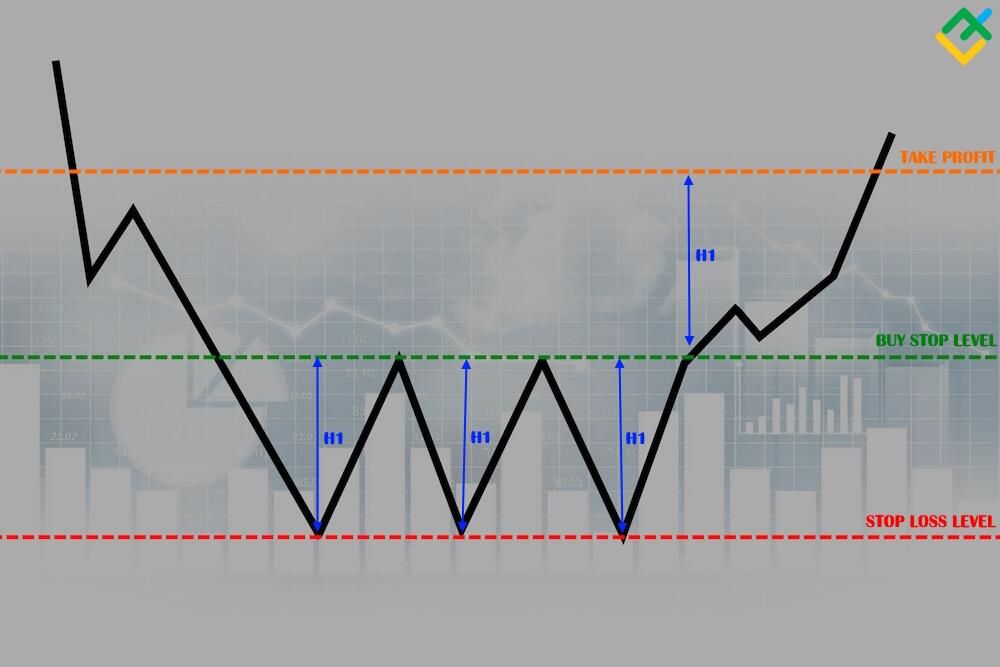
A trader sets a pending buy limit order just above the two previous highs within the pattern. Once the order is triggered, a trade is executed. |
|
How to spot the pattern on the chart |
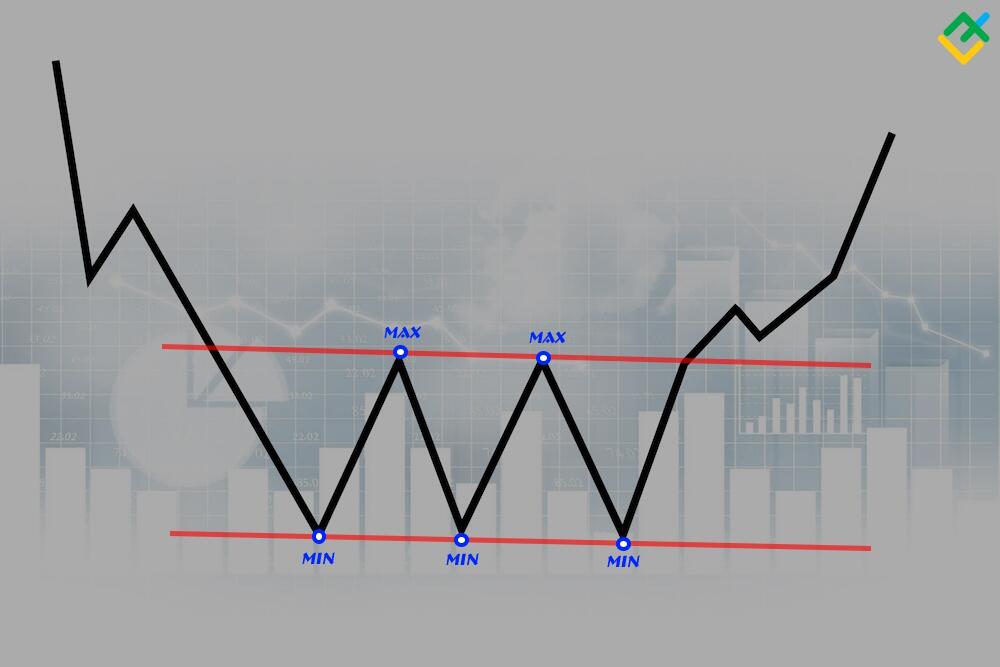
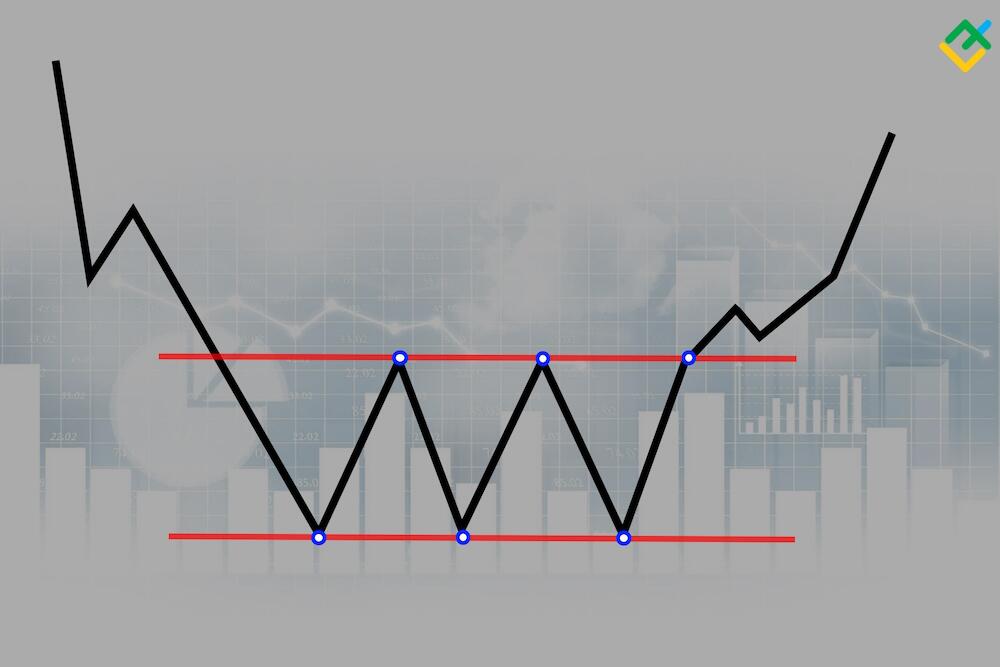
The pattern consists of three consecutive lows or bottoms formed after a downtrend, resembling a channel. All three lows should be approximately the same value in pips. |
|
Pattern features |
A “Triple bottom” is frequently mistaken for a “Head and shoulders” pattern. Despite the possible confusion, they share similar principles and function almost identically as potential trend reversal formations. |
|
Pros of a “Triple bottom” pattern |
The advantages include a simple structure, frequent occurrence on any time frame, and easily identifiable stop order levels. |
|
Cons of a “Triple bottom” pattern |
The pattern may sometimes not form completely, giving a false signal. Besides, it can often evolve into a short-term channel. Another drawback is the necessity to place a stop-loss order at a considerable distance. |
|
What time frame to choose |
The pattern works on any time frame. However, as with all patterns, its effectiveness increases on higher time frames. |
|
The stop-order levels |
The stop-order levels are set at any time and mainly near the pattern’s lows and highs. |
What Is a Triple Bottom?
A “Triple bottom” chart pattern is a technical analysis pattern that occurs at the lows of a downtrend and indicates a trend change, showing the balance of power shifting from sellers to buyers.
A “Triple bottom” is one of the basic patterns that may appear on the charts of any asset and on any time frame. However, similar to most price patterns, it tends to be most effective when observed on the 4-hour and higher time frames.
This chart pattern represents three successive price lows, emerging at the same level after a long downtrend and forming a short-term channel with a strong support line. The channel may have a descending, ascending, or sideways direction. The key condition for identifying this pattern on the chart is the same pip value of each of its three bottoms.
How Does a Triple Bottom Pattern Form?
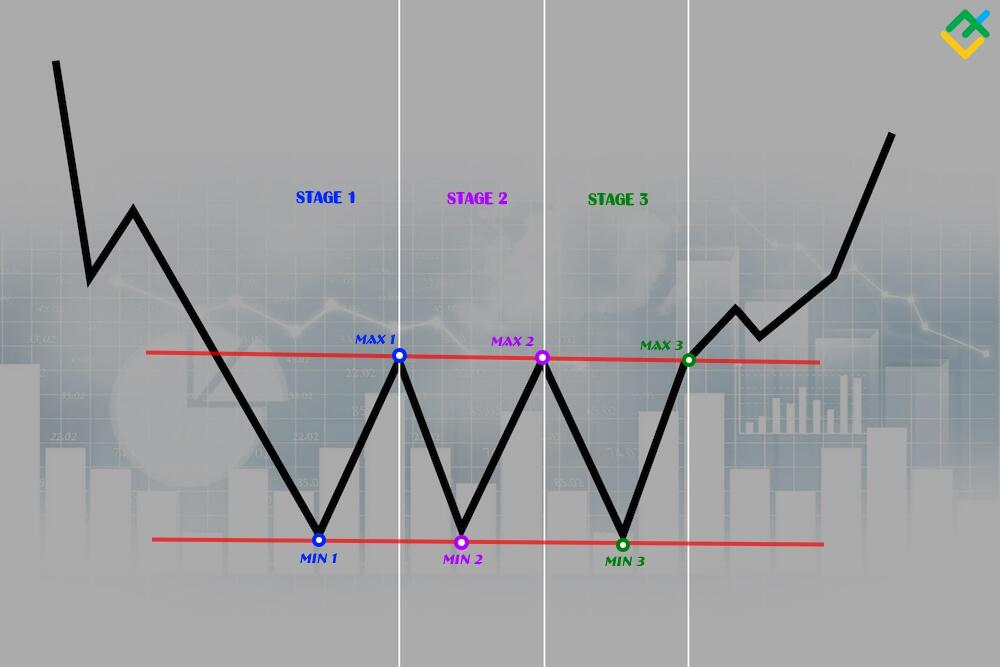
The “Triple bottom” pattern formation involves three main stages:
-
Firstly, the price chart shows a prolonged downtrend where bears are in control of the price action. During this bearish sentiment, the price action starts to generate a pullback at the lows. The pattern begins to take shape after forming its first bottom or low. Once the low is established, the correction rises, covering more than 10% of the previous downtrend.
-
Secondly, the pattern forms its first high, which is the end of the upward correction. Once the first low and high are in place, the pattern develops the first wave. Subsequently, the price declines to the level of the first low and attempts to drop even further. If the price fails to reach below this low and the price reverses, the second bottom will be formed, confirming a “Double bottom” pattern. At the first high, the price should reverse again, establishing the second high. If all these scenarios are fulfilled, the pattern enters the third phase.
-
After completing the second high, the price decreases, suggesting the formation of a “Triple bottom” pattern. During the third stage, the price forms a third low in parallel with the previous ones. Subsequently, there is an upward reversal in quotes. The price surge, formed after the third bottom, is a breakout wave, which typically marks the beginning of the pattern’s growth.
The pattern may signal a bullish reversal once the price reaches the first and second highs.
How to Identify the Triple Bottom Pattern
In order to correctly identify the pattern on the price chart, it is necessary to wait until the first two stages of its formation have fully developed. Only after the first and second lows and highs have been established can a “Triple bottom” pattern be confirmed. However, the pattern may not work even if the formation of all three lows is complete. The pattern may transform into a regular channel of any direction.
Many patterns are similar to a “Triple bottom” in appearance and principle of work. A prominent example is when a “Double bottom” transforms into a “Triple bottom.” Another similar pattern is the “Inverse head and shoulders” chart pattern, which is distinguished by having a central bottom lower than the other two. The following signs will help you distinguish a “Triple bottom” from other patterns on the chart:
-
All three lows should be approximately the same.
-
The levels of the three highs and lows should be parallel.
-
The pattern is always formed after a strong downtrend and cannot occur after a sideways movement.
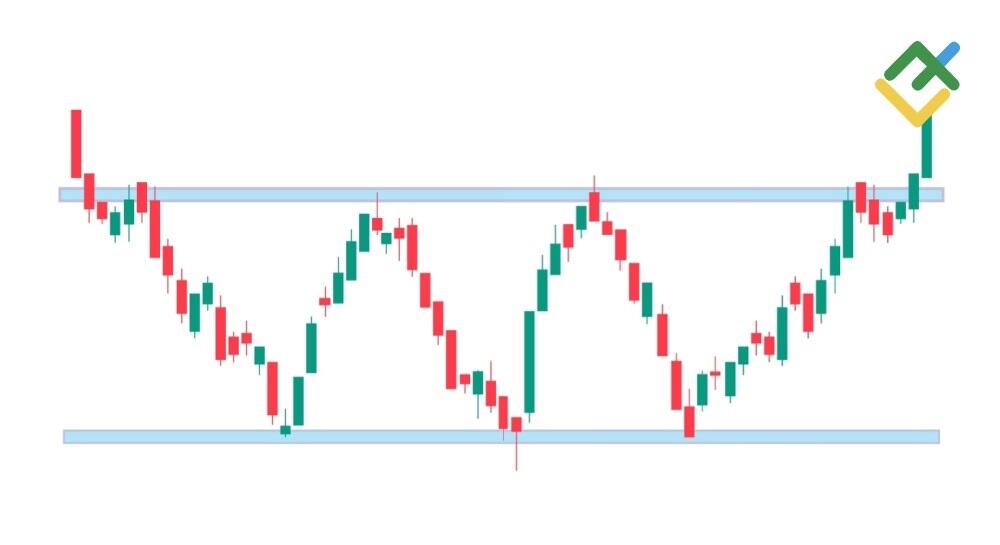
Triple Bottom Example
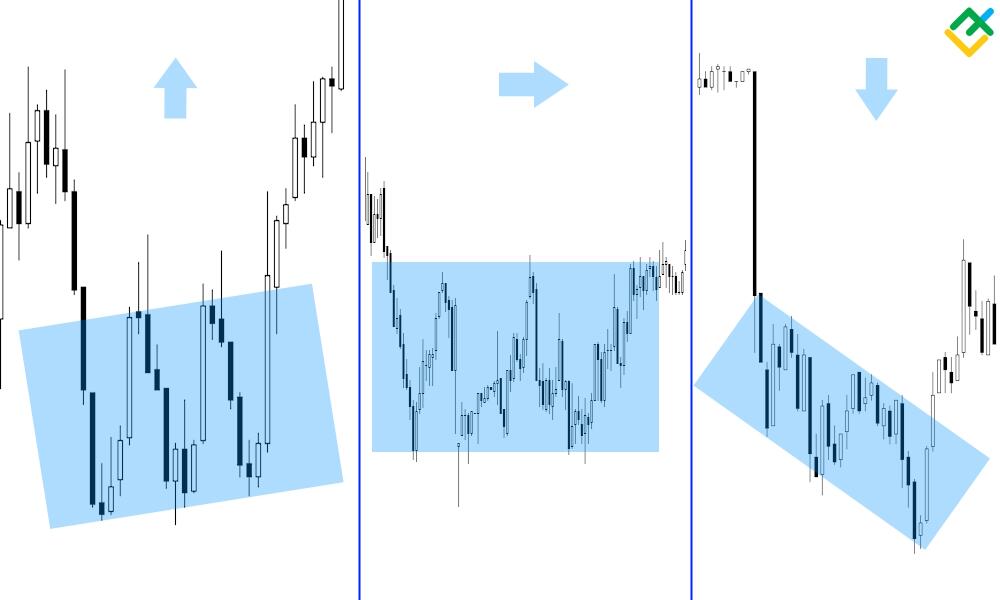
The picture below shows three variations of the pattern on the price chart.
-
The pattern forms an ascending channel, which was confirmed once the price broke through the resistance line. This type of “Triple bottom” pattern is the weakest, as its probability of reversing the trend does not exceed 60%. This happens because of premature market entry, leading to the pattern’s incompletion and false signals.
-
The pattern represents a simple sideways channel and is the most widespread on the chart. This “Triple bottom” is a classic version of the pattern. The probability of the pattern being effective is about 65%, slightly higher than in the previous type.
-
The pattern is a descending channel, indicating a slowdown phase of the global trend. This variation of the pattern is the most favorable for traders, as it allows them to enter a trade at a later stage after all the reversal signals have already been confirmed. The probability of this pattern to give a reliable reversal signal surpasses 74%.
How to Trade Using the Triple Bottom Pattern
In order to correctly use a “Triple bottom” pattern in trading, you need to follow a number of simple rules, which will also help automate trading with this pattern.
-
It is necessary to identify the pattern correctly, eliminating all similar formations.
-
If a potential pattern is formed after a downtrend, there is already a 50% chance of its completion.
-
Wait until all three lows are formed and get ready to place a pending buy order.
-
Once the price has increased by half of the previous low, place a pending buy stop order.
-
The level of a buy stop order is located just above the second high. There are cases when a long trade is opened after the price has tested the resistance level. However, it is not recommended to do so, as you can miss more than half of the transaction or not enter it at all.
-
The take-profit level is determined by adding a buy stop and H1, where H1 represents any low of the pattern in pips.
-
A stop-loss order is set at the third low level.
-
Once the price has exceeded 50% of the trade’s upside potential, you can shift the stop loss to the breakeven point.
The Difference Between a Triple Bottom and a Triple Top
A “Triple bottom” pattern is a bullish reversal pattern that appears at market lows. The pattern is characterized by three equal lows followed by a breakout above the resistance level, signaling a market change from a downtrend to an uptrend.
A “Triple top” pattern is a bearish reversal pattern that occurs at market highs, forming a solid resistance level. This pattern foreshadows a complete change from upward to downward price movement.
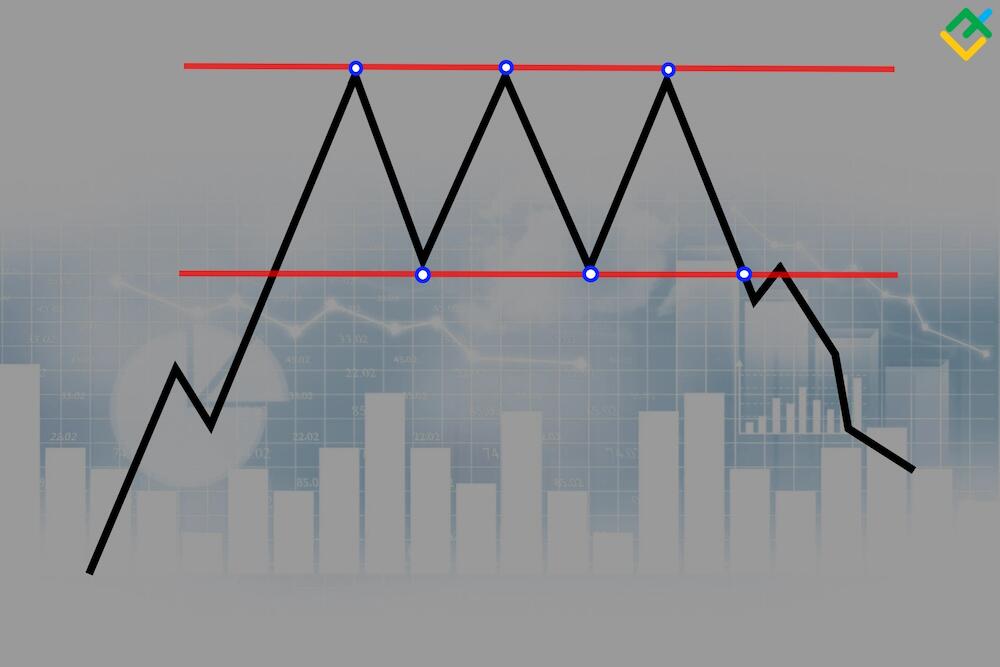
Basically, both patterns are exactly the same, with the only distinction being their placement. There are only two variations of the pattern, neither of which can follow a sideways trend. In the instance of a “Triple bottom,” you should open a long trade, while in the case of a “Triple top,” you should initiate a short trade.
The Triple Bottom – Pros and Cons
Although this pattern frequently appears on price charts, the probability of its full completion is quite low. Nonetheless, its simplicity contributed to its widespread popularity, making it one of the most favored patterns.
|
Pros |
Cons |
|
The pattern is completely universal. It may appear on any time frame and on the charts of any assets, from currency pairs to commodities. |
The likelihood that the pattern will be fully completed is quite low. The chance that the price will move in the predicted direction barely exceeds 60%. This probability is much lower compared to other technical analysis patterns. |
|
It is very easy to use. The pattern requires only three types of orders, so that even a beginner can determine exact levels where these orders should be placed. |
It can be easily confused with other patterns. The identification process is quite complicated, and if you confuse the pattern, for example, with a “Head and shoulders” pattern, your order levels may be placed too close to the entry point. |
|
The pattern allows you to adjust your trades. The signal to enter the market comes later and becomes relevant when almost all signs point to market reversal, which increases the chances of a winning trade. |
The profit potential is low compared to the potential loss. The stop-loss and take-profit levels are the same, which does not always align with risk management parameters that typically aim for a 3:1 profit ratio. |
Conclusion
To summarize, trading using patterns is one of the most popular types of trading for those with moderate capital. Patterns are easy to spot and have simple and clear entry and exit levels.
A “Triple bottom” chart pattern is one of the most accessible, and once you master it, you can develop a powerful trading strategy. To make trading in the financial market even more profitable, use the following suggestions:
-
Use only patterns that appear on time frames from H1 and above. The highest probability of triggering a reversal pattern occurs on the H4 time frame.
-
Do not wait for a take profit to be fully executed. If the price has moved more than 80% of the desirable direction, you can lock in the profit.
Triple Bottom Pattern FAQ
The appearance of a “Triple bottom” pattern on the chart means that the downtrend, which has been dominating the market, is ready to change from a bearish to a bullish one. The market is oversaturated with sales, and bears begin to gradually exit their trades.
In order to properly identify a “Triple bottom” pattern, you should wait for the complete formation of three equal lows, which should be located at the same level. Once the price exceeds the previous high, the pattern can be confirmed.
Once a “Triple bottom” pattern fully unfolds, the downtrend will reverse, and buyers will take control of the market from the sellers.
A “Triple bottom” is a bullish reversal chart pattern that occurs due to strong bullish trading volume. Thus, a “Triple bottom” indicates an opportunity to enter a bullish position.
The “Triple bottom” pattern is a continuation of the “Double bottom” pattern. It is considered more reliable because the support level formed by the pattern has been tested three times instead of two.
The probability of the “Triple bottom” pattern fully forming and generating profits is between 60% and 70%, depending on the variation of the pattern itself. The most effective is the descending channel scenario.
The content of this article reflects the author’s opinion and does not necessarily reflect the official position of LiteFinance. The material published on this page is provided for informational purposes only and should not be considered as the provision of investment advice for the purposes of Directive 2004/39/EC.
{{value}} ( {{count}} {{title}} )
This post is originally published on LITEFINANCE.