
Every investor strives to find reliable tools for predicting trends in financial markets. One such tool is the Dark Cloud Cover candlestick pattern. This pattern provides traders with signals of a possible trend reversal to the downside.
For successful use of this pattern, it is essential to identify it correctly, and it is also important to consider the current market situation. In this article, we will look at the features of the Dark Cloud Cover and learn how to trade it and maximize trading benefits.
The article covers the following subjects:
Key Takeaways
- Dark Cloud Cover is a classical technical analysis candlestick pattern. It points out a bearish trend reversal after continued growth.
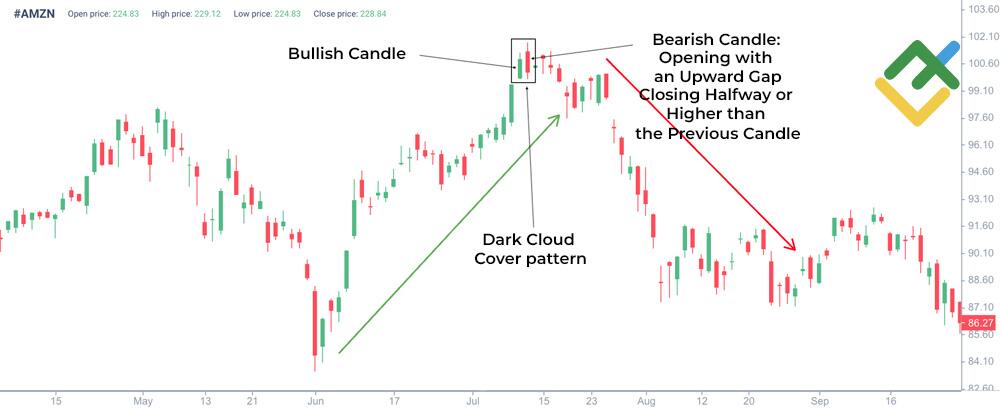
- This pattern occurs at the end of an uptrend. A large white candle (bullish) is followed by a bearish candle, which opens above the previous high and closes at or near the midpoint of the previous candle. The second candle must partially overlap the first one, indicating strong selling pressure.
- The degree of overlap of the bullish candle by the bearish one is important here: the closer the second candle’s closing price is to the opening price of the first candle, the stronger the reversal signal.
- Trading based on this pattern involves opening short positions. Conservative traders may wait for confirming signals, such as an additional breakdown of the support level or indicator readings. It is recommended to combine this pattern with other analytical tools.
- An effective trading strategy would be to use the Dark Cloud Cover alongside oscillators like RSI or MACD. An additional signal is when an asset’s price drops on increased trading volumes.
- One of the advantages of the pattern is its simplicity in identification. The drawbacks include the possibility of false signals, which need to be filtered additionally. High volatility can also reduce the pattern’s reliability.
- This formation can be observed on all timeframes but is the most effective on daily candlestick charts. This pattern also frequently emerges in the stock market.
- To effectively manage risks when trading this pattern, it is advisable to place a stop-loss slightly above the high of the bearish candle. Traders can also adjust the stop-loss according to volatility, ensuring they observe risk management rules for each trade.
What Is The Dark Cloud Cover?
The Dark Cloud Cover is a two-candle bearish reversal pattern, signaling a potential downward reversal at the end of an uptrend.
This pattern is made of two candles: the first is a large white or green candle, indicating upward movement, while the second is a black or red candle that opens above the previous candle’s close and closes below its midpoint. The Dark Cloud Cover is a candlestick pattern that appears at market peaks, indicating significant selling pressure.
Traders must choose the appropriate timeframe for trading this pattern. It is commonly applied on daily and weekly candlestick charts to minimize false signals.
However, experienced traders may use it on lower timeframes if they correctly align the signals with other indicators and market conditions.
The pattern is suitable for trading various instruments, including stock market assets, forex pairs, futures, and commodities. Each instrument has its nuances, so understanding the market context and using additional confirming signals can improve forecast accuracy.

What Are the Components of Dark Cloud Cover?
The Dark Cloud Cover pattern consists of two candlesticks. After a prolonged uptrend, the first candle of the pattern forms. This candle reflects buyer dominance and closes at high levels.
However, the second bearish candle signals the emergence of sellers. It opens above the previous bullish candle’s close, but then the price drops sharply and covers at least half of the first candle’s body. This indicates that sellers are taking control, making a downtrend likely.
How To Identify The Dark Cloud Cover Pattern
To correctly identify the pattern on a candlestick chart, consider several key aspects:
- The preceding uptrend. The Dark Cloud Cover pattern emerges following a prolonged price increase.
- The first candle of the pattern. During the prolonged uptrend, a large-bodied candle forms, confirming the ongoing bullish momentum.
- The second candle is the key element of the pattern. It opens above the white candle’s close but closes below the midpoint of the previous candle’s body. This formation signals that sellers are beginning to dominate the market, with the uptrend gradually weakening.
- It is also advisable to analyze trading volumes during the formation of the second candle. High volume can indicate strong seller confidence, reinforcing the reversal signal.
- Market context. It is crucial to evaluate the candlestick pattern within the broader market context and to review data from technical indicators. The bearish reversal can also be confirmed through additional signals—resistance levels, other chart patterns, and oscillators.
Dark Cloud Cover Pattern Example
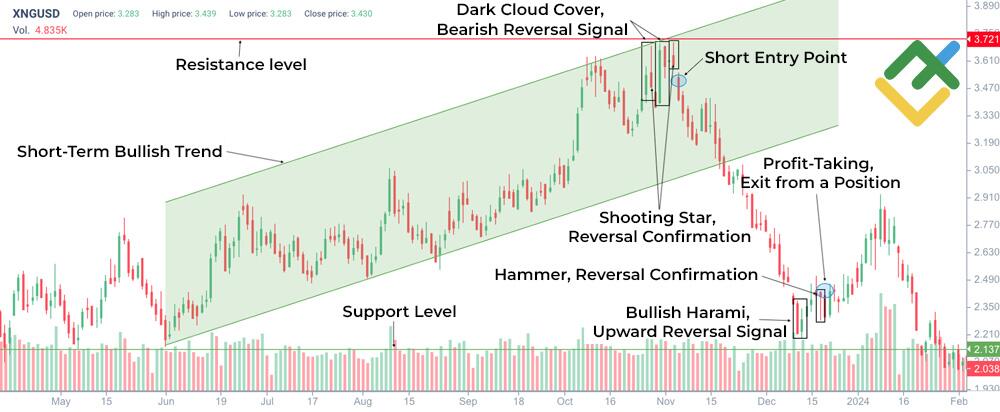
To illustrate this pattern, we will use the daily chart of COFFEE.
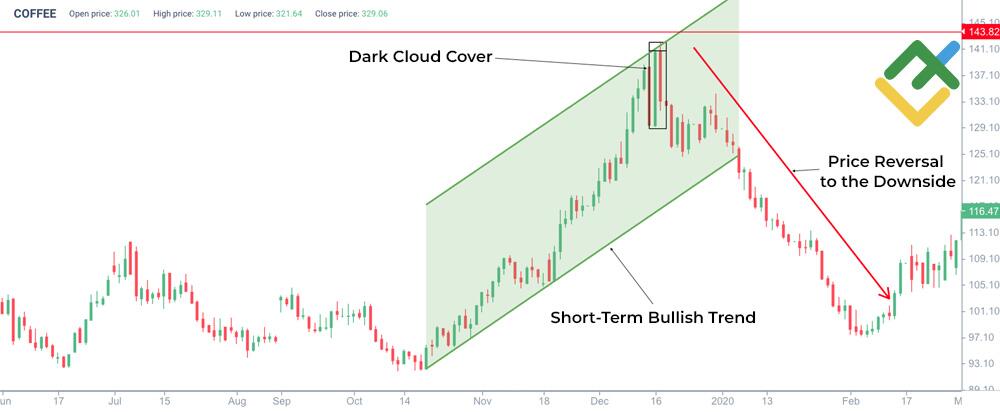
In the chart above, we can see an uptrend: the price was confidently moving upward. Then, a long green candle forms, suggesting confidence in further growth.
The next day, a bearish candle with a long body appears. It opens with a small gap above the previous day’s high, creating the illusion of continuing the bullish trend. But then the price falls during the day and closes below the midpoint of the up candle. This sharp change warns of a possible trend shift.
The price’s rebound from the resistance level and subsequent decline confirmed the presence of large-scale selling in the market.
Signals
The pattern becomes even more reliable if the second candle closes near its low and covers a significant part of the previous candle or if the trading volumes increase.
One of the confirming factors can be a divergence observed on the RSI or MACD oscillators, indicating a weakening of the upward momentum.
It is also worth noting that the sell signal is stronger if the pattern appears after a prolonged uptrend or near a key resistance zone.
Entry and exit points
A trade can be opened after confirmation of the downward reversal. One approach is to wait for prices to move below the second candle’s closing level and enter a short position at the open of the next trading session. In this way, the trader receives a more reliable trend reversal signal.
A stop-loss is set above the high of the pattern’s bearish candle. To determine the exit point, consider key support areas and Fibonacci levels.
Another method is to use a trailing stop, which allows the trader to stay in the trend as long as possible until the price starts moving in the opposite direction.
How to Trade Dark Cloud Cover Pattern
There are several trading strategies related to identifying and using this pattern.
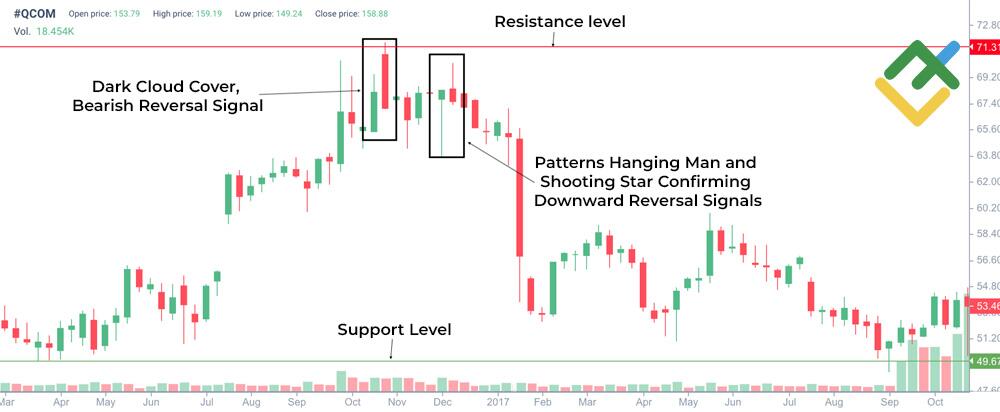
- The first and most important element of the strategy is to look for confirmation of a reversal after the formation of this pattern. This could be, for example, a small black candlestick, a bearish candlestick pattern, or a significant increase in trading volume during subsequent trading sessions.
- Identifying key support and resistance levels is essential when using patterns. In the case of the Dark Cloud Cover, traders usually explore potential support levels to determine profit targets.
- Risk management. Successful trading using the Dark Cloud Cover always involves effective risk management. Defining take-profit levels in advance and setting a stop-loss to minimize potential losses is important. When using the cloud cover pattern in trading, the stop-loss is usually placed slightly above the high of the bearish candle.
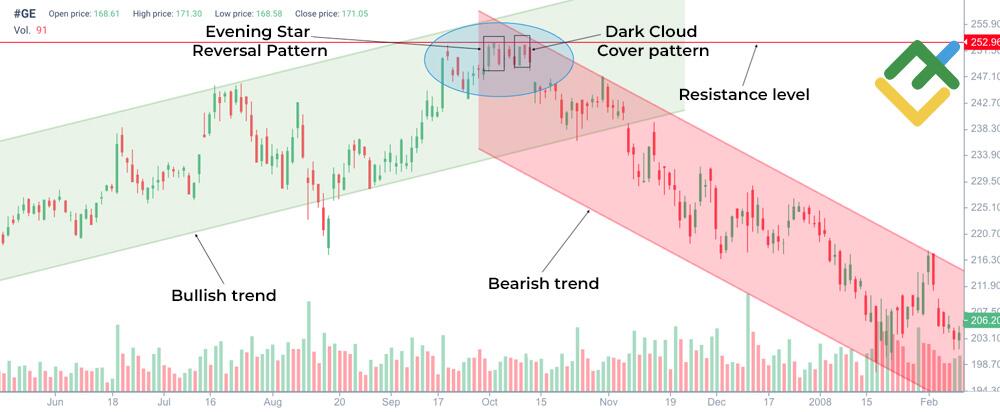
- Combination with other indicators and candlestick patterns. Many traders combine the pattern with technical indicators such as RSI, MACD, and moving averages to increase signal accuracy. They also pay attention to reversal patterns like Bearish Engulfing, Evening/Shooting Star, Doji, and others. This helps them better understand the current market situation and improve their chances of success.
- Market context. Not all patterns are effective, as their performance depends on market conditions. Analyzing economic events, news, and corporate reports can provide additional information and help confirm signals.
Trading the Dark Cloud Cover with Confirmation from MACD, RSI, and VWAP
Traders often seek confirming signals from technical indicators like MACD, RSI, and VWAP to enhance forecast accuracy.
- The MACD indicator is useful for identifying trend changes.
- An RSI value above 70 indicates overbought conditions, while a value below 30 signals oversold conditions.
- The VWAP identifies the average trade price, weighted by volume. When the price moves below the VWAP level while forming a bearish reversal pattern, it signals a possible trend shift and offers an opportunity for short positions.
An example of this strategy is shown below on the daily XAUUSD chart.
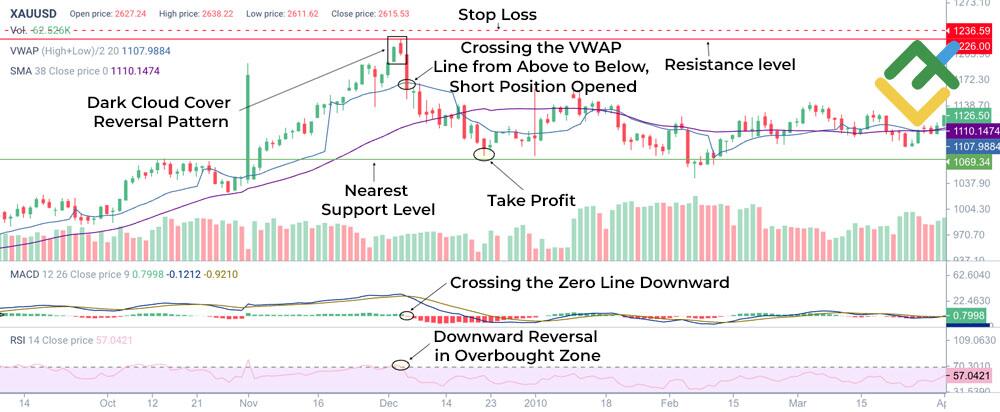
After the pattern was formed, technical indicators confirmed the price reversal to the downside:
- RSI values turned within the overbought zone and crossed the upper boundary from above to below.
- MACD values crossed the signal line from above and began falling in the negative area.
- The market price broke below the VWAP line, providing a bearish signal.
A short position should have been opened when the next high-volume bearish candlestick appeared, with the target set at the nearest support level and the stop-loss placed above the high of the second candle.
Trading the Dark Cloud Cover Pattern with Confirmation from Other Candlestick Patterns and Volume Indicators OBV and MFI
Another trading method using the bearish reversal pattern Dark Cloud Cover involves confirming it with other candlestick patterns and volume indicators OBV and MFI.
In this strategy, investors also pay attention to candlestick patterns like doji or star formations, which can strengthen bearish momentum.
A crucial confirmation comes from volume indicators. OBV helps track the flow of money into and out of the market. Therefore, the reversal pattern accompanied by a decline in OBV can signal bull weakness.
The MFI indicator, on the other hand, assesses both volume and price, indicating whether the asset is overbought or oversold. When these indicators align, the trader receives a more reliable market entry signal.
An example of such a trade is shown below on the H4 chart of Costco Wholesale Corp.
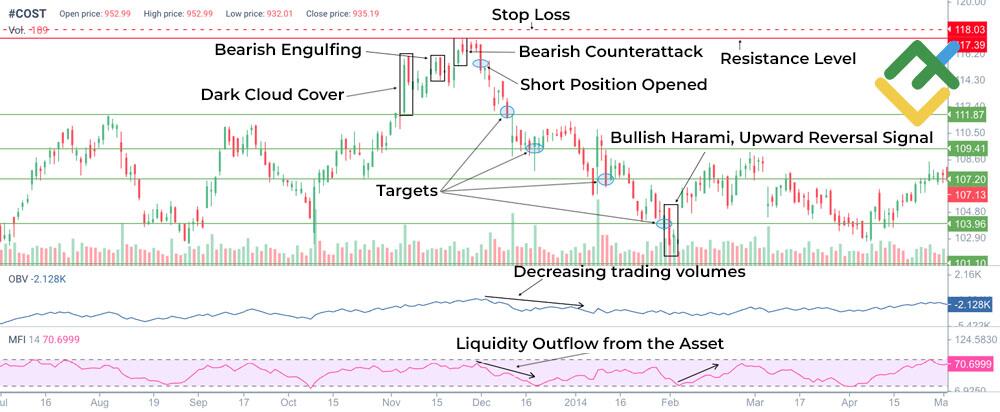
In this example, the pattern is confirmed by the Bearish Engulfing and Bearish Counterattack candlestick formations at the resistance level.
Additionally, OBV and MFI indicators showed declining trading volumes and a liquidity outflow from the asset. This served as an additional signal to open short positions.
Combined Trading of the Dark Cloud Cover Pattern with Confirmation from Other Candlestick and Chart Patterns
Trading this pattern with confirmation from other candlestick and chart patterns represents a comprehensive and deep approach to financial market analysis.
This method requires understanding the Dark Cloud Cover pattern and classical technical analysis patterns.
For example, if the pattern forms above a key resistance level or near a broader Head and Shoulders structure, it significantly strengthens the sell signal. Additional confirming candlestick patterns, such as Three Black Crows or Bearish Marubozu, also indicate a downtrend.
An example of this strategy is shown below on the daily USDCHF chart.
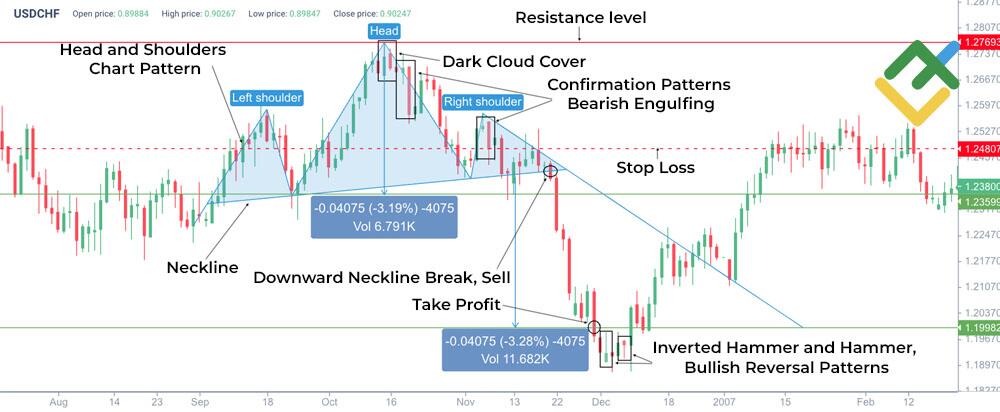
In the chart above, the reversal pattern formed at the peak of a larger Head and Shoulders chart pattern. Additionally, a series of Bearish Engulfing candlestick patterns warned of a price decline.
The breakout of the Head and Shoulders pattern’s neckline near the horizontal support level of 1.2359 provided final confirmation and a signal to open short positions.
The potential target was set at 1.1998, where the price later formed bullish reversal patterns Inverted Hammer and Hammer.
In this case, the stop-loss should have been placed above the neckline of the Head and Shoulders pattern.
The Dark Cloud Cover pattern was key in identifying the price reversal in this context. A short position could have been opened after the first Bearish Engulfing pattern appeared.
Dark Cloud Cover vs Piercing Line
The Dark Cloud Cover and Piercing Line patterns are important indicators of a potential trend reversal. However, despite their similarities, they provide opposite signals.
The Dark Cloud Cover candlestick pattern is considered a bearish reversal signal, indicating a potential shift toward a downward trend. The Piercing pattern, on the other hand, is a bullish reversal signal that suggests a possible transition from a downtrend to an uptrend.
Thus, the key difference between these two patterns lies in their direction and application. Understanding and correctly interpreting these patterns can significantly improve forecast accuracy and, consequently, the effectiveness of trading strategies.

Dark Cloud Cover vs Engulfing Candle
Both patterns may indicate a potential trend change but have different characteristics and formation conditions.
The Dark Cloud Cover consists of two candlesticks: the first is bullish, reflecting steady growth, and the second opens above the previous candle’s high but closes below its midpoint.
The Bearish Engulfing pattern is also classified as a formation that occurs after an uptrend. This figure forms at the peak of an uptrend and is a more powerful signal. It consists of two candles, where the second completely engulfs the first. The first candle is typically a small bullish one, while the second, a bearish candle, opens above the first candle’s close but closes below its open price.
Both patterns suggest potential declines, though the Dark Cloud Cover is considered a warning, whereas the Bearish Engulfing pattern is a more decisive indication of a trend reversal.

Dark Cloud Cover Pattern Pros and Cons
Trading this candlestick pattern offers several advantages, but risks should also be considered.
Pros
- Reversal signal. This pattern warns of a possible trend change, allowing traders to adapt to new market conditions quickly.
- Ease of identification. It is easy to spot the dark cloud cover on charts, so even beginner traders can use it.
- Signal confirmation. This pattern forms with a gap at the open and closes below the midpoint of the previous bullish candle, which enhances its reliability.
- Combination with other tools. Using the pattern with other technical indicators can improve the effectiveness of your trading strategy.
- Short-term trading opportunities. The pattern is often used in situational trading, offering the potential for quick profits within a short timeframe.
Cons
- False signals, especially in a sideways market or during periods of low volatility.
- The need for confirmation. Additional signals from other indicators or patterns are sometimes necessary to mitigate risks.
- Context matters. Consider the overall market trend and past movements for proper pattern interpretation.
- Limited application. The pattern may be less effective during prolonged trends, where more comprehensive analytical methods are needed.
- Impact of market conditions. During high volatility or external economic events, the pattern may provide less accurate signals.
Conclusion
In conclusion, the Dark Cloud Cover pattern can be a valuable tool for identifying bearish signals, helping traders manage risk effectively. By recognizing this formation, you can enhance your trading strategies and make informed trading decisions.
Despite its simplicity, its effectiveness lies in its ability to signal potential price movements before the start of a new trend. This candlestick pattern should be combined with other tools and strategies to maximize effectiveness and reduce potential risks.
Try trading the Dark Cloud pattern on a free demo account at LiteFinance.
Get access to a demo account on an easy-to-use Forex platform without registration
Dark Cloud Cover Pattern FAQs
The Dark Cloud Cover pattern is a candlestick formation that signals a trend reversal to the downside. The pattern consists of a long bullish candlestick, followed by a bearish candlestick that opens above the previous high and closes below the midpoint of the previous candle.
Entering the market with the Dark Cloud Cover pattern involves opening a sell position after a prolonged upward trend. Traders look for signals once the pattern is confirmed and a downtrend begins. Exiting occurs when the price decline weakens.
The Dark Cloud Cover is a bearish pattern. It signals a possible reversal of the current uptrend and warns traders of a potential price drop. Therefore, sell positions can be opened.
To use the pattern, traders should closely monitor candlestick formations. If a Dark Cloud Cover appears on the chart and there are confirming signals, short positions can be opened. To minimize potential losses and secure profits, set stop-loss and take-profit levels.
The reliability of the pattern depends on the market situation. While it can signal a reversal, it should be used alongside technical indicators and other patterns. Analyzing trading volumes is also recommended for greater forecast accuracy.
The opposite of the bearish Dark Cloud Cover is the Piercing Pattern, a bullish reversal signal. This pattern consists of a strong bullish candlestick following a long bearish one. The bullish candle opens below the previous day’s close but closes above the midpoint of the bearish candle, indicating a potential trend reversal.
The difference lies in the candlestick configuration. In the Bearish Engulfing pattern, the bearish candle completely engulfs the previous bullish one, whereas in the Dark Cloud Cover, the bearish candle closes at least halfway into the preceding bullish candle.

The content of this article reflects the author’s opinion and does not necessarily reflect the official position of LiteFinance broker. The material published on this page is provided for informational purposes only and should not be considered as the provision of investment advice for the purposes of Directive 2014/65/EU.
According to copyright law, this article is considered intellectual property, which includes a prohibition on copying and distributing it without consent.
{{value}} ( {{count}} {{title}} )
This post is originally published on LITEFINANCE.


