
In the modern world of trading and investing, it has become common to rely on technical indicators and trading robots, bypassing conventional chart and candlestick patterns.
Many novice traders underestimate the signals given by Japanese candlesticks or large patterns on price charts. Notably, these signals are crucial for understanding market psychology and its current condition. Thus, it is nearly impossible to trade profitably without these tools.
This article reviews a very rare yet significant technical analysis pattern known as a “Gravestone doji” candlestick. The overview explains how effective a “Gravestone doji” pattern is in trading and provides guidance on how to properly integrate the pattern into your trading strategy.
The article covers the following subjects:
Key Takeaways
|
Main thesis |
Conclusions and highlights |
|
What is a “Gravestone doji” |
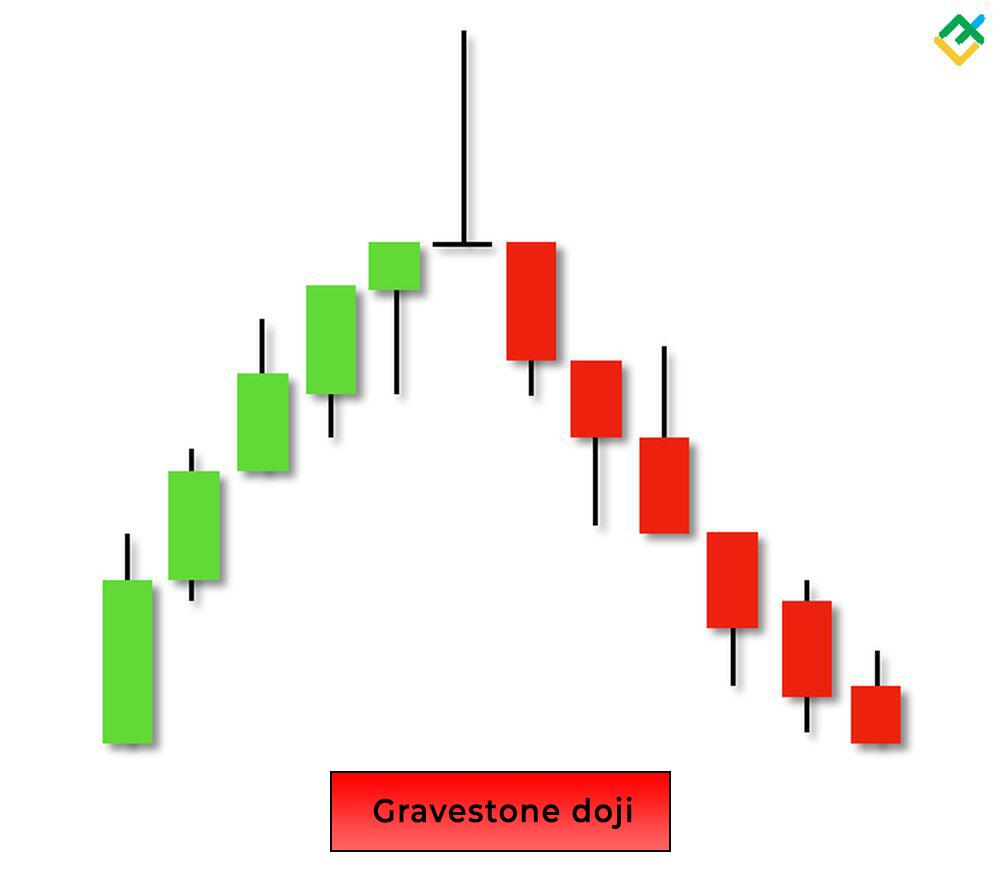
A “Gravestone doji” is a pattern of candlestick analysis that forms at the top of an uptrend and warns market participants of a bearish trend reversal. Sometimes, this pattern emerges at the bottom of a downtrend, signaling a bullish reversal. |
|
How to spot a “Gravestone doji” pattern on a price chart |
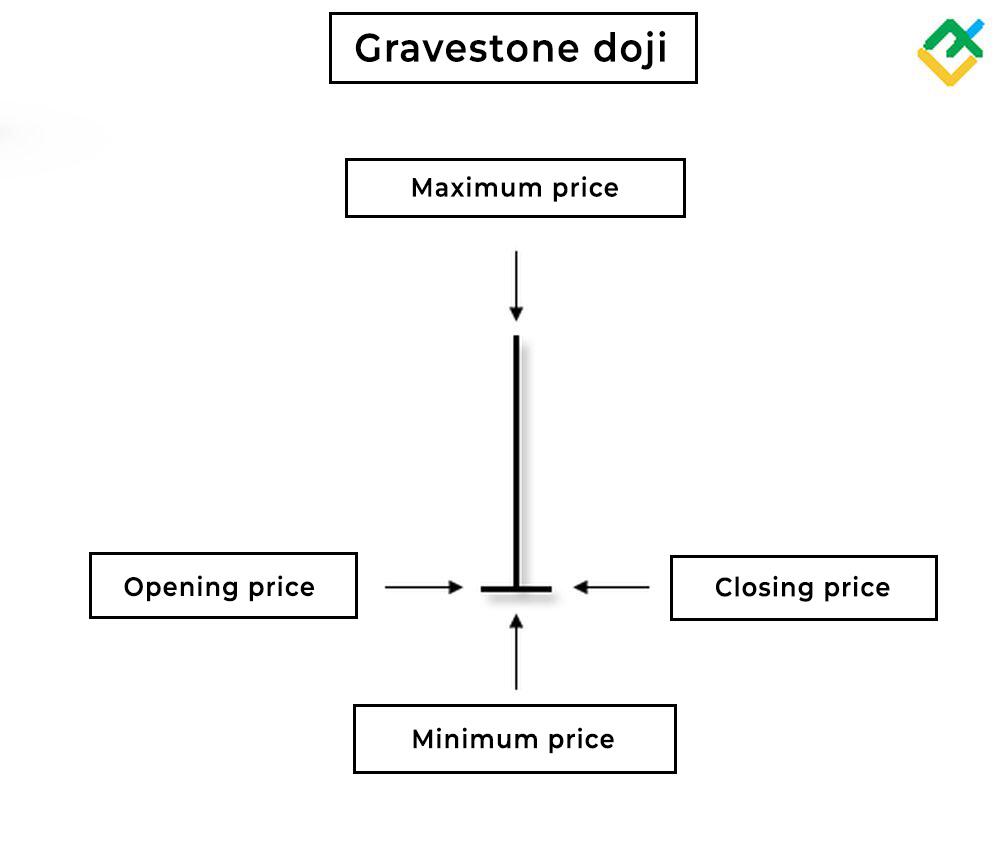
A “Gravestone doji” pattern comprises a single candlestick with no body and has only an upper shadow. The opening and closing prices are equal to candlestick’s low. |
|
“Gravestone doji” pattern features |
Rarely observed on price charts, a “Gravestone doji” candlestick closely resembles a “Shooting star” pattern but gives a stronger bearish signal. In technical analysis, the pattern is associated with military themes, evoking the image of a gravestone in memory of the fallen bulls and bears who defended their positions. |
|
Why the pattern emerges on the chart |
The market opens at swing lows, and the price grows to swing highs during the trading session. However, at a critical moment, the price suddenly reverses and closes at the swing low and opening price level. This shift in market sentiment can be facilitated by negative news or fundamental factors raising concerns among traders holding long positions. |
|
Pattern’s influence on the market |
A “Gravestone doji” pattern alerts the market about upcoming changes and a price reversal. The longer the pattern’s upper shadow, the higher the probability of a reversal. |
|
Pattern’s pros and cons |
A “Gravestone doji” candlestick pattern is easy to identify on a price chart. Its formation clearly defines support and resistance levels, allowing traders to determine potential pivot points in advance. However, a “Gravestone doji” formation, even with a long upper shadow, does not guarantee an immediate price reversal. Similar to other candlestick patterns, a “Gravestone doji” needs additional confirmation from technical indicators and other chart and candlestick patterns. |
|
How to trade a “Gravestone doji” pattern |
Before trading a “Gravestone doji,” it is important to pinpoint the key support and resistance levels. It is crucial to ensure the pattern has formed at these levels and wait for a confirmation. Once a “Gravestone doji” pattern is confirmed, you can open a trade in the direction of the reversal. |
|
On what time frames can the pattern be observed |
A “Gravestone doji” occurs on various time frames, but it is quite rare. Most often, the pattern can be found on H4 and lower time frames. On higher time frames, this pattern is even more uncommon. |
|
A “Gravestone doji” pattern trading strategies |
The pattern can be applied to both short-term and long-term trading strategies. When trading a “Gravestone doji” pattern intraday, you should open and close trades before the end of the trading session. Swing trading involves holding trades open for several days or weeks. For long-term trading, consider using W1 or higher time frames and open trades for a longer period, from several weeks to months, once the pattern appears. The efficiency of “Gravestone doji” trading increases with the use of additional technical indicators and other chart patterns. |
|
Stop-loss levels |
When trading a “Gravestone doji” candlestick pattern, a stop-loss order should be placed above or below the candlestick, depending on the prevailing trend. If the pattern forms at the peak of an uptrend, a stop-loss order is set above the dodgy candlestick and the resistance level. Conversely, if the pattern appears near the support line, a stop-loss order should be placed below the candlestick and the support level. |
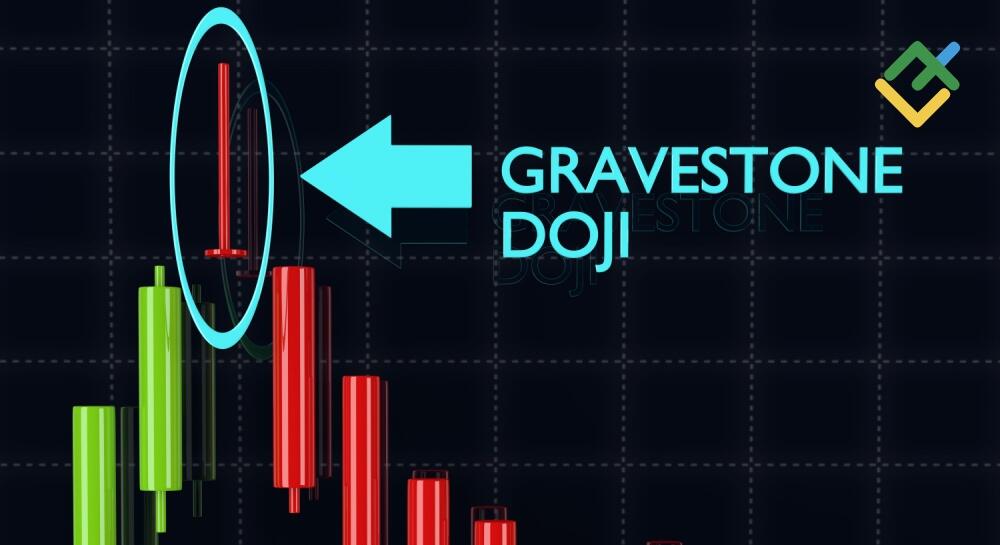
What Is a Gravestone Doji Candlestick?
A “Gravestone doji” is a chart pattern that usually forms at the peak of an uptrend and consists of a single candlestick with a missing body and a long upper shadow.
The pattern takes the form of an inverted “T” due to the peculiarities of trading within a specific period. For example, on the daily time frame, the opening price is equal to the lowest price for the whole trading period. Next, throughout the day, the quotes grow to the highest level, and by the end of the trading session, they fall back to the opening and the lowest price level. A long wick reflects the impulse bearish pressure on the price.
A “Gravestone doji” pattern usually signals a fading bullish momentum and appears before a price reversal at the peak of an uptrend. However, this Japanese candlestick can also be observed at the bottom of a downtrend, signaling market uncertainty and indecision and a potential bullish reversal.
A “Gravestone doji” candlestick not only signals trend reversals but also suggests downward corrections following a prolonged bullish trend. Thus, it is better to look for the pattern at the trend’s highs.
An example of this pattern is illustrated below in the 30-minute stock chart of Walgreens Boots Alliance Inc.
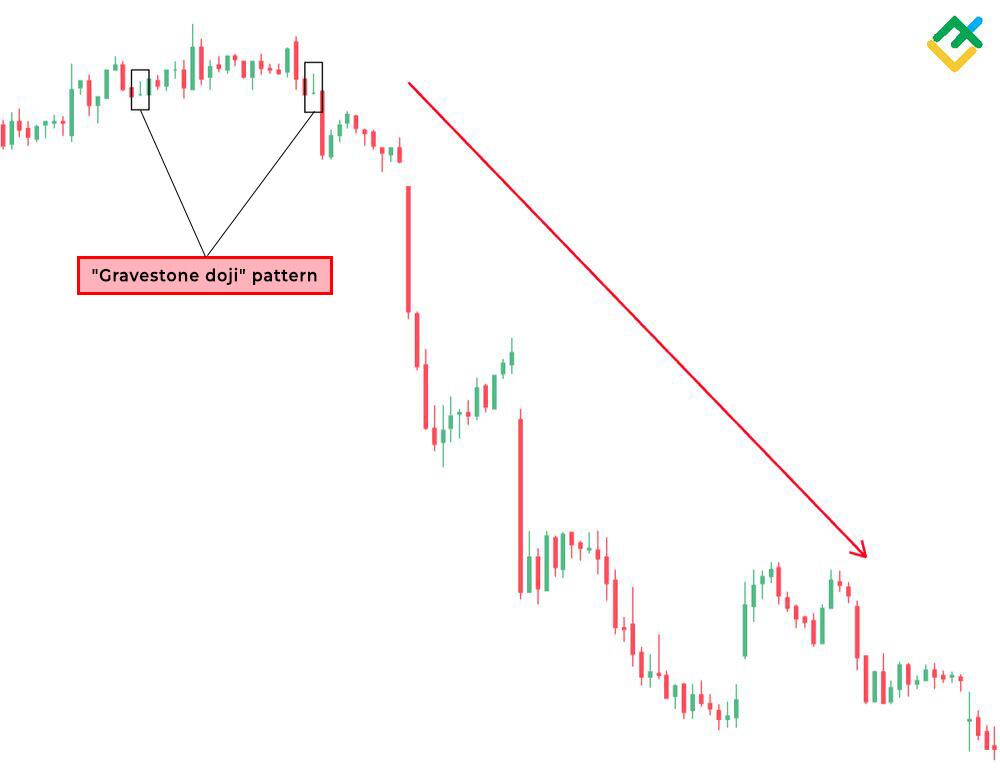
The asset price was in the accumulation phase, but after the formation of a series of “Gravestone doji” patterns, it began to drop sharply. The patterns became a strong signal to close long trades and initiate short positions on the instrument.
What Does a Gravestone Doji Look Like?
A “Gravestone doji” bearish reversal pattern looks like an inverted letter “T” and resembles a tombstone from which it derives its name.
The opening and closing candlestick prices should be at the same level as its low. Sometimes, the pattern can form a small lower shadow, which is also considered a variation of a “Gravestone doji” pattern. Additionally, the upper shadow of the candlestick with the highest price should be long.
The pattern demonstrates how sales put pressure on bulls during the day, resulting in a significant decrease in quotes by the end of a trading session.
How Does a Gravestone Doji Form?
A “Gravestone doji” appears after a prolonged bullish trend. Initially, the market opens with price growth, but as a trading session progresses, the sales volume seriously increases, leading to a long upper shadow and a missing body formation. Essentially, a “Gravestone” candlestick is a reflection of the struggle between bulls and bears, with the latter emerging victorious.
The candlestick’s extended upper shadow indicates the bulls’ unstable position in the market. The pattern causes the closing of long positions and forces traders to open short ones, resulting in a market reversal and a subsequent price decline.
A vivid example of a sharp and impulsive price collapse after a “Gravestone doji” formation can be seen below on the 4-hour gold chart.
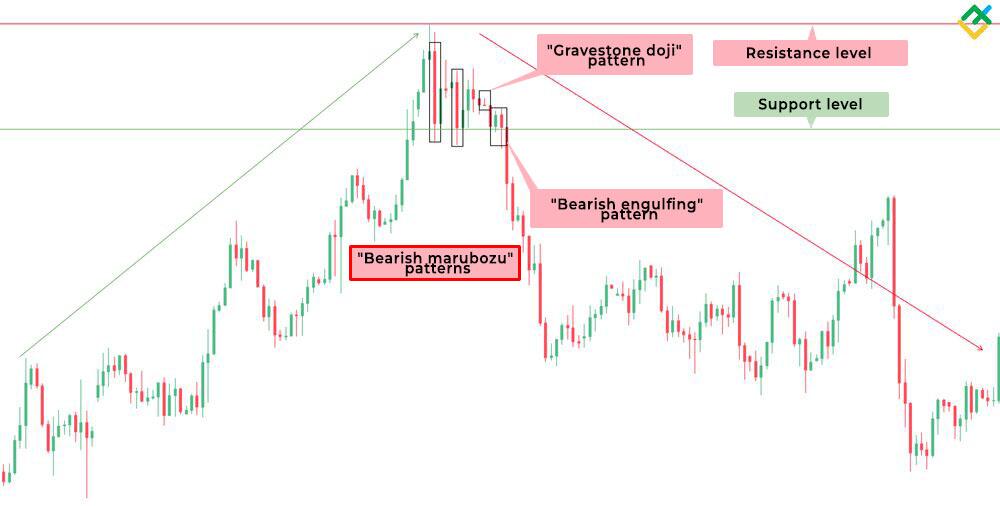
After a long upward trend, the asset hit strong resistance and retreated, forming “Bearish marubozu” candlestick patterns. Prior to the quotes’ sharp collapse, “Gravestone doji” and “Bearish engulfing” reversal patterns can be identified on the candlestick chart. The support breakout became a confirmation of the bearish trend’s beginning.
How to Identify the Gravestone Doji Candle Pattern
“Gravestone doji” candlestick patterns are easy to spot on a chart because of their unusual appearance. It is typically found at market peaks when an asset is undergoing a reversal following a prolonged uptrend. The presence of a long shadow and the absence of a candlestick body, with opening and closing prices at the same level as the low, indicate significant bearish pressure on the price.
Besides, make sure that the pattern forms at one of the key resistance levels. This confirms that bears become stronger.
Various stochastic and trend indicators, as well as volume and cash flow indicators, can be used to confirm a “Gravestone doji” candlestick. Moreover, additional candlestick and chart patterns, along with breakouts of support levels and trend lines, can be utilized to validate the pattern.
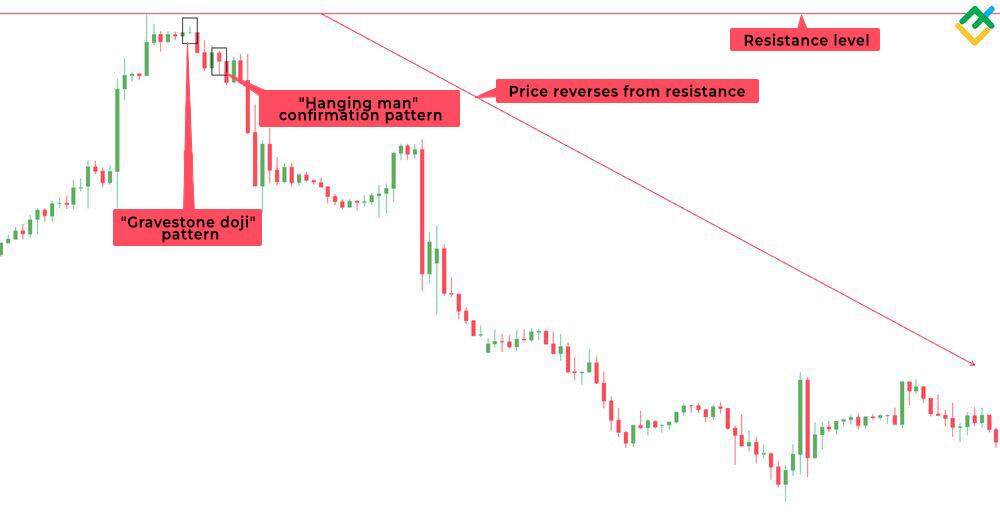
The hourly chart of the EURUSD currency pair shows how the price failed to break through the resistance level before a “Gravestone doji” pattern emerged. The pattern formation led to the downward trend reversal, and the subsequent appearance of a “Hanging man” reversal pattern finally confirmed the loss of the bullish momentum.
How to Trade the Gravestone Doji Candlestick Pattern
A “Gravestone doji” pattern forms at uptrends’ peaks, but as mentioned above, it can also be spotted at the bottom. Therefore, there are two strategies for trading a “Gravestone doji” in a bullish and bearish trend.
Bullish Gravestone Doji Candlestick Pattern
A bullish “Gravestone doji” variation is a less reliable upward reversal signal, unlike its bearish analog emerging at the top of an uptrend.
A bullish “Gravestone doji” pattern appears at the bottom after a prolonged bearish trend, signaling a waning of bearish momentum and a potential upward price reversal.
However, it is crucial to get additional confirmation from technical indicators to avoid false signals.
Let’s analyze an example of trading a bullish “Gravestone doji” pattern using the 4-hour BTCUSD chart.
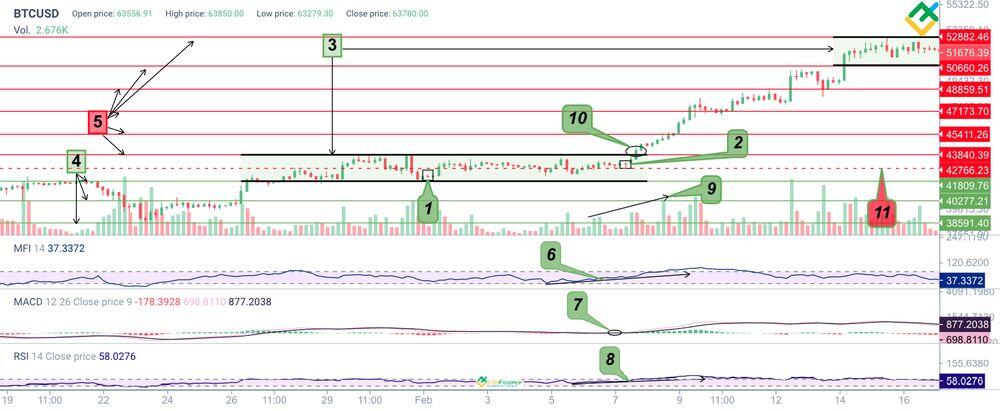
Values description:
-
“Gravestone doji” pattern.
-
“Dragonfly doji” confirmation pattern.
-
Consolidation zones.
-
Support levels.
-
Resistance levels, profit targets.
-
Gradual liquidity inflow in the asset.
-
MACD crosses the zero line and gives a buy signal.
-
RSI values grow, giving a bullish signal.
-
Rising tick volume.
-
Channel’s upper boundary breakout, buying.
-
Stop-loss.
The price has been trading in the consolidation zone 41809.76–43840.39 for a long time, within which a “Gravestone doji” pattern has formed. Nevertheless, the pattern has not received timely confirmation, and the quotes continued to move in a narrow, sideways range.
After some time, the price formed a bullish “Dragonfly doji” pattern and broke through the upper boundary of the channel on increased volumes, continuing to rise. This was a confirmation of a “Gravestone doji” pattern, although belated.
Additionally, technical indicators also indicated an uptrend development. The money flow index showed the inflow of liquidity into the asset. The RSI readings were also growing, suggesting a potential for further increase. MACD generated a buy signal when crossing the zero boundary from below.
In this case, one could open long trades above the resistance of 43840.39 and partially lock in profits within the 45411.26–52882.46 area.
A stop-loss order should be set below the “Dragonfly doji” pattern or the support of 41809.76, where the “Gravestone doji” pattern formed.
Bearish Gravestone Doji Candlestick Pattern
A bearish “Gravestone doji” candlestick typically occurs at the tops of price charts. In a fading bullish trend, this pattern indicates the end of upward movement and signals a downward price reversal.
Let’s analyze this bearish pattern in more detail using an hourly chart of AT&T Inc. stocks.
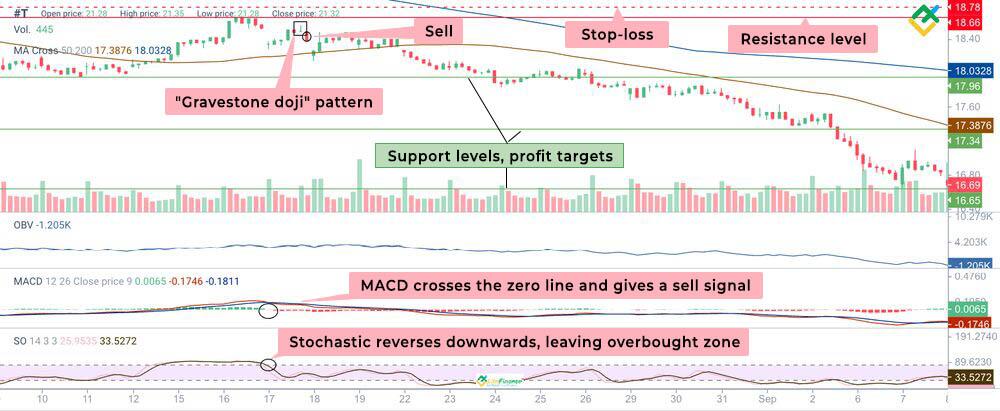
A “Gravestone doji” pattern with a long upper shadow can be identified near the 18.66 mark. After the pattern formed on the candlestick chart, the price sharply declined and crossed the MA50 dynamic support level, confirming the “Gravestone doji” pattern. During the formation of the candlestick pattern, the MACD values crossed the zero boundary from above, growing in the negative zone.
Besides, the Stochastic indicator values left the overbought zone and crossed the upper boundary from below. According to the OBV indicator, trading volume also began to decline, signaling a new bearish trend.
In this case, one could open a short position immediately after a “Gravestone doji” pattern formation, placing a stop-loss order above the resistance level of 18.78.
Profit targets should be located at the nearest support levels within 17.96–16.65.
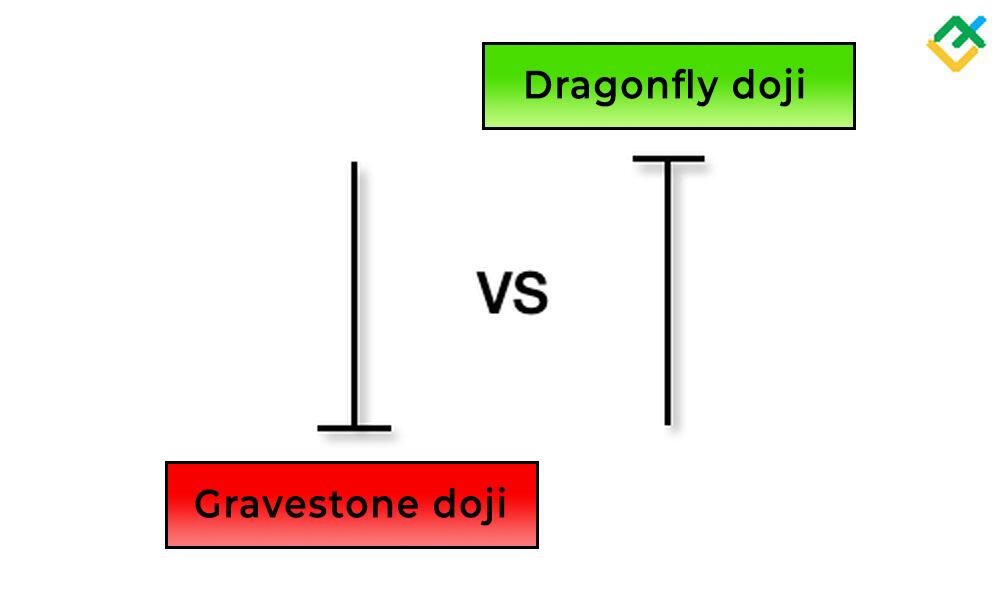
Gravestone Doji vs. Dragonfly Doji
“Gravestone doji” and “Dragonfly doji” patterns both signal a trend reversal, yet there are differences between them.
Gravestone Doji
-
A “Gravestone doji” is a candlestick pattern in the shape of an inverted letter “T,” formed on tops of uptrends and signaling a bearish reversal.
-
The pattern has a long upper shadow with opening and closing prices at the level of the candlestick’s low.
-
The candlestick shows that bulls managed to drive the price higher during the trading session, but bears pulled the quotes back to the opening price level.
Dragonfly Doji
-
A “Dragonfly doji” is a bullish reversal pattern, formed mostly at the bottom after a long downtrend and indicating growing bullish momentum.
-
The pattern forms in the shape of the letter “T” with a long lower shadow and closing and opening prices at the level of the candlestick’s high.
-
At the beginning of trading, bears drag the price down, but as the session draws to a close, they lose control over the market, allowing bulls to regain their lost ground by the end of trading.
Notably, “Dragonfly doji” and “Gravestone doji” patterns can appear both at the bottom and at the top. Except that “Gravestone doji” gives a stronger sell signal at the top, while “Dragonfly doji” provides a stronger buy signal at the bottom.
The Gravestone Doji Pattern – Pros and Cons
A “Gravestone doji” pattern is a crucial strong signal, yet it has both advantages and disadvantages.
|
Pros |
Cons |
|
A “Gravestone doji” pattern is an uncommon candlestick analysis pattern that can be easily identified on a price chart. |
The pattern is rarely found on price charts. The higher the time frame, the less often this pattern can appear. The pattern is more often found on the H4 and lower time frames. |
|
The pattern mostly indicates a trend reversal or a downward correction at the top of an uptrend. |
A “Gravestone doji” pattern requires additional confirmation from other candlestick analysis patterns and technical indicators. |
|
The pattern has a favorable risk/profit ratio and helps to pinpoint resistance levels more precisely. This enables you to initiate short trades at more advantageous prices. |
The pattern can give false signals. Therefore, a long upper shadow does not guarantee a final downward price reversal. |
|
A “Gravestone doji” pattern can be observed in all financial markets, including Forex, cryptocurrency, stock, and commodity markets. |
Conclusion
A “Gravestone doji” candlestick is one of the most reliable reversal patterns at the top, yet it has its nuances.
A bearish pattern’s variation usually occurs at the peak after a long uptrend. However, it can also appear at the bottom of a downtrend, signaling an upward reversal.
Most often, the pattern can be detected on the H4 and lower time frames. The higher the time frame, the rarer this pattern appears on the chart.
Like most other candlestick patterns, a “Gravestone doji” candlestick is best used in combination with technical indicators and other chart patterns. This approach will enhance the effectiveness of the pattern within a trading strategy and bolster potential profitability.
You can try trading a “Gravestone doji” pattern for free on the demo account offered by LiteFinance, one of the leading brokers. Take advantage of the multifunctional web platform and trade various financial assets.
Get access to a demo account on an easy-to-use Forex platform without registration
Gravestone Doji Pattern FAQs
A “Gravestone doji” is a bearish “Doji” pattern, typically formed at the top, indicating an imminent downward price reversal, warning market participants in advance.
A “Gravestone doji” candlestick gives a strong reversal signal, as the upper shadow of the candlestick indicates that buyers failed to maintain bullish momentum, and sellers took control of the market.
No, sometimes a “Gravestone doji” pattern occurs at the bottom of a downtrend when an asset is in an accumulation phase. Once a “Gravestone doji” candlestick appears at the bottom, bearish momentum may persist for a short while, but later the downtrend may reverse.
A “Gravestone doji” and a “Hammer” are reversal patterns of candlestick analysis. Unlike a “Gravestone doji,” a “Hammer” forms only at the bottom, signaling an imminent upward price reversal. A “Hammer” has a short candlestick body and a long lower shadow.
A “Gravestone doji” is the opposite of a “Dragonfly doji” pattern, which is more often observed at the bottom, warning market participants of an upward reversal. Moreover, a “Dragonfly doji” pattern lacks a candlestick body and has a long lower shadow, with the opening and closing prices at the level of the candlestick’s high.
A “Shooting star” pattern, similar to a “Gravestone doji” pattern, emerges at the peak following an uptrend. Unlike a “Gravestone doji,” a “Shooting star” pattern has a short body and a long upper shadow. A “Gravestone doji” pattern’s signal is much stronger at the top of a price trend, unlike the “Shooting star.”
A “Long-legged doji” pattern, like a “Gravestone doji,” lacks a candlestick body. However, a “Long-legged doji” has long upper and lower shadows on both sides, indicating high volatility for a certain period and indecision in the market. Therefore, market participants exercise caution when this pattern appears as it signals a possible reversal or a strengthening of the current trend.
A “Gravestone doji” can be confirmed using candlestick reversal patterns such as a “Hanging Man,” an “Evening Star,” a “Dark Cloud Cover,” a “Bearish Engulfing,” and others. Additionally, a “Gravestone doji” can be confirmed with the help of technical indicators and oscillators such as the RSI, MACD, and Stochastic or Fibonacci indicators.
A “Gravestone doji” is a bearish candlestick. Classic “Doji” candlesticks should be neutral. Nevertheless, this pattern can be both green and red. A green “Doji” candlestick can emerge when the closing price settles slightly above the opening price. However, the long upper shadow still indicates that the price is trading at the resistance level. Thus, the candlestick remains bearish.
The content of this article reflects the author’s opinion and does not necessarily reflect the official position of LiteFinance. The material published on this page is provided for informational purposes only and should not be considered as the provision of investment advice for the purposes of Directive 2004/39/EC.
{{value}} ( {{count}} {{title}} )
This post is originally published on LITEFINANCE.


