
The gold price forecast employs a comprehensive analysis of major factors affecting the precious metal’s supply and consumer demand. It also encompasses trading patterns, fractals, and emerging market trends.
What lies ahead for gold? Will it rise in price? In this article, we’ll delve into historical data, consult with experts, and present a gold price forecast for 2024, 2025, and a long-term forecast until the end of 2030, inviting you to anticipate the future trends.
The article covers the following subjects:
Highlights and Key Points
- When forecasting XAUUSD prices, it is necessary to conduct fundamental and technical analysis.
- The fundamental analysis considers changes in the monetary policy of central banks, global inflation indicators, currency trading activity, geopolitical events, and the economic health of major exporters and importers of gold.
- Technical analysis entails analyzing the price chart of XAUUSD by applying various indicators, candlesticks, and chart patterns.
- Many analysts offer a positive outlook for gold in 2024, expecting it to trade between $2,421.00 and $2,651.00. More conservative forecasts assume a decline in the price of XAUUSD, the precious metal will be traded in the area of $2,000.00–$2,133.00. Some analysts do not rule out an unprecedented rise to $2,750.23–$2,810.76 per ounce.
- LongForecast expects the rally to continue to $2,799.00 in 2025. For the first quarter of 2026, experts predict that the price of the precious metal will fluctuate in the range of $2,441.00–$2,882.00 and drop to $2,566.00 per ounce by the end of the year.
- Coin Price Forecast predicts that the price of the precious metal will rise to $4,649.00 per ounce between 2026 and 2030. According to more conservative forecasts, gold may rise to $2,800.00.
- The XAUUSD rate depends on interest rates, changes in global supply and demand, geopolitical tensions, currency devaluations against rising global inflation, and fluctuations in world currencies.
- The advantages of investing in gold include:
- Gold’s status as a safe-haven asset and reliability. Gold has always been highly valued and served as a means of payment worldwide.
- Resilience and stability. Many world currencies are backed by physical gold. Therefore, unlike money and securities, gold can rise or fall in value but cannot depreciate. In the long term, the precious metal’s price increases steadily, albeit slowly.
- The disadvantages of investing in XAUUSD include:
- Elevated volatility.
- The asset’s low profitability. Gold is often used as a risk hedge rather than an investment instrument.
- Low liquidity. Physical gold is hard to sell with minimal losses. Therefore, investing in gold through a brokerage account is a more convenient and highly liquid way to profit from investments in the precious metal.
- Gold is a highly volatile asset, and trading XAUUSD can be profitable in the short term and long term.
- Scalping assumes high-risk trading on M3–M5 time frames during one day. It allows you to make several trades quickly but with increased risk.
- Day trading suggests intraday trading, which allows you to open one or two profitable trades during a trading session on the M15, M30, and H1 time frames.
- Swing trading implies trading for several days or weeks. This strategy is based on the trend, i.e., a trader keeps a position open as long as the asset develops a trend.
- Long-term trading employs higher time frames to determine market entry points and keep trades open for months or a year. This strategy involves opening one trade but is more efficient because higher time frames give more accurate signals than lower ones.
- Position or news trading entails opening trades, considering fundamental factors. Notably, this strategy carries more risks because during the publication period of macroeconomic data or important news in the market, volatility increases, and the rate becomes less predictable. The asset’s quotes may sharply change direction, and the price may go against your forecast.
- Depending on the chosen trading strategy, the most suitable time frames include M30, H1, H4, D1, and W1.
How to make a gold price forecast?
There are three key approaches to make a reliable gold rate prediction:
1. Fundamental analysis.
Fundamental analysis tracks changes in monetary policy and other factors affecting the price of precious metals. First of all, these are changes in the global financial system and the actions of the US central bank. Therefore, it is extremely important to take into account various macroeconomic indicators:
- federal funds rate changes;
- inflationary market expectations;
- currencies’ movements and the money supply size;
- balance of imports and exports.
One of the most important fundamental factors in the analysis of the gold exchange rate is the assessment of the economic and geopolitical situation of the main importing and exporting countries.
In the first quarter of 2024, the following countries were the largest importers:
- Turkey – 30.12 tons.
- China – 27.06 tons.
- India – 18.51 tons.
- Kazakhstan – 16.39 tons.
- Singapore – 6.57 tons.
The top three gold producers in 2024 (projected data) include:
- China – 370 tons per year.
- Australia – 310 tons per year.
- Russia – 310 tons per year.
Notably, economics and politics are interrelated. It is important to take them into account when investing in the precious metal.
In recent months, gold has hit new all-time highs due to the following global events:
- Military conflict between Russia and Ukraine;
- Military conflict between Palestine and Israel;
- Tensions between China and Taiwan;
- The China-US trade war and related restrictions;
- Russian assets frozen abroad and sanctions imposed on Russia;
- Higher central bank interest rates and soaring inflation;
- The de-dollarization process and shift to national currencies in settlements between countries.
These events have already affected the gold price. Investors fear losing their capital and invest in XAU, increasing the appetite for gold. The metal is considered the main protective asset in times of various economic and political downturns.
In addition, fundamental analysis is commonly used in forecasting global trends.
2. Technical analysis.
This approach includes studying the history of XAUUSD quotes on charts using indicators and other tools for analyzing price movements. Technical analysis can help determine support and resistance levels, trend lines, possible price breakouts and reversals both in the long term, and in intraday trading.
Gold has a directional movement in the long term. Therefore, for technical analysis, trend indicators such as Moving Averages, RSI, MACD, and Bollinger Bands are primarily used.
3. Market sentiment analysis.
This approach consists in assessing the mood of buyers and sellers, namely, who has a dominant position in the market at the moment. Market sentiment analysis instruments include surveys, content monitoring in social networks, and specialized online platforms, such as litefinance.org.
It is important to remember that market sentiment can change very quickly. It is influenced by future gold price forecasts from professional analysts or, for example, by what information Fed Chairman Jerome Powell will provide.
A Recent History of Gold and Gold Price Today
Since the beginning of 2024, gold has gained more than 23% in value, reaching an all-time high of $2,450.00 per ounce in mid-May. Analysts and experts give mixed forecasts on the future price of XAUUSD. The asset has managed to touch new highs due to several fundamental factors.
Rising geopolitical tensions
The ongoing conflict between Russia and Ukraine is driving further growth in XAUUSD. In addition, the conflict in the Middle East between Palestine and Israel is fueling investor interest in gold to safeguard capital.
The restrictions recently imposed on China by the US in the form of increased duties on imports of Chinese goods may trigger the Chinese leadership to counteract. An escalation of the trade conflict could also lead to uncertainty in the market, spurring gold prices.
In addition, China has recently held military drills near the coast of Taiwan. Besides, the drill also served as a warning to foreign forces against provocations and interference.
US Federal Reserve monetary policy
The US Federal Reserve’s interest rate has been at 5.5% since last July, the highest rate in more than 20 years.
In March and April 2024, US inflation accelerated to 3.5% from 3.1%, cooling to 3.4% in May. In this regard, according to the results of the Fed meeting in late April-early May, the regulator decided to stand pat on rates. The FOMC minutes read that starting from June, the redemption cap for Treasury securities will be lowered to $25 billion per month from $ 60 billion per month.
Increased demand for gold from major importing countries
One of the fundamental factors in XAUUSD’s growth has been the significant purchases of physical gold by central banks of importing countries over the last six months.
The growth of demand for the precious metal is related to the redistribution of central banks’ reserves amid the precedent of freezing and withdrawing Russian assets. As the US loses its dominant position globally, more and more countries are abandoning the US dollar in favor of their national currencies and gold.
For example, in April, India increased its gold purchases three times despite the rising price of the precious metal, increasing its reserves by $3.115 billion. In the first four months of 2024, India’s gold reserves increased to $12.706 billion.
China, on the other hand, slowed down gold purchases amid the growth of XAUUSD quotations. Thus, imports in April decreased by 30% to 136 tons compared to the previous month. However, China is still one of the largest producers and consumers of the precious metal, increasing its reserves for 18 consecutive months.
The gold price is $2 332.79 as for 01.07.2024.
Gold Technical Analysis
The H4, D1, W1, and MN time frames can offer us insights into the price movement of XAUUSD until the end of 2024. Technical indicators such as RSI, MACD, MFI, MA Cross, and tick volumes play a crucial role in providing a more accurate forecast. These tools enable us to identify significant support and resistance levels on the XAUUSD chart, gauge the strength of the current trend, and pinpoint potential pivot points.
In addition to applying technical indicators, it is crucial to perform candlestick and chart analysis. Candlestick patterns can reveal reversal levels in advance, allowing you to open a profitable trade with less risk.
Some of the most common chart and candlestick analysis patterns found on the gold chart are the “Bull flag,” “Bear flag,” “Morning star,” “Evening star,” “Shooting star,” “Double bottom,” and “Double top” patterns.
First, let’s determine the overall market picture and sentiment by analyzing the XAUUSD monthly chart.
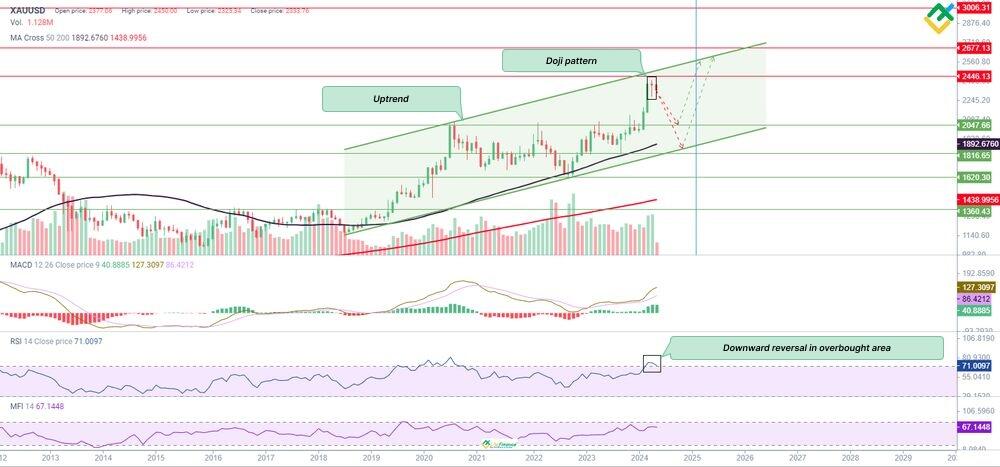
The price has maintained a sustained uptrend since August 2018. In May 2024, the quotes hit a new all-time high of $2,450.00 and began to reverse, forming a “Doji” candlestick pattern. It indicates uncertainty in the market. As a rule, the “Doji” pattern forming at the uptrend’s peak generates a strong bearish reversal signal.
The RSI values are in the overbought zone at 71, turning downward and returning to the middle range.
The MFI points to sideways movement, giving no buy and sell signals. However, tick volumes are growing for the third month in a row, showing investor interest. The highest tick volume was recorded in April 2024, when the “Doji” pattern emerged. Considering the above factors, bears control the market, and a downward correction to $2,047.66–$1,816.65 is possible where the MA50 acts as the support level.
Nevertheless, the MACD is moving sideways above the middle line. The short-term MA50 is located above the long-term MA200. In addition, the gap between the moving averages extends while the bullish trend remains resilient.
A preliminary analysis of the asset price showed that the gold market is overheated, and a short-term downward correction within the ongoing uptrend is possible soon.
Gold weekly price forecast as of 01.07.2024
Gold continues its downward correction within the medium-term uptrend. Last week, the price tested the key support 2300 – 2285 again. Bulls managed to keep the price above this zone. Thus, one may consider long trades with the first target at 2367 and the second target at 2450.
An alternative scenario suggests that if the price declines during this week and breaks through the 2285 level, the medium-term uptrend will reverse. In this case, the next bearish target will be the 2250 – 2240 area, and one may consider short trades during the upward correction.

XAUUSD trading ideas for the week:
Buy according to the pattern at support (B) 2300 – 2285. TakeProfit: 2367, 2450. StopLoss: according to pattern rules.
Technical analysis based on margin zones methodology was provided by an independent analyst, Alex Rodionov.
Gold Forecast For Next Three Months
Let’s analyze the H4 and D1 charts to forecast the XAUUSD price for the next three months.

A large “Double top” pattern is forming on the 4-hour chart. Currently, the second top is being developed, and the price is approaching the neckline at $2,291.80. Following a breach of this line and a consolidation below it, bears will likely push the price down to $2,112.97.
The MFI has bounced from the lower boundary, indicating the beginning of liquidity inflow into the asset. The RSI has crossed the lower boundary and left the oversold zone.
The MACD is growing in the negative territory, approaching the zero threshold. The MA50 is above the MA200, suggesting that bulls are holding their positions in the area of $2,320.86. However, the price is trading below the short- and long-term moving averages, confirming the growing pressure from sellers.
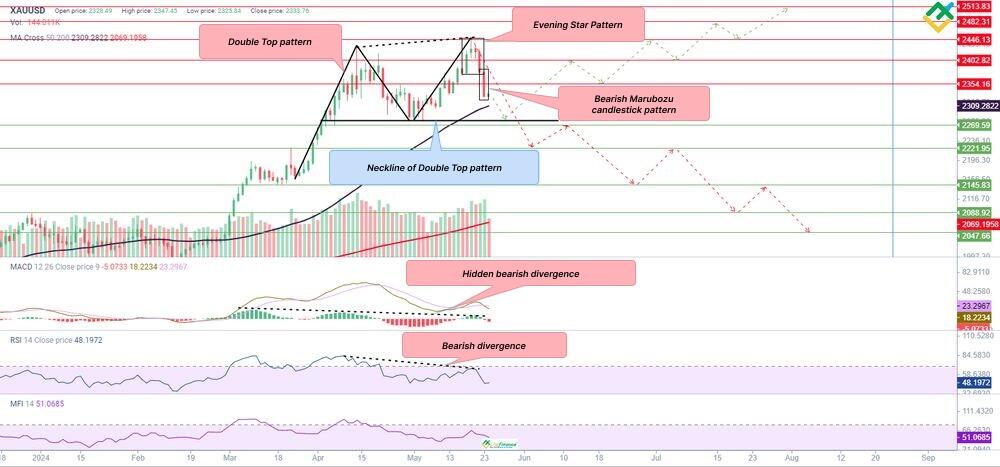
The daily chart displays the same “Double top” pattern along with the “Evening star” and “Bearish marubozu” candlestick patterns. These patterns signal an upward trend reversal.
The MFI is turning down, which on a larger scale indicates an outflow of funds from the asset. The RSI has formed a large bearish divergence with values below 50. The bearish momentum persists.
A hidden bearish divergence has formed on the MACD indicator, pointing to a possible strong downward movement in the near future.
However, the MA50 and MA200 are moving away from each other. The short-term MA is above the MA200. The price is also located above the MA50 and MA200. This suggests that these MAs are acting as support levels for bulls.
If bears break through the 50-day moving average and the neckline of the “Double top” pattern, bearish momentum is likely to intensify, and the price will plunge to $2,047.66 in the next few months. There is also a 200-day moving average support at this level from which the price may turn bullish.
If bulls manage to keep the price above $2,269.59, the bullish trend may continue to the range of $2,354.16–$2,513.83.
How will the XAUUSD rate change in 2024 according to technical analysis?
In general, gold is maintaining a sustainable uptrend. However, with new all-time highs reached over the past few months, a downward correction is increasingly likely.
Let’s examine the weekly time frame to more precisely define the potential movement of XAUUSD quotes during 2024.

Long-Term XAUUSD Technical Analysis for 2024
On the weekly chart, the gold price breached the uptrend’s range and formed a “Bearish engulfing” reversal pattern, an “Evening star” reversal pattern, and several “Shooting star” patterns. These patterns in the area of new highs signal a downward price reversal and the growing strength of bears.
The MFI shows a persistent outflow of liquidity from the asset, falling from the upper boundary. Tick volume is also decreasing. The number of trades on the asset is declining.
The RSI has been floating in the overbought zone since early March and has now breached the upper boundary, signaling a price reversal. The MACD also decreases within the overbought zone and is approaching the zero line, indicating that the bullish trend is losing steam.
The short-term MA50 is located at $2,050.88, acting as the support level.
The asset has most likely reached its new swing low and will correct down to $2,047.66 within the uptrend later this year. In November 2024, the correction may end, and the price will turn upward and reach the area of $2,148.21–$2,269.59.
Below is the table with the predicted highs and lows in the current year.
| Month | XAUUSD projected values | |
|---|---|---|
| Minimum | Maximum | |
| June 2024 | $2,157.26 | $2,308.69 |
| July 2024 | $2,116.88 | $2,254.85 |
| August 2024 | $2,137.97 | $2,271.67 |
| September 2024 | $2,049.58 | $2,150.53 |
| October 2024 | $2,036.12 | $2,187.55 |
| November 2024 | $2,170.72 | $2,285.13 |
| December 2024 | $2,150.53 | $2,308.69 |
Long-Term Trading Plan for Gold
Technical indicators and candlestick patterns suggest the gold rally will end this year, starting a downward correction to $2,148.21–$2,047.66.
Trading plan for the next three months
- A “Double top” pattern is highly likely to form on the H4 and D1 charts. If the neckline is breached, short trades can be opened with targets in the area of $2,221.95–$2,047.66.
- An alternative scenario implies that if bulls manage to keep the price above $2,268.59, the uptrend is likely to continue.
- Key support levels: $2,269.59, $2,221.95, $2,145.83, $2,088.92, $2,047.66.
- Key resistance levels: $2,354.16, $2,402.82, $2,446.13, $2,482.31, $2,513.83.
Trading plan for 2024:
- On the weekly price chart, reversal candlestick patterns are forming, signaling the end of the uptrend. A sharp downward correction to the trend lower boundary of $2,047.66 will likely begin soon, followed by an upward reversal.
- Key support levels: $2,269.59, $2,148.21, $2,047.66, $1,947.54, $1,816.65, $1,620.30.
- Key resistance levels: $2,446.13, $2,513.83, $2,677.13.
Gold Price Forecast 2024: What Do Experts Predict?
In 2024, gold continues to break historical records. XAU is сurrently trading on $2 332.79 per troy ounce, as for 01.07.2024.
The precious metal is in demand as a protective instrument due to global geopolitical tensions and uncertainty over the Fed’s future actions. More countries are purchasing XAUUSD as a protective tool against high prices and to safeguard the domestic market from external factors.
The main factors influencing the price of gold include:
- Monetary policy of central banks of developed countries. The reduction of interest rates and the easing of the US Federal Reserve System’s monetary policy spur risk appetite among investors. In this case, it will be possible to observe the inflow of funds into riskier assets and the outflow of liquidity from protective instruments, including XAUUSD.
- The upcoming elections in the United States are a source of political uncertainty, which can significantly affect gold prices. Gold is often seen as a safe-haven asset during political instability, and the uncertainty can boost its value as investors seek safer investments.
- The increase in geopolitical tensions and the escalation of conflicts can increase the gold price. The recent death of Iranian President Ebrahim Raisi could have unpredictable consequences and elevate tensions in the Middle East. Any outbreak of armed conflict could drag the price of XAUUSD to new highs.
- The ongoing trade war between the US and China, as well as the confiscation of Russian assets and the imposition of new sanctions against Russia, may seriously affect gold prices.
World Bank Group
According to the World Bank, the average price of gold in 2024 will be $2,100.00 per ounce. This forecast is based on the assumption that the conflict in the Middle East could lead to increased global uncertainty and a sharp rise in the cost of the precious metal.
International Monetary Fund (IMF)
The International Monetary Fund projects an average price of $1,775.00 per ounce. This forecast is based on inflation expectations, the state of financial markets, and economic performance. According to economists, despite the fact that the Fed is not yet planning to slash rates, a systematic easing of monetary policy is expected, which supports gold prices.
Goldman Sachs
According to Capex, investment bank Goldman Sachs forecasts an average price of $2,133.00 for the precious metal in 2024. According to analysts, XAUUSD will trade above the market consensus due to the increasing fear index and safe-haven status. Investors’ fear is due to rising uncertainty and the likelihood of a recession in the US this year.
In addition, the rally in the asset has been driven by active buying by central banks, particularly the People’s Bank of China and the Reserve Bank of India.
ABN AMRO
The Dutch bank forecasts an average gold price of $2000.00 per ounce in 2024. This estimate is based on expectations of a stronger US currency, higher interest rates, lower investor demand, and reduced inflationary pressures.
Predict-Price
The analytical portal Predict-Price reports that the price of gold will continue to grow in 2024. Thus, in a bullish scenario, quotes of the asset may reach $3,613.12. In a bearish scenario, the price may plunge to $2,198.46.
Trading Economics
Trading Economics analysts believe that by the end of the current quarter, the price of gold will be around $2,310.02 per ounce. By the end of the year, according to expert forecasts and global macro models, the price could reach $2,483.74.
Coin Price Forecast
According to Coin Price Forecast, gold may reach $2,419.00 per ounce by the middle of the year. By the end of 2024, experts anticipate that the value of the precious metal will continue to rise to $2,651.00.
LongForecast
Analysts at LongForecast predict that the price of gold will increase to $2,421.00 by the end of the year. The minimum price is expected to be $2,064.00 in June and the maximum price is predicted to be $2,542.00 in December.
| Month | Opening price | Min–Max | Closing price | Change |
|---|---|---|---|---|
| June | $2,253.00 | $2,064.00–$2,494.00 | $2,173.00 | -5.4% |
| July | $2,173.00 | $2,103.00–$2,325.00 | $2,214.00 | -3.6% |
| August | $2,214.00 | $2,214.00–$2,469.00 | $2,351.00 | 2.4% |
| September | $2,351.00 | $2,228.00–$2,462.00 | $2,345.00 | 2.1% |
| October | $2,345.00 | $2,213.00–$2,445.00 | $2,329.00 | 1.4% |
| November | $2,329.00 | $2,250.00–$2,486.00 | $2,368.00 | 3.1% |
| December | $2,368.00 | $2,300.00–$2,542.00 | $2,421.00 | 5.4% |
WalletInvestor
According to WalletInvestor‘s forecast, the price will range between $2405.73-2454.45 throughout the year. By the end of the year, gold will reach $2441.01 per ounce.
| Month | Opening price | Closing price | Minimum price | Maximum price | Change |
|---|---|---|---|---|---|
| July | $2,408.03 | $2,431.71 | $2,405.73 | $2,431.71 | 0.97% ▲ |
| August | $2,432.73 | $2,452.95 | $2,432.73 | $2,452.95 | 0.82% ▲ |
| September | $2,454.13 | $2,429.89 | $2,429.89 | $2,454.45 | -1%▼ |
| October | $2,429.51 | $2,435.74 | $2,429.51 | $2,437.40 | 0.26% ▲ |
| November | $2,435.39 | $2,436.17 | $2,434.05 | $2,436.59 | 0.03% ▲ |
| December | $2,435.52 | $2,441.45 | $2,431.01 | $2,441.45 | 0.24% ▲ |
CoinCodex
Based on the forecasts of the analytical portal CoinCodex, the price of the precious metal should rise to $2,810.76 by the end of 2024. The market price of the asset is below the 50-day SMA, which stands at $2,350.80. However, it is above the 200-day SMA, which is at $2,130.67.
GovCapital
GovCapital estimates that the price of XAUUSD will range between $2,212.60 and $2,391.50 during 2024. At the same time, experts do not rule out a possible surge up to $2,750.23.
| Month | Average price | Minimum price | Maximum price |
|---|---|---|---|
| June | $2,340.95 | $1,989.81 | $2,692.09 |
| $2,265.71 | $1,925.85 | $2,605.57 | |
| July | $2,268.35 | $1,928.10 | $2,608.60 |
| $2,308.11 | $1,961.89 | $2,654.32 | |
| August | $2,303.94 | $1,958.35 | $2,649.53 |
| $2,281.97 | $1,939.67 | $2,624.27 | |
| September | $2,280.73 | $1,938.62 | $2,622.84 |
| $2,212.60 | $1,880.71 | $2,544.49 | |
| October | $2,218.38 | $1,885.62 | $2,551.14 |
| $2,267.62 | $1,927.48 | $2,607.76 | |
| November | $2,276.06 | $1,934.65 | $2,617.47 |
| $2,351.72 | $1,998.96 | $2,704.48 | |
| December | $2,372.86 | $2,016.93 | $2,728.79 |
| $2,391.50 | $2,032.78 | $2,750.23 |
Gold price expert analysis for 2025 — 2030
Analysts and experts give mixed forecasts for the XAUUSD rate in 2025–2030. However, many expect the price of the precious metal to continue rising over the next five years.
WalletInvestor
WalletInvestor forecasts that the price of gold will continue to soar in 2025 and reach $2,520.83 by December. In the first quarter of 2026, the value will vary between $2,522.08 and $2,586.30, and by the end of the year, it will hit the level of $2,599.80. According to analysts, the moderate bullish trend will persist in 2027–2029. Thus, in May 2029, experts anticipate that the price will stand around $2,823.56 per ounce.
| Month | Opening price | Closing price | Minimum price | Maximum price | Change |
|---|---|---|---|---|---|
| 2025 | |||||
| January | $2,443.12 | $2,472.20 | $2,443.12 | $2,472.20 | 1.18 % ▲ |
| February | $2,473.22 | $2,493.79 | $2,473.22 | $2,493.79 | 0.82 % ▲ |
| March | $2,495.16 | $2,507.31 | $2,495.16 | $2,507.31 | 0.48 % ▲ |
| April | $2,508.46 | $2,515.01 | $2,508.46 | $2,521.02 | 0.26 % ▲ |
| May | $2,514.27 | $2,499.53 | $2,499.53 | $2,514.27 | -0.59 %▼ |
| June | $2,498.44 | $2,488.27 | $2,488.27 | $2,498.44 | -0.41 %▼ |
| July | $2,487.50 | $2,510.72 | $2,485.05 | $2,510.72 | 0.92 % ▲ |
| August | $2,511.84 | $2,531.69 | $2,511.84 | $2,531.69 | 0.78 % ▲ |
| September | $2,533.22 | $2,509.28 | $2,509.28 | $2,533.84 | -0.95 %▼ |
| October | $2,509.28 | $2,515.20 | $2,508.92 | $2,516.79 | 0.24 % ▲ |
| November | $2,514.42 | $2,515.78 | $2,513.43 | $2,516.07 | 0.05 % ▲ |
| December | $2,515.31 | $2,520.83 | $2,510.45 | $2,520.83 | 0.22 % ▲ |
| 2026 | |||||
| January | $2,522.08 | $2,551.30 | $2,522.08 | $2,551.30 | 1.15 % ▲ |
| February | $2,552.23 | $2,572.47 | $2,552.23 | $2,572.47 | 0.79 % ▲ |
| March | $2,574.15 | $2,586.30 | $2,574.15 | $2,586.30 | 0.47 % ▲ |
| April | $2,587.86 | $2,594.47 | $2,587.86 | $2,600.31 | 0.25 % ▲ |
| May | $2,593.81 | $2,579.54 | $2,579.54 | $2,593.81 | -0.55 %▼ |
| June | $2,578.33 | $2,567.75 | $2,567.75 | $2,578.33 | -0.41 %▼ |
| July | $2,567.37 | $2,589.80 | $2,564.57 | $2,589.80 | 0.87 % ▲ |
| August | $2,593.21 | $2,612.15 | $2,593.21 | $2,612.15 | 0.73 % ▲ |
| September | $2,612.44 | $2,589.09 | $2,589.09 | $2,613.15 | -0.9 %▼ |
| October | $2,588.65 | $2,595.00 | $2,588.41 | $2,596.09 | 0.24 % ▲ |
| November | $2,594.20 | $2,595.03 | $2,592.83 | $2,595.48 | 0.03 % ▲ |
| December | $2,594.68 | $2,599.80 | $2,590.02 | $2,599.80 | 0.2 % ▲ |
CoinCodex
CoinCodex analysts predict the price of XAUUSD to rise to $3,210.14 over the next 5 years. In 2030, experts anticipate the price to trade around $3,797.10 per ounce.
Predict-Price
According to Predict-Price, gold will range between $2,148.94 and $4,270.93 in 2025. In addition, artificial intelligence predicts further growth of XAUUSD to $4,928.74 in 2026. At the same time, the probability of no clear trend is 95.68%.
CoinPriceForecast
CoinPriceForecast predicts that the asset will reach $2,677.00 in mid-2025, $2,925.00 by the end of the year, and $3,164.00 by the end of 2026. In addition, analysts pinpoint that the precious metal’s price will continue to post gains in 2027–2030, reaching $4,649.00 per ounce.
| Year | Mid-Year | Year-End | Tod/End,% |
|---|---|---|---|
| 2025 | $2,677.00 | $2,925.00 | 25 % |
| 2026 | $3,128.00 | $3,164.00 | 35 % |
| 2027 | $3,174.00 | $3,270.00 | 40 % |
| 2028 | $3,537.00 | $3,780.00 | 62 % |
| 2029 | $4,023.00 | $4,185.00 | 79 % |
| 2030 | $4,368.00 | $4,649.00 | 99 % |
LongForecast
LongForecast expects the price of gold to fluctuate between $2,421.00 and $2,700.00 at the beginning of 2025. During the year, the trading instrument’s price may reach $2,799.00.
A downward reversal of XAUUSD quotes will mark the beginning of 2026, and the bearish trend will continue throughout the year. Thus, by the end of 2026, gold will drop to $2,566.00. According to analysts, the minimum price will stand near $2,241.00 in July 2026.
In 2027–2028, the price of the precious metal will range widely between $2,163.00–$2,800.00.
| Month | Opening price | Min–Max price | Closing price | Change |
|---|---|---|---|---|
| 2025 | ||||
| January | $2,421.00 | $2,421.00–$2,700.00 | $2,571.00 | 11.9% |
| February | $2,571.00 | $2,316.00–$2,571.00 | $2,438.00 | 6.1% |
| March | $2,438.00 | $2,273.00–$2,513.00 | $2,393.00 | 4.2% |
| April | $2,393.00 | $2,363.00–$2,611.00 | $2,487.00 | 8.3% |
| May | $2,487.00 | $2,299.00–$2,541.00 | $2,420.00 | 5.4% |
| June | $2,420.00 | $2,278.00–$2,518.00 | $2,398.00 | 4.4% |
| July | $2,398.00 | $2,292.00–$2,534.00 | $2,413.00 | 5.1% |
| August | $2,413.00 | $2,413.00–$2,691.00 | $2,563.00 | 11.6% |
| September | $2,563.00 | $2,315.00–$2,563.00 | $2,437.00 | 6.1% |
| October | $2,437.00 | $2,437.00–$2,696.00 | $2,568.00 | 11.8% |
| November | $2,568.00 | $2,504.00–$2,768.00 | $2,636.00 | 14.8% |
| December | $2,636.00 | $2,636.00–$2,939.00 | $2,799.00 | 21.9% |
| 2026 | ||||
| January | $2,799.00 | $2,608.00–$2,882.00 | $2,745.00 | 19.5% |
| February | $2,745.00 | $2,525.00–$2,791.00 | $2,658.00 | 15.7% |
| March | $2,658.00 | $2,441.00–$2,697.00 | $2,569.00 | 11.8% |
| April | $2,569.00 | $2,406.00–$2,660.00 | $2,533.00 | 10.3% |
| May | $2,533.00 | $2,343.00–$2,589.00 | $2,466.00 | 7.4% |
| June | $2,466.00 | $2,294.00–$2,536.00 | $2,415.00 | 5.1% |
| July | $2,415.00 | $2,241.00–$2,477.00 | $2,359.00 | 2.7% |
| August | $2,359.00 | $2,278.00–$2,518.00 | $2,398.00 | 4.4% |
| September | $2,398.00 | $2,398.00–$2,674.00 | $2,547.00 | 10.9% |
| October | $2,547.00 | $2,377.00–$2,627.00 | $2,502.00 | 8.9% |
| November | $2,502.00 | $2,454.00–$2,712.00 | $2,583.00 | 12.5% |
| December | $2,583.00 | $2,438.00–$2,694.00 | $2,566.00 | 11.7% |
GovCapital
GovCapital forecasts that the average price of gold will be $2,392.01 at the beginning of 2025 and could rise to $3,736.97 by the end of the fiscal year. Analysts are very bullish on the precious metal and expect it to reach an unprecedented $11,644.26 per ounce in May 2029.
| Month | Average price | Minimum price | Maximum price |
|---|---|---|---|
| January 2025 | $2,392.01 | $2,033.21 | $2,750.81 |
| $2,423.29 | $2,059.79 | $2,786.78 | |
| June 2025 | $3,645.27 | $3,098.48 | $4,192.06 |
| $3,588.28 | $3,050.04 | $4,126.52 | |
| December 2025 | $3,723.89 | $3,165.30 | $4,282.47 |
| $3,736.97 | $3,176.42 | $4,297.52 | |
| January 2026 | $3,738.31 | $3,177.56 | $4,299.06 |
| $3,790.85 | $3,222.22 | $4,359.47 | |
| June 2026 | $5,398.36 | $4,588.60 | $6,208.11 |
| $5,339.54 | $4,538.61 | $6,140.47 | |
| December 2026 | $5,517.46 | $4,689.84 | $6,345.08 |
| $5,531.65 | $4,701.90 | $6,361.40 | |
| January 2027 | $5,533.61 | $4,703.57 | $6,363.66 |
| $5,567.45 | $4,732.33 | $6,402.57 | |
| June 2027 | $7,690.69 | $6,537.09 | $8,844.30 |
| $7,635.15 | $6,489.88 | $8,780.43 | |
| December 2027 | $7,817.76 | $6,645.09 | $8,990.42 |
| $7,844.16 | $6,667.53 | $9,020.78 | |
| January 2028 | $7,846.77 | $6,669.75 | $9,023.78 |
| $7,891.22 | $6,707.54 | $9,074.91 | |
| June 2028 | $9,576.25 | $8,139.81 | $11,012.69 |
| $9,527.48 | $8,098.35 | $10,956.60 | |
| December 2028 | $9,735.26 | $8,274.97 | $11,195.55 |
| $9,765.06 | $8,300.30 | $11,229.82 | |
| January 2029 | $9,761.83 | $8,297.55 | $11,226.10 |
| $9,814.86 | $8,342.63 | $11,287.09 | |
| May 2029 | $10,038.51 | $8,532.73 | $11,544.28 |
| $11,644.26 | $9,897.62 | $13,390.89 |
How Has the Gold Price Changed Over Time?
Below is a chart of XAUUSD reflecting gold prices over the last ten years. Evaluating historical data is vital to making the forecasts as accurate as possible.
As a financial asset, gold is affected by many political and economic factors. However, the key point to focus on when predicting the price of gold is the US dollar, as this currency is used to value the precious metal worldwide.
A stronger US dollar makes gold cheaper, and vice versa; a weaker US currency makes gold more expensive. In addition, the US is the largest holder of gold bars in its reserves, holding about 8,100 tons of the precious metal.
The price of gold increased from the beginning of November 2022, reaching $1,854.38 by the end of December 2023. After reaching $1,999.47 in May 2023, the price turned downward. Since then, gold has lost about 13% in five months, falling to $1,810.40.
Against the background of the Palestinian-Israeli conflict in the Middle East, which began in October 2023, the XAUUSD began to recover, gaining more than 12% by the end of the year. At the end of December, the price stood at $2,041.19. In January-February 2024, gold consolidated in the price range of $2,088.40–$1,984.23.
Since the beginning of 2024, gold has risen by 23%, hitting an all-time high of $2,450.00 in May. Currently, there is uncertainty in the market. Investors are ready to sell the asset and lock in profits after gold showcased rapid growth since the beginning of March.
Uncertainty in the market and a change in sentiment to bearish are connected with the release of weak macroeconomic data in the US and Jerome Powell’s speech.
- The US unemployment rate jumped to 3.9% in April from 3.8% in March. The indicator is expected to continue to rise.
- The number of job openings in March was 8.488 million, compared to 8.813 million in February. This figure indicates a decline in openings in the US non-farm sector.
- The US consumer price index declined slightly in April to 3.4% from 3.5% in March. However, the overall trend is still negative, as the index stood at 3.1% in January 2024 and showed a slight decline for the first time since the beginning of the year. This continues to point to inflation concerns.
- The producer price index also increased to 0.5% in April from 0.1% in March.
In light of this data, Fed Chairman Jerome Powell made several statements at the FOMC press conference:
- Inflation remains elevated. Moreover, the pace of its decline is slowing.
- A rate cut is not advised since there is no confidence in a stable inflation decline to the target of 2%.
- Demand in the labor market exceeds supply. However, unexpected weakness could be a factor in lowering inflation.
- Political developments in the country will not be considered in the Fed’s decision-making.
- Rate cuts will take longer than expected.
- A rate hike at the next meeting on June 11-12 is unlikely.
Nevertheless, gold prices are supported by rising tensions between China and Taiwan. The US announced its support for the island with new advanced weapons and sent its delegation. Amid the news, China sent 21 planes and 11 warships to the coast of Taiwan.
Rising geopolitical tensions worldwide are causing investors to keep most of their capital in gold. In addition, the rapid growth in demand from central banks and institutional investors also supports the price of the precious metal at a relatively high level.
However, the reduction in conflicts worldwide, the decline in inflation, and the softening of the Fed’s rhetoric may lead large market participants to invest in riskier assets and partially close their positions in gold.
Factors That May Affect the Gold Price
Typically, traders associate fundamental analysis with the stock market, not gold. While fundamental analysts monitor certain companies’ financial statements, gold market analysts monitor macroeconomic factors, political and economic world stability, and competition from investment alternatives to forecast prices. Let’s look into five macroeconomic parameters that can influence the cost of the main precious metal.
Inflation
Inflation has an impact on the value of XAU, but not as much as one might think. Most novice gold investors believe that if it rises in the US, gold price should next push higher since more inflationary dollars will have to be paid per ounce. However, in the long term, there is no strong correlation between inflation and gold prices. This can be seen from the chart below, which shows its dynamics in the US and gold prices.
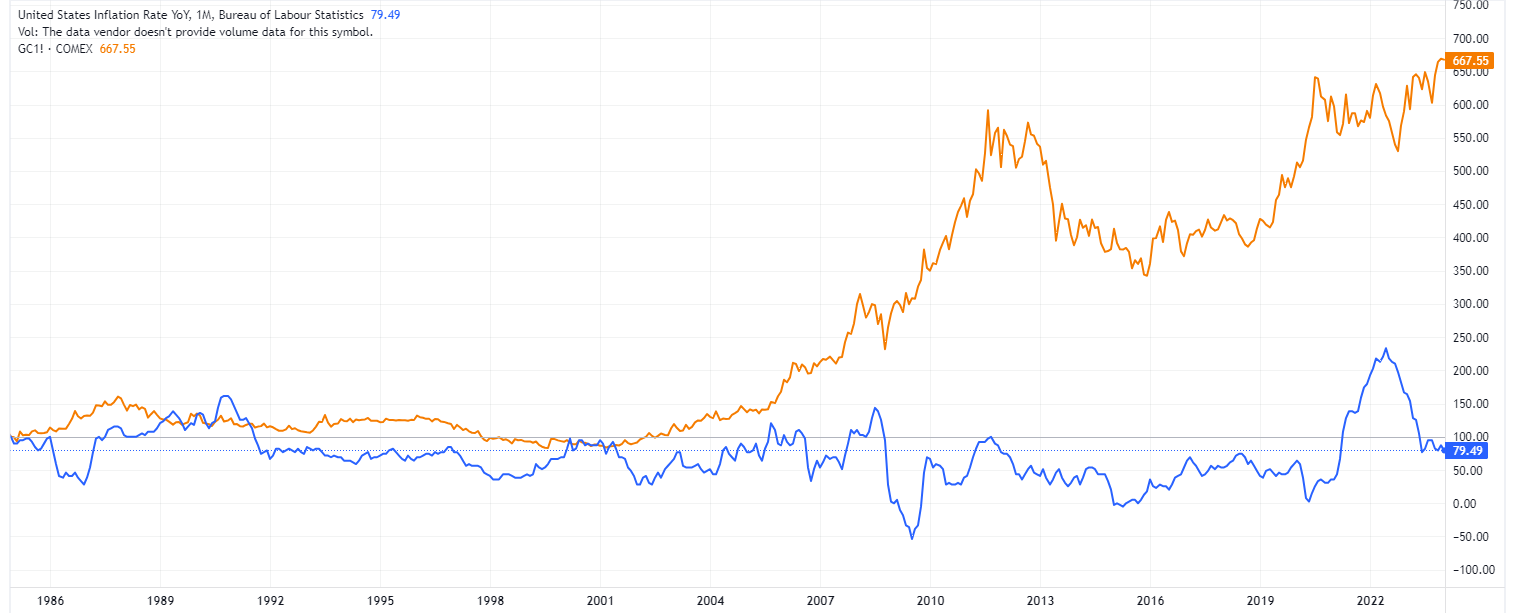
Source: Tradingview.com
This lack of a strong correlation can be explained by two major factors:
- Gold is not a commodity. That is, it is not consumed by industry, like oil or ferrous metals, and therefore reacts to the purchasing power of the currency differently than other goods
- During periods of economic and stock market growth, gold has to “compete” for profitability and investor attention. Moreover, during such periods, inflation is usually at a high level.
Currency Fluctuations
Gold, along with the US dollar, is a safe haven asset. Therefore, if the exchange rate of one of the currencies (for example, the dollar) depreciates relative to the other reserve currencies, while the purchasing power of buying gold in other currencies is preserved, then the logical consequence is the rise in the gold price relative to the depreciated currency. The chart shows an inverse long-term relationship between the US dollar index (blue line) and gold prices (orange line).
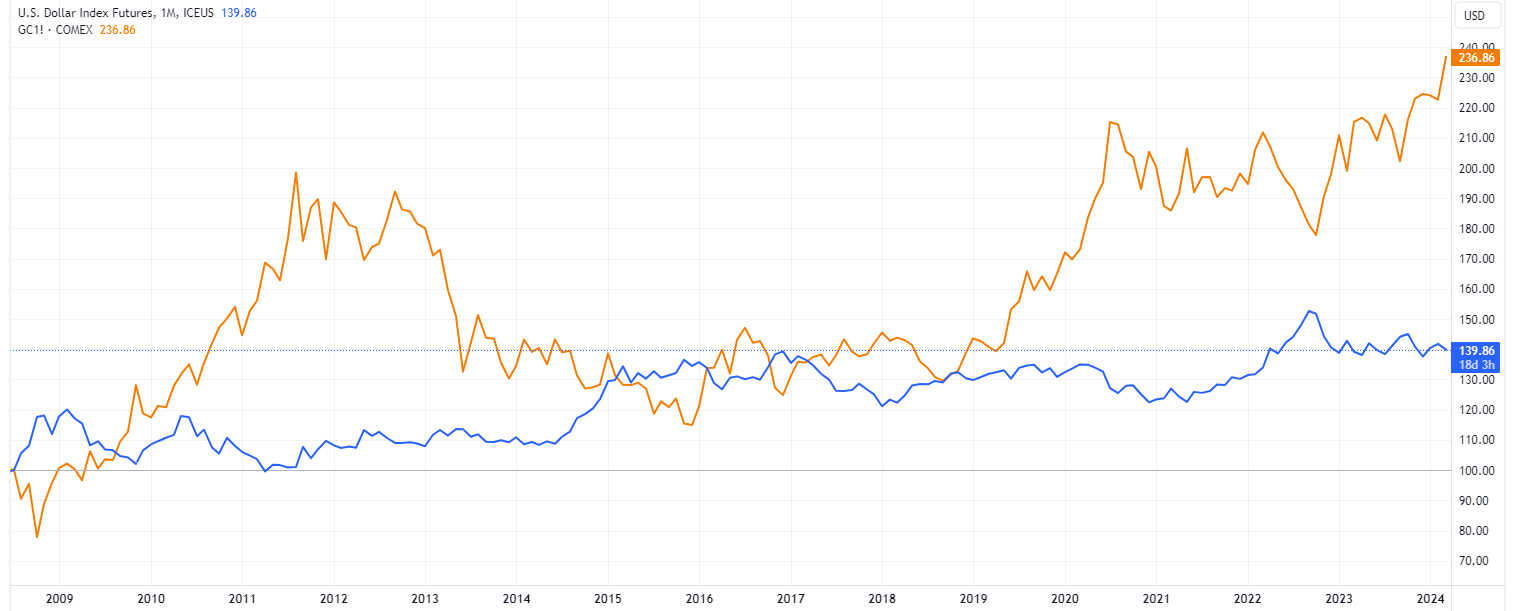
Source: Tradingview.com
The Risk of a Recession Due to Geopolitical Tensions
Any military conflict is the most significant (after financial market crises) source of economic uncertainty for investors. Gold is best used as a safe investment in times when investors are terrified, and regional conflicts may well cause such conditions in the market. They are also associated with several other factors that drive prices up, including excessive spending, money supply, political instability, and currency depreciation.
Interest Rates
Gold is sensitive to interest rates because it does not generate current income. Therefore, it is highly sensitive to alternatives in the stock market that offer potential income, such as bonds or even stocks that pay dividends. There is a noticeable, albeit not perfect, negative correlation. When US government bond yields rise, the likelihood is high that gold will trend sideways or even downtrend, while declining yields tend to lead to very positive movements in gold prices.
For example, to combat the recession in the early 2000s, the federal reserve lowered interest rates to very low levels, forcing long-term investors to withdraw from low-yield bonds and diversify their portfolios with gold. This provided good support to the already rising gold prices. On January 26, 2022, the Fed provided clues on rate hikes, which led to a sharp price decline from $1,847.61 to $1,791,03 on January 26-28.
Supply and Demand
Supply and demand are the most difficult factors in assessing the impact on the cost of metal. Large investors in gold, including central banks, the IMF, and leading funds, significantly impact the market. The actions of these participants can substantially change the demand for gold jewelry and investment instruments.
Accounting for the actions of these large players is an impossible task for an ordinary private investor who does not have access to the disclosed information of all the players’ economic data.
For a general understanding of the market balance, you need to know that most of the demand for gold is more or less evenly distributed between investment instruments and jewelry.
As an example, it is shown below that China and India (with strong economic growth) have become major buyers of gold over the past two decades to invest and create reserves and, therefore, have provided an additional stimulus for price increases.
China, Central Bank gold reserves, t.:
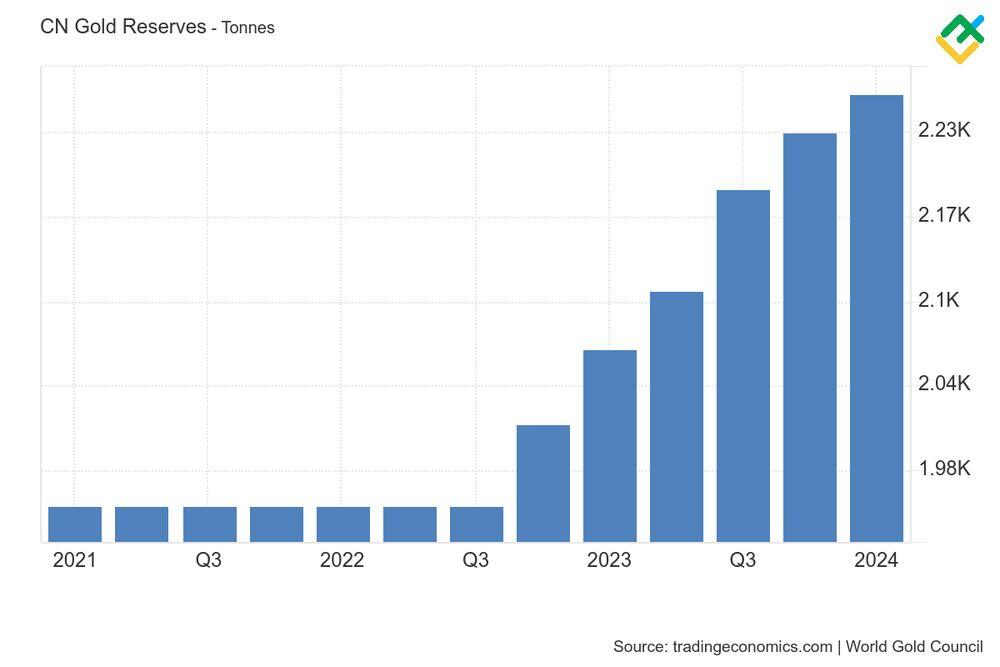
Source: TradingEconomics.com
India, Central Bank gold reserves, t.:
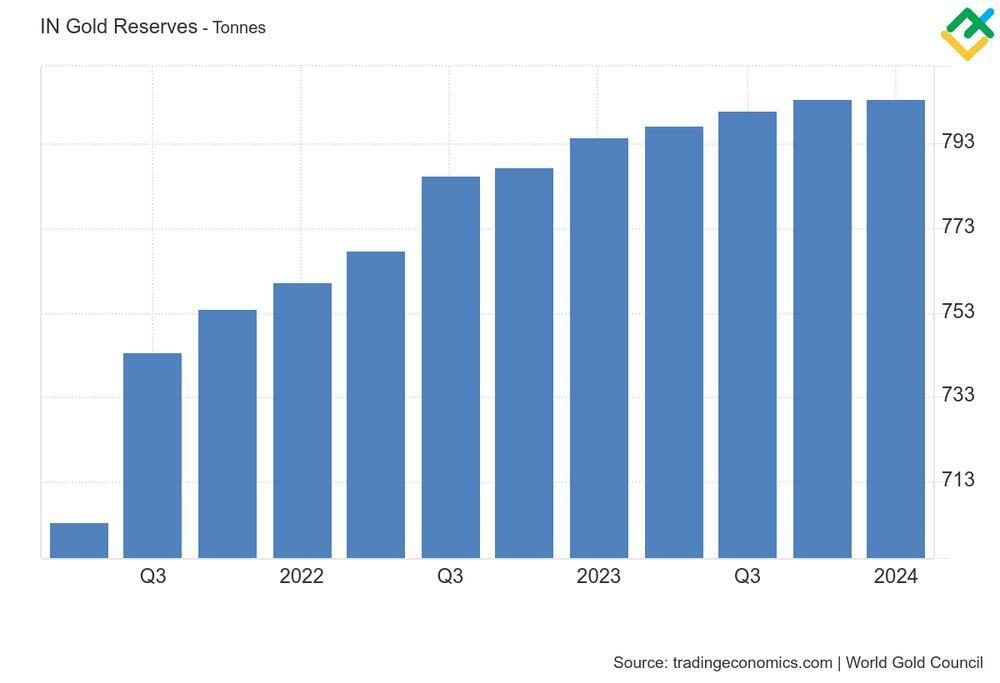
Source: TradingEconomics.com
Conclusion: Is Gold a Good Investment?
Not only is gold known for being a portfolio diversifier, but with inflationary pressures on the rise, investors tend to turn to gold because it is considered a good hedge against rising prices.
“During periods of systemic risk, both gold and the dollar tend to be used as safe haven assets and may move in a similar direction,” Juan Carlos Artigas, Head of Research, World Gold Council, said.
The XAUUSD uptrend will likely continue for the next six years until 2030.
| Year | Mid-Year | Year-End | |
|---|---|---|---|
| 2025 | $2,677.00 | $2,925.00 | 25 % |
| 2026 | $3,128.00 | $3,164.00 | 35 % |
| 2027 | $3,174.00 | $3,270.00 | 40 % |
| 2028 | $3,537.00 | $3,780.00 | 62 % |
| 2029 | $4,023.00 | $4,185.00 | 79 % |
| 2030 | $4,368.00 | $4,649.00 | 99 % |
Source: Coin Price Forecast
As new initiatives of the world’s central banks and governments to support markets and economies were successfully implemented in 2021, gold has shown a decline. However, new waves of coronavirus, skyrocketing inflation, political tensions, and conflict destabilize the situation, so we have a reason to expect an expert gold price forecast to come true – the price will continue to soar significantly in 2024–2025.
Be sure to create a free demo account with LiteFinance! LiteFinance will keep you informed of the latest news about gold as an investment asset, and the user-friendly interface will come in handy if you decide to start trading gold or any other asset.
FAQs on Gold Price Forecast
The current price of gold for today 01.07.2024 is $2 332.79.
From a technical point of view, the precious metal prices are moving within a large ascending channel. In addition, high global inflation and escalating conflicts continue to keep gold prices elevated. However, the possibility of a downward correction to the key support level of $2,060.00 should not be ruled out in the near future.
Analysts predict that the price of gold will rise to $4,649.00 in the next 5 years. More conservative forecasts suggest that the price may increase to $2,800.00.
Some experts estimate that the average cost of gold in 2034 will be $6,093.00.
Since ancient times, gold has been considered a key protective instrument that backs up national currencies and well-being. So, buying gold is undoubtedly safe as its value grows over time.
Analysts forecast an increase in the price of XAUUSD between $4,649.00 and $4,928.74 between 2024 and 2030. The rapid growth of the precious metal’s value is expected against the backdrop of the tightening of the US Federal Reserve’s monetary policy, the growth of geopolitical tensions worldwide, and global de-dollarization.
History shows that gold tends to appreciate steadily. Therefore, purchasing it can be a good long-term investment to diversify risk. Gold can be bought at current prices and during downward corrections.
Gold quotes have reached a new all-time high in mid-May at $2,450.00. After the downward correction, the price tumbled to $2,047.00. It is expected to gradually rise to $2,269.00 in the second half of 2024.
Gold is considered a safe-haven asset, and its price is constantly rising. Therefore, XAUUSD will never depreciate and will be in demand to protect against the risks associated with rising economic and geopolitical tensions.
The $2047.00 level is currently the key support for the precious metal. The price is unlikely to plunge below this level in the near future. In addition, the $2,000.00 mark is a psychological level for market participants.
The main reasons for the growth of gold prices are macroeconomic factors, a tense geopolitical situation, global inflation, high interest rates, and monetary policy tightening.
Price chart of XAUUSD in real time mode

The content of this article reflects the author’s opinion and does not necessarily reflect the official position of LiteFinance. The material published on this page is provided for informational purposes only and should not be considered as the provision of investment advice for the purposes of Directive 2004/39/EC.
{{value}} ( {{count}} {{title}} )
This post is originally published on LITEFINANCE.


