Gold bulls are waiting for a reason to lock in profits on their long positions. They see a strong US dollar and seasonal influences on the gold price as a potential reversal factor. However, another event will trigger a sell-off in the XAUUSD. Let’s discuss this topic and make a trading plan.
The article covers the following subjects:
Highlights and key points
- Gold has reached several all-time highs in 2024.
- The precious metal averaged a 3.2% slip in September 2017-2023.
- The labor market may trigger a correction in the XAUUSD.
- A bounce from support levels of $2,465, $2,430, and $2,400 should be used for buying gold.
Weekly fundamental forecast for gold
In 2024, the gold market experienced a notable shift. Gold reached an all-time high against the US dollar and other major world currencies. The precious metal outperformed the US stock indices and similar assets, including shares of gold mining companies and silver, which cannot return above $30 per ounce. The value of an average gold bar has exceeded $1 million for the first time in history, and for the majority of the year, the XAUUSD did not react to the traditional drivers, namely the US dollar and US Treasury yields. However, as the summer and fall approached, the market returned to a more typical pattern.
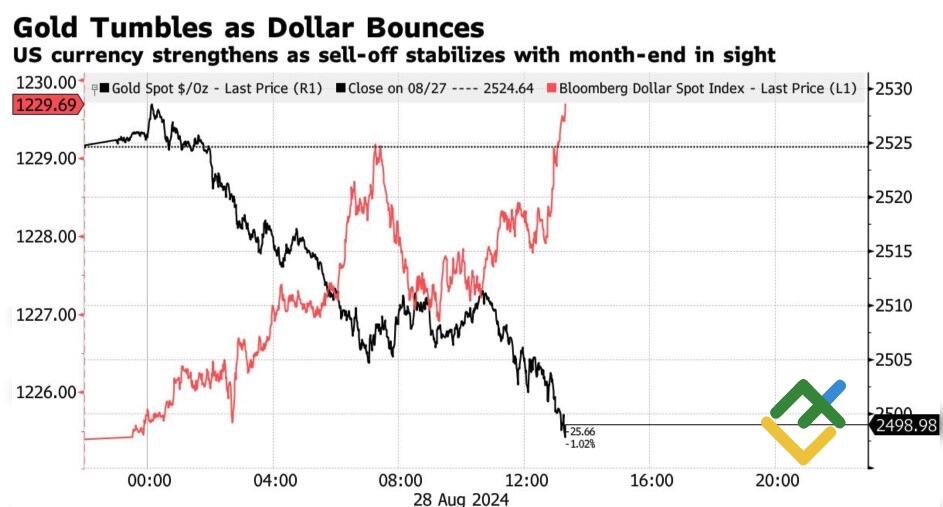
Following an impressive 22% rally, traders are waiting for an opportunity to secure profits on their long positions. The strengthening of the US dollar amid expectations of a recovery in the US labor market in August has prompted some traders to close their long trades with profits. Weak employment statistics for July led to an increase in the expected scale of the Fed’s monetary expansion to 100 bps in 2024, which weakened the greenback and contributed to the XAUUSD rally. However, the decreasing probability of aggressive monetary policy easing is prompting the precious metal price to retreat.
Gold price and US dollar performance
Source: Bloomberg.
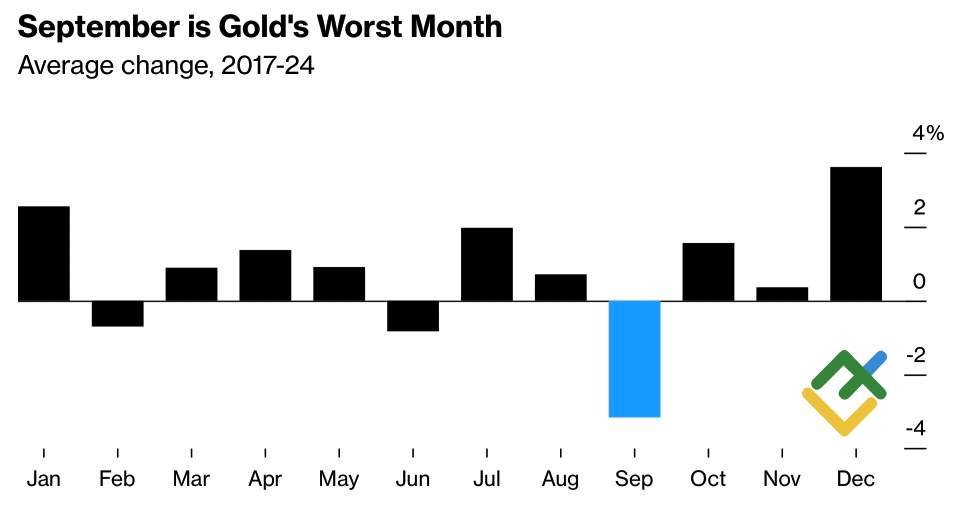
The seasonal factor may have an impact on the gold price correction. Since 2017, the gold market has consistently closed September in the red. The first month of autumn offers the most unfavorable conditions for the precious metal. According to the results of the last seven years, there has been a 3.2% decline on average. The primary reason is the revision of investment portfolios following the summer vacation period. Over the past decade, the S&P 500 index has experienced an average decline of 1.5% in September. Gold sales are often implemented to maintain margin requirements for other financial market assets, primarily stocks, as was the case on Black Monday, August 5.
Seasonal course of gold prices
Source: Bloomberg.
The US presidential election may further exacerbate the unfavorable situation for the XAUUSD. As the voting date draws near, market volatility and demand for safe-haven assets like the US dollar are likely to increase. Investors are waiting for the upcoming debate between Donald Trump and Kamala Harris on September 10, noting the precedent set by the Republican’s clash with Joe Biden triggered the Trump trade. History may repeat itself this time.
The primary catalyst for the XAUUSD slump is the robust US employment data for August. A rebound in the labor market will effectively reverse expectations for a reduction in the federal funds rate from 5.5% to 4.5% in 2024 and revive investor appetite for the US dollar.
Weekly trading plan for gold
It is anticipated that a correction in the price of gold is impending. Therefore, keep short trades formed at $2,515 open and initiate more short positions if the US economy confirms its strength. However, the XAUUSD‘s uptrend persists. Therefore, if the precious metal rebounds from $2,465, $2,430, or $2,400 per ounce, one can lock in profits on their short trades and start buying gold.
Price chart of XAUUSD in real time mode
The content of this article reflects the author’s opinion and does not necessarily reflect the official position of LiteFinance. The material published on this page is provided for informational purposes only and should not be considered as the provision of investment advice for the purposes of Directive 2004/39/EC.
{{value}} ( {{count}} {{title}} )
This post is originally published on LITEFINANCE.


