
Historically, US stock indices have outperformed their European counterparts. However, the return of Donald Trump to the White House has turned the tables. The EuroStoxx 50 has managed to outperform the S&P 500 index. Let’s discuss this topic and make a trading plan.
The article covers the following subjects:
Major Takeaways
- European indices are significantly outperforming their US counterparts.
- Problems with fiscal stimulus measures could lead to a correction in the S&P 500.
- The eurozone economy will accelerate in 2025.
- Buying the EuroStoxx 50 with targets of 5,630 and 5,830 is currently a viable strategy.
Quarterly EuroStoxx 50 Fundamental Forecast
Donald Trump aims to prevent a schism within the Republican Party regarding a substantial and impactful fiscal stimulus package. If it does not receive congressional approval, the S&P 500 will likely face a significant sell-off. At the same time, the EuroStoxx 50 index has encountered no such issues. Germany is revising its fiscal brake rule, and the European Union is approving a €150 billion defense fund. This is further bolstered by the confluence of factors, including the European Central Bank’s monetary stimulus, the euro’s strengthening, and the region’s accelerating economic growth. These elements collectively provide European stock indices with a clear competitive edge.
However, all things must eventually come to an end. While the US has outperformed Europe in recent years, in 2025, the situation has reversed. The EuroStoxx 50 and other European indices have had their best start in two decades compared to their US counterparts. Meanwhile, Citigroup and JPMorgan anticipate a 4-5% increase in the European stock market by the end of the year.
Spread Between EU and US Stock Indices
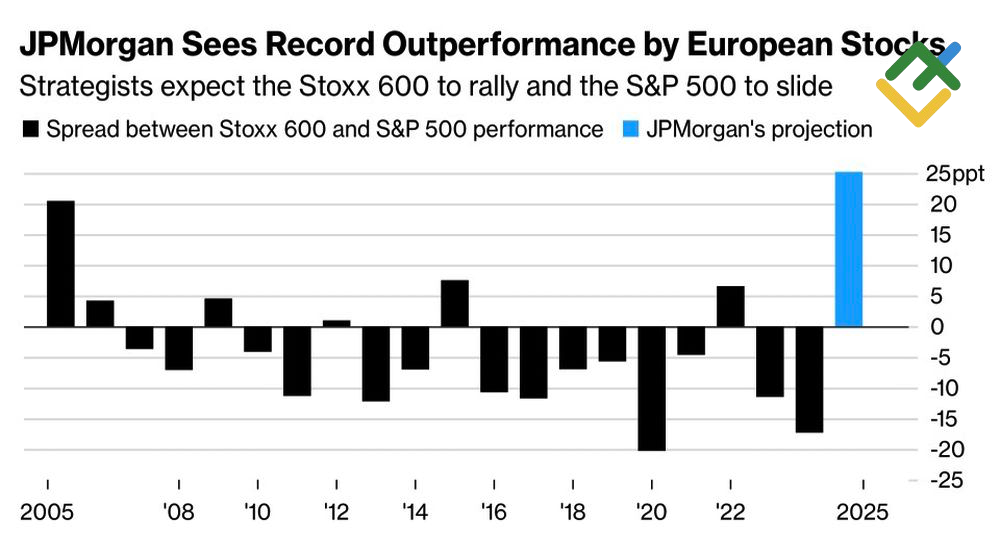
Source: Bloomberg.
Despite the fact that the EuroStoxx 600 rally raised its price-to-forward earnings ratio to 14.6, compared with a 20-year average of 13.5, the P/E ratio for the S&P 500 is almost 22. European stocks are still cheap compared to US stocks, and the flow of capital from North America to Europe continues.
P/E Ratio of US and EU Stock Indices
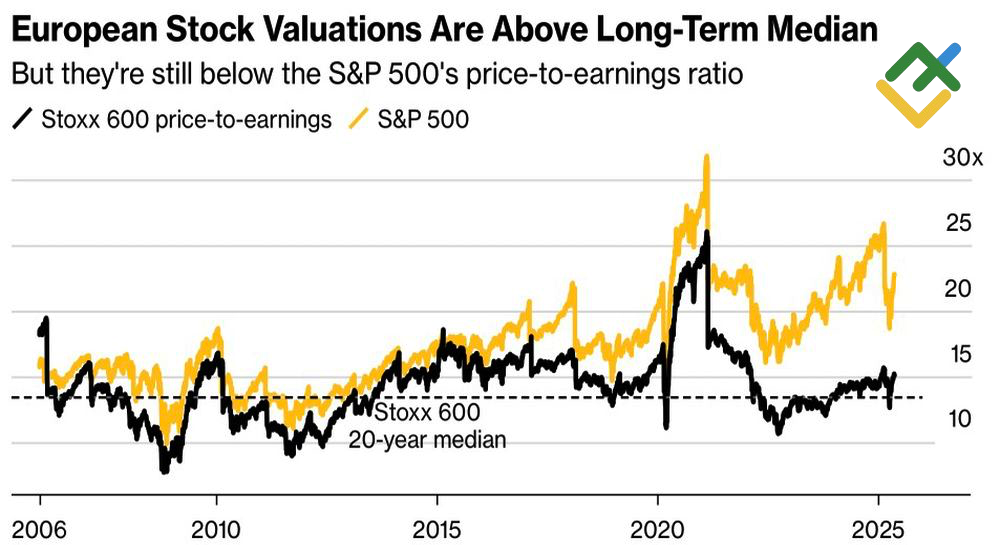
Source: Bloomberg.
The European Bank for Reconstruction and Development (EBRD) predicts that the impact of the trade war will be particularly significant for export-oriented Germany, leading to a slowdown in GDP growth to 3% in EBRD countries by 2025. However, German fiscal stimulus packages are expected to revive the economy and boost growth to 3.4% in 2026.
The European Commission has revised its GDP growth forecast for the eurozone, lowering it to 0.9% for the current year. This figure is still better than the 0.4% forecast for 2024. The recent downward revision of inflation estimates to 2% in 2025 and 1.7% in 2026 has provided a much-needed respite for EuroStoxx 50 bulls. According to Goldman Sachs, there is a close link between lower consumer prices and high price-to-earnings (P/E) ratios. It is believed that the main reason is expectations of ECB rate cuts, which are viewed as positive for stocks. Even Klaas Knot, a hawkish figure within the Governing Council and the president of the Dutch central bank, does not rule out a continuation of the monetary policy easing cycle.
Quarterly EuroStoxx 50 Trading Plan
Fiscal and monetary stimulus will support the German and eurozone economies, which, combined with moderately low fundamental valuations of European stocks, drive capital flows from North America to Europe. Against this backdrop, one can consider purchasing the EuroStoxx 50 with targets at 5,630 and 5,830. The primary risks are a large-scale trade war between Washington and Brussels. However, the stock index’s decline can be used to establish long trades.
This forecast is based on the analysis of fundamental factors, including official statements from financial institutions and regulators, various geopolitical and economic developments, and statistical data. Historical market data are also considered.
Price chart of SX5E in real time mode

The content of this article reflects the author’s opinion and does not necessarily reflect the official position of LiteFinance broker. The material published on this page is provided for informational purposes only and should not be considered as the provision of investment advice for the purposes of Directive 2014/65/EU.
According to copyright law, this article is considered intellectual property, which includes a prohibition on copying and distributing it without consent.
{{value}} ( {{count}} {{title}} )
This post is originally published on LITEFINANCE.