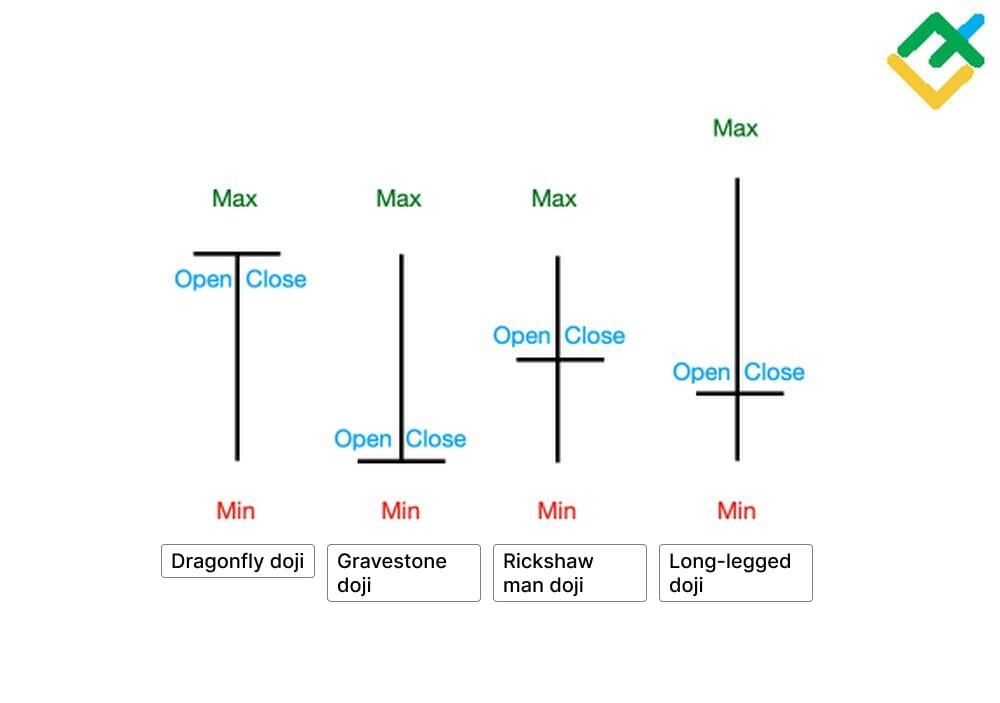
When trading in financial markets, you can often encounter different types of Japanese doji candlesticks, such as a “Long-legged doji,” a “Riсkshaw man doji,” a “Doji after a long white candle,” “Doji stars,” a “Harami cross” pattern with “Doji” inside, and a “Gravestone doji.”
In most cases, a “Doji” pattern indicates uncertainty when the market is indecisive after an extended uptrend or downtrend. The importance of “Doji” pattern types is very high, as they determine the market reversal in advance.
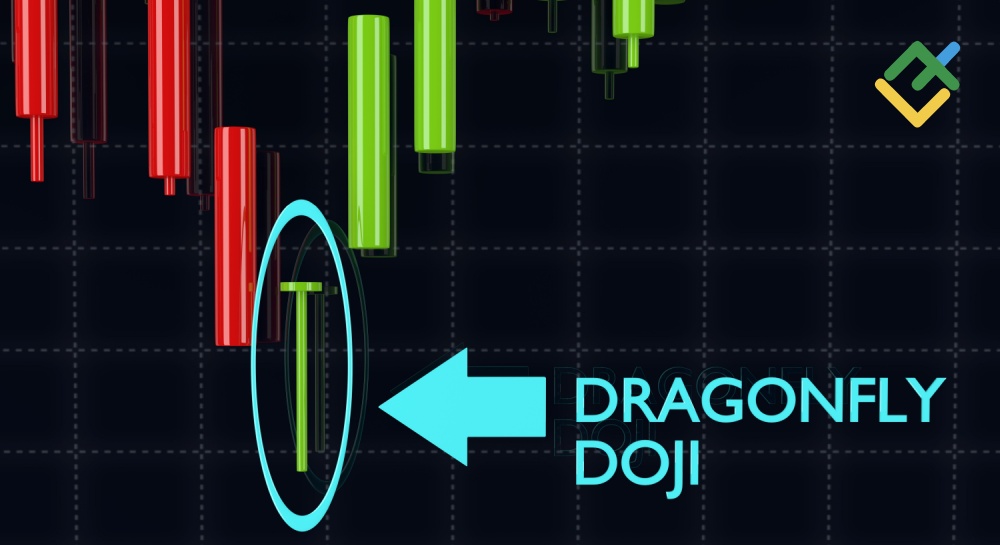
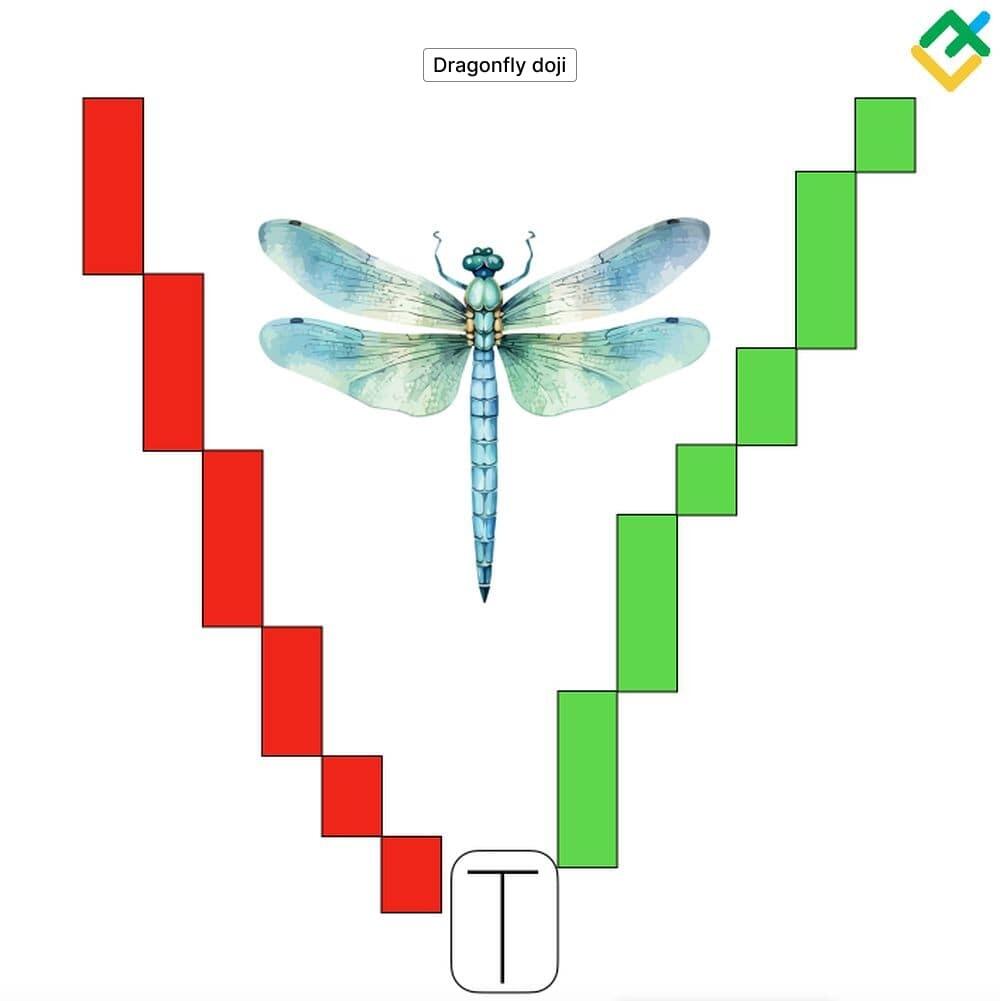
A “Dragonfly doji” is another “Doji” pattern type with an interesting name, which has either no or a very small candlestick body. In addition, the pattern has no upper shadow, but its lower shadow is long.
What does the pattern indicate on the chart? When does the pattern have more significance? This article describes in detail all the features of a “Dragonfly doji” candlestick and the key points that should be considered when trading with this pattern.
The article covers the following subjects:
Key Takeaways
|
Main thesis |
Insights and key points |
|
Definition |
A “Dragonfly doji” is a Japanese candlestick pattern that signals a potential trend reversal. A classic pattern has the same opening and closing price with no upper candlestick shadow (wick), but there may be a slight difference between the prices. |
|
Influence on the market |
The pattern is especially influential after a long downtrend in the market. The formation of this pattern at the bottom of a downtrend gives a strong signal for a price reversal upwards. |
|
Pattern features |
Although the pattern is bullish, its formation on highs can be considered as its distinctive feature. The emergence of the pattern after a long uptrend warns traders about the weakening of bulls and a potential price decline. |
|
What does the pattern indicate? |
The lower shadow of the “Dragonfly doji” candlestick pattern indicates aggressive sales in the market during candle formation. However, the quotes recover and close at the opening level. |
|
The pros and cons |
Although a “Dragonfly doji” is rare, it is easily identified on the trading instrument’s chart. In addition, a “Dragonfly doji” candlestick has relatively simple trading conditions. Traders should open a position after the formation of the candlestick and set a stop-loss order slightly below the price low. Along with this, a “Dragonfly doji” pattern has a number of disadvantages:
|
|
Identifying the pattern on a chart |
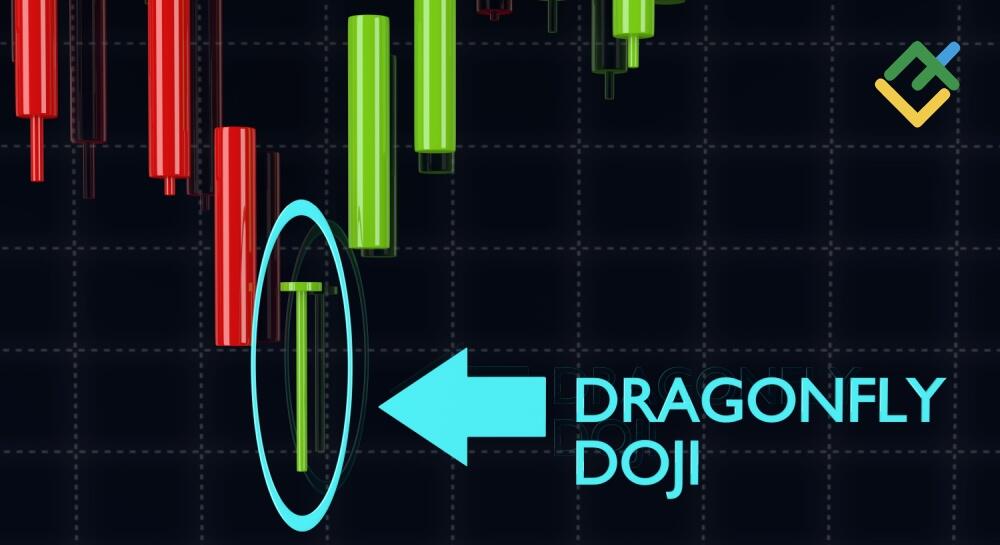
A “Dragonfly doji” pattern is easy to identify on the chart, as it forms a large letter “T.” The doji candlestick has a long lower wick, while the upper wick is absent or very short. The candle’s body can also be small, but traditionally, the closing price of the period should coincide with the opening price. |
|
Trading a “Dragonfly doji” pattern in various financial markets |
The “Dragonfly doji” pattern is applicable for trading in absolutely any financial market, such as the Forex, stock, cryptocurrency, and commodity markets. |
|
Trading strategies |
You can use the pattern in various trading strategies:
|
|
Time frames |
When trading a “Dragonfly doji” candlestick pattern, you can use any timeframe, depending on the strategy. However, the pattern gives more reliable signals on a daily time frame or higher. |
|
Stop-loss levels |
You should set a stop-loss order below the candlestick low or the nearest support level when trading a “Dragonfly doji.” |
What Is a Dragonfly Doji Candlestick?
The “Dragonfly doji” pattern is a Japanese candlestick pattern that is formed at the bottom of a downtrend or the top of an uptrend, signaling a trend reversal.
However, the pattern gives stronger bullish reversal signals at the bottom because, in most cases, it is a bullish candlestick pattern. A classic “Dragonfly doji” has the same opening and closing price, which makes it quite rare. Nevertheless, there may be situations when the prices do not coincide, and a “Dragonfly candle” has a small body and an upper wick.
The pattern is popular due to its belonging to the large “Doji” pattern family. A “Dragonfly doji” is crucial for traders, as it signals indecision in the market and forms before a trend reversal, allowing traders to anticipate further trading instrument movements and open positions at more favorable prices, reducing risks.
What Does a Dragonfly Doji Look Like?
A “Dragonfly doji” pattern has a T-shaped structure resembling a dragonfly. The unfolding of this pattern on the price chart demonstrates the growing strength of one of the two market forces: bulls or bears.
The pattern formation at the end of the downtrend indicates that the initiative is in the hands of bulls, so a market reversal and intensive price growth should be expected. The formation of a pattern at the end of an uptrend, on the contrary, signals that bulls are weakening and the initiative is in the hands of bears.
However, a “Dragonfly doji” candlestick can also emerge in the middle of a trend, for example, when the asset consolidates in a sideways channel before going further.
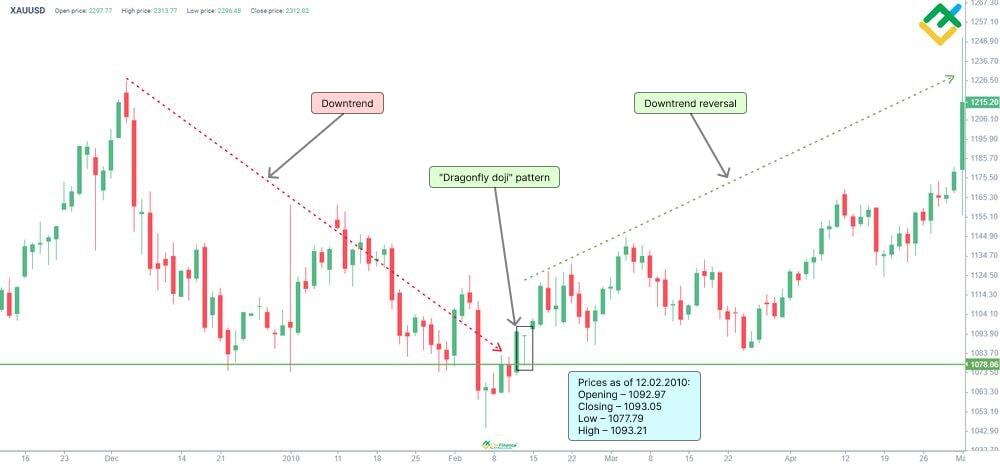
An example of a “Dragonfly doji” pattern is shown below on the daily chart of XAUUSD.
How Does a Dragonfly Doji Form?
The pattern formation on the chart:
-
The first step is to determine the support and resistance levels on the chart. These are key lines, as corrections or trend reversals usually occur at these levels.
-
Look for a candlestick with a small or missing body near key levels. Opening and closing prices should be approximately the same, ideally coinciding.
-
The next thing to pay attention to is the shadows. The pattern has a long lower shadow, and the upper shadow should be absent. However, this happens rarely, so it is allowed when the candle has a small wick at the top.
-
Focus on the lower shadow of a “Dragonfly doji” candlestick. The longer the shadow, the stronger the signal for a trend reversal or correction.
-
As a final step, confirm the pattern on the chart using other candlestick patterns or technical indicators.
Let us analyze a “Dragonfly doji” pattern formation on the 4-hour time frame of the EURUSD currency pair.
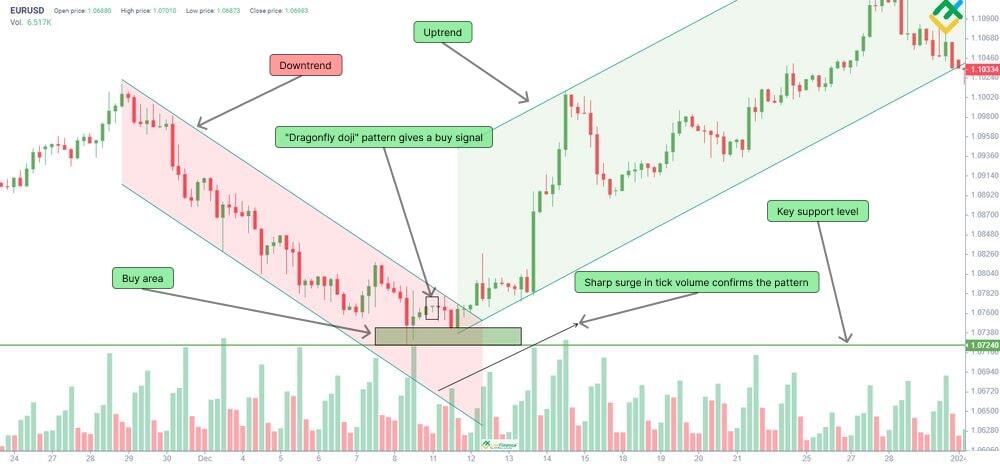
Before the formation of the “Dragonfly doji” pattern, one can identify a downtrend on the price chart. When the price reached the key support level at 1.0724, the decline stopped, and the quotes started to consolidate, forming a bullish “Dragonfly doji” pattern. However, after its construction, the price has slightly declined, which once again confirms the need to get additional confirmation signals. In this situation, the candlestick pattern was confirmed by the intensive growth of tick volume, after which the price finally reversed upwards.
What Does a Dragonfly Doji Candlestick Tell?
After a downward trend, the pattern indicates an increase in buying activity, while after an uptrend, it suggests an increase in sales. The rarity of this Japanese candlestick makes it very important for traders, as it warns about a trend reversal.
The long lower shadow suggests that bears dropped the price at the beginning of the period, but bulls recovered it during the trading session.
It should be noted that, unlike a “Dragonfly doji” pattern, other types of “Dojis” form on the charts much more often and, in most cases, signal market uncertainty or give strong signals of reversal at the highs.
Particularly important is the “Dragonfly doji” pattern formation in the middle of an uptrend, when it seems that the trend is reversing, but after the pattern construction, the price goes further upwards.
The lower wick of the pattern indicates that bears temporarily dominated the market. Although the price closed without much change, bulls managed to recover their positions, and the price may grow further.
Fundamental factors can escalate the situation. The release of statistics or news on a trading instrument can spoil a trader or investor’s trading plan due to market uncertainty and elevated volatility.
Therefore, it is important to analyze not only a “Gravestone doji” candlestick but also an asset’s current situation. This will help to get a more objective picture. When trading in financial markets, it is important to get signals comprehensively and monitor other candlestick or chart patterns and technical indicators.
How to Trade the Dragonfly Doji Candlestick Pattern
A “Dragonfly doji” candlestick is an effective pattern for trading. Its construction strengthens the signal for a trend reversal or, at least, a correction. Therefore, one should use the Japanese candlestick with other technical indicators and candlestick patterns. This allows one to increase efficiency, examine the market more accurately, and get strong signals to open a position. Let us analyze the pattern in different market situations.
Trading at the Top of an Uptrend
Trading the pattern on highs implies opening short trades when building a “Dragonfly doji”. Let’s look at the example of AT&T Inc shares.
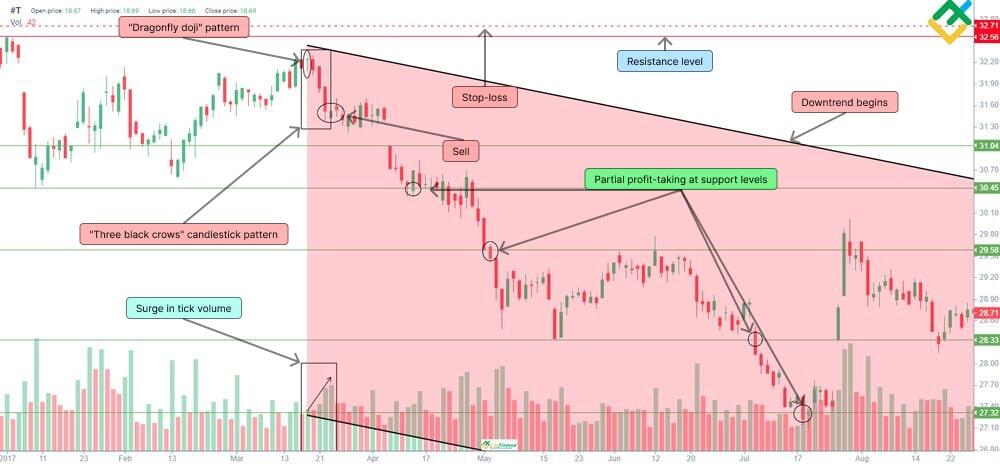
The hourly chart above shows how the price consolidates at the swing high near 32.56, forming a “Dragonfly doji” candlestick pattern. It should be emphasized that after building a bearish candlestick, the price started declining, creating a “Three black crows” pattern, which confirmed the “Dragonfly doji.” This is the beginning of a bearish trend.
Besides, a sharp spike in tick volume is seen during the construction of a “Three black crows” pattern, which emphasizes that large sellers are acting in the market. In fact, the bearish “Dragonfly doji” pattern was confirmed twice, allowing us to make informed trading decisions.
In this case, it is better to open short trades after a “Three black crows” pattern is completed. Profit can be taken at the nearest support level and at several lines in parts.
According to the pattern rules, a stop-loss order can be set above the “Dragonfly doji” pattern’s high. However, it is better to place the order below the resistance level, behind the 32.56 level at 32.71. This will reduce the risk of prematurely closing trades if the price does not drop immediately and tries to test the resistance again.
Trading at the Bottom of a Downtrend
This trading method involves identifying a “Dragonfly doji” pattern after a downtrend and opening buy orders. An example of such trading is presented below on the 4-hour BTCUSD chart.
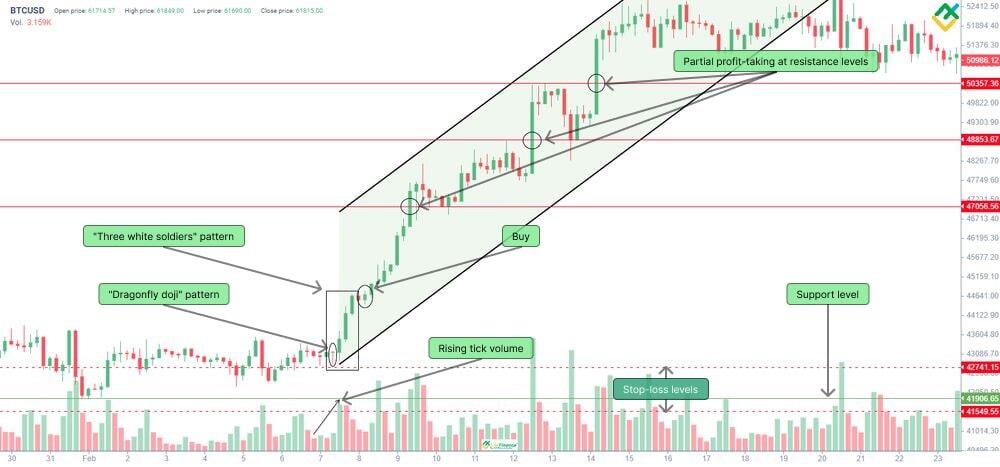
After BTC consolidated in a narrow range, the asset formed a “Dragonfly doji” pattern. The quotes began to grow actively on increased volumes, forming a “Three white soldiers,” a bullish reversal and continuation pattern.
As can be seen, a “Dragonfly doji” candlestick gave the market a powerful impulse, and subsequently, the bitcoin price increased by more than $10,000 in a relatively short period. Trading conditions for this strategy are similar to those for the previous strategy, but with one difference: everything is done in reverse.
In this case, one can open long trades after the formation of a “Three white soldiers” pattern, which confirmed a “Dragonfly doji” candlestick and the growing buying activity in the market.
As in the example above, the stop-loss could be set below the “Dragonfly doji” pattern at 42741.15. A conservative but more profitable option suggests setting it below the support line at 41549.55.
You may also take profit in parts when the price reaches new resistance levels. It should be emphasized that after hitting the first target, it is necessary to take at least 50% of the trade value. This will allow you to get at least zero if the trend reverses downward.
Dragonfly Doji vs. Gravestone Doji
A “Gravestone doji” pattern is opposite to the “Dragonfly Doji” candlestick. A “Gravestone doji” often occurs at the highs after a long uptrend, signaling a trend reversal to a downtrend.
In the case of a “Gravestone doji,” the opening price also equals the closing price.
The primary distinction between a “Gravestone doji” and a “Dragonfly doji” price pattern lies in the length and position of their shadows. The “Gravestone doji” is characterized by a long shadow at the top and an absence of a shadow at the bottom, resembling an inverted letter “T”.
A “Gravestone doji” pattern can also be formed after a downward trend. In this case, it is similar to a “Dragonfly doji” candlestick. If a “Gravestone doji” pattern forms at the bottom, it also warns traders about the weakening of sellers’ activity and the upcoming trend reversal to a downtrend. However, the strongest signal of this pattern is at the top.

Pros and Cons of the Dragonfly Doji
Like many other candlestick analysis patterns, a “Dragonfly doji” candlestick pattern has advantages and disadvantages.
|
Pros |
Cons |
|
A “Dragonfly doji” pattern gives a strong signal for a price reversal both at the trade’s bottom and top. |
The pattern can produce false signals. |
|
Although the pattern is rare, the “Dragonfly doji” candlestick is easy to identify on various time frames. |
A classic pattern rarely forms on charts. |
|
The pattern trading conditions are quite simple. |
If volatility is low, the pattern may not work. |
|
A stop-loss on the “Dragonfly doji” pattern can be placed below the candle’s low, which helps minimize risks and maximize potential profits. |
The “Dragonfly doji” pattern requires additional confirmation by other analysis tools and candlestick/chart patterns. |
|
A sharp increase in volumes during the formation of the “Dragonfly doji” pattern strengthens the reversal signal. |
Conclusion
A “Dragonfly doji” is an effective candlestick analysis pattern, which signals a trend reversal in the market. It is very effective when occurring near strong support and resistance levels.
One of the pattern’s advantages is that it forms in different financial markets and on various time frames. This, in turn, increases the possibilities of trading the pattern without being tied to specific trading instruments.
The candlestick pattern is most effectively combined with other candlestick patterns or chart analysis patterns. Besides, it is convenient to confirm the pattern with the help of various technical indicators, which increases the probability of making the right trading decision and making a profit.
You can check the efficiency of a “Dragonfly doji” candlestick pattern by opening a free demo account with LiteFinance. The multifunctional web terminal offers a wide array of trading tools that will allow you to build your trading strategy correctly and avoid losses.
Dragonfly Doji Candlestick FAQs
A “Dragonfly doji” is a candlestick analysis pattern, which signals a trend reversal in the market, warning traders about the weakening potential of one side of the market participants. The pattern is formed in the form of the letter “T”.
The “Dragonfly doji” candlestick is a highly efficient and strong harbinger of a price reversal. However, like other patterns, it should be confirmed by other patterns and indicators. The accuracy of the “Dragonfly doji” candlestick depends on market conditions and its position on the chart. The pattern gives a stronger reversal signal when emerging in the area of support/resistance levels.
The efficiency and effectiveness of the pattern increases depending on the time frame on which the pattern was built. On higher time frames, the pattern gives clearer and more reliable signals for making trading decisions.
Having identified the pattern on the candlestick chart, it is necessary to monitor trading volumes and get confirmation of the pattern by other price formations. Once the pattern is confirmed, it is necessary to open a long or short position, placing a stop-loss order behind the “Dragonfly doji” candlestick’s low. The target is the nearest support or resistance level.
The pattern can signal both the impending growth and the imminent fall of the asset price. If the pattern is formed at the top after an upward trend, it signals an upcoming change of trend to a downtrend. If the pattern appears at the bottom after a downward trend, it signals the imminent change of the trend to an uptrend.
A “Gravestone doji” is the opposite to the “Dragonfly doji” pattern. The former predicts a trend reversal at the uptrend’s top.
The difference is that the “Dragonfly doji” has a long lower wick, while the “Gravestone doji,” on the contrary, has a long upper wick. In other respects, they are similar.
Unlike a pin bar, the “Dragonfly doji” candlestick does not have a body. As a rule, a pin bar has a long lower or upper wick and a short body with different opening and closing prices. In addition, the candlestick can be either bullish or bearish.
A “Hammer” reversal candlestick pattern represents the same type of a reversal pattern as a pin bar. Therefore, the difference between the “Dragonfly doji” pattern and the “Hammer” pattern is similar: the “Doji” pattern has no body, while the “Hammer” pattern has a small body. Both patterns signal a trend reversal.
The content of this article reflects the author’s opinion and does not necessarily reflect the official position of LiteFinance. The material published on this page is provided for informational purposes only and should not be considered as the provision of investment advice for the purposes of Directive 2004/39/EC.
{{value}} ( {{count}} {{title}} )
This post is originally published on LITEFINANCE.