Trading using technical analysis patterns most often involves studying recurring price behaviors on the charts, including identifying various patterns. Today, traders use a wide range of chart patterns, some of which are rare but can be particularly advantageous.
A Bullish Diamond and a Bearish Diamond are among such patterns, typically appearing on higher time frames. Trading these patterns can often yield profits exceeding 10%–15% of a trader’s deposit. This article explores how to utilize these patterns effectively.
The article covers the following subjects:
Major Takeaways
|
What is a Diamond pattern? |
A Diamond is a chart pattern that emerges on a price chart after a prolonged bullish or bearish trend. |
|
What is the difference between a Bullish Diamond and a Bearish Diamond? |
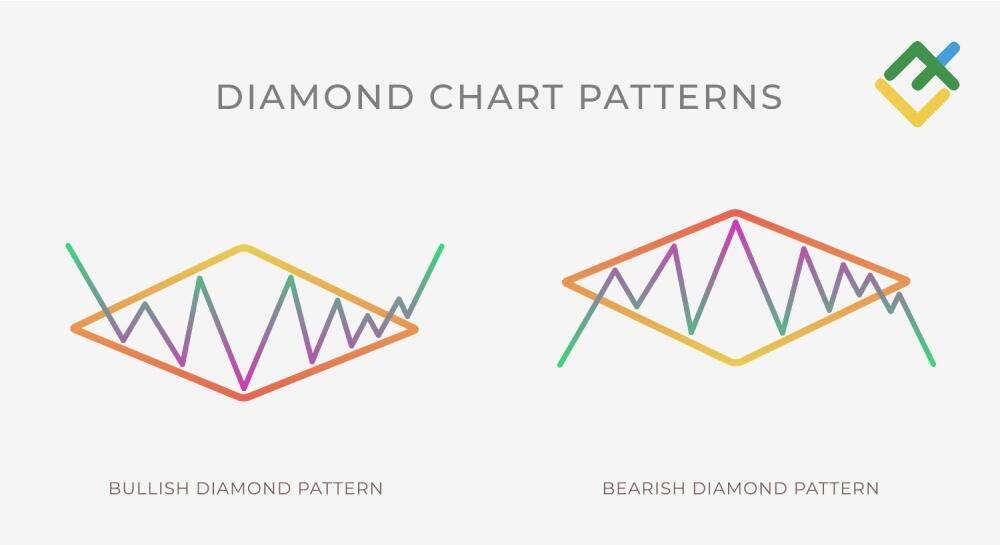
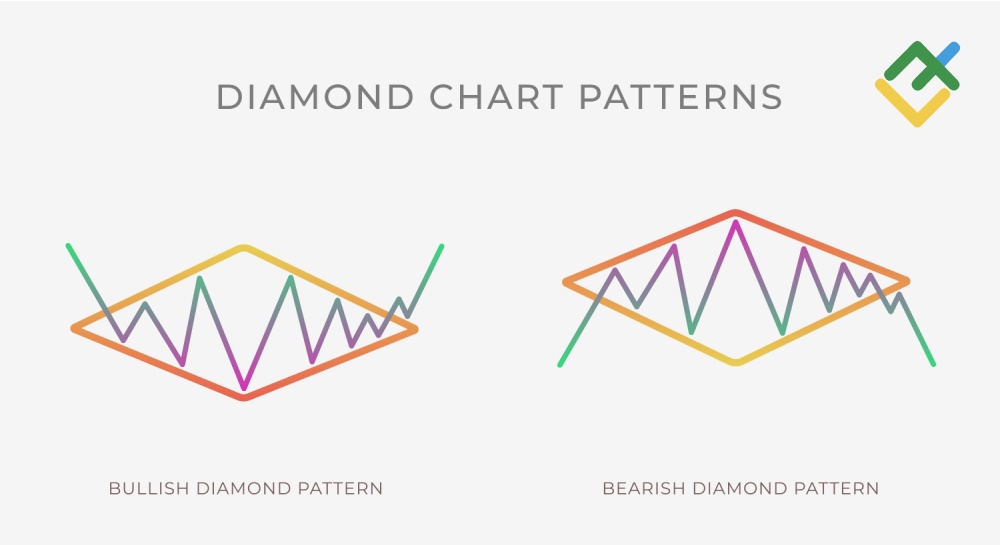
A Bearish Diamond pattern, also called a Diamond Top, appears after an uptrend in a rising market, while a Bullish Diamond pattern, a Diamond Bottom, appears at lows after a decline. |
|
How does the pattern influence the Forex market? |
A Diamond is a reversal pattern that occurs at the end of an existing trend and signals its change. |
|
How does the pattern work? |
A trader should set a pending order at the low or high level (depending on a trend) preceding a trendline breakout point. Once the order is triggered, the trade will be executed. |
|
How to identify the pattern on a chart? |
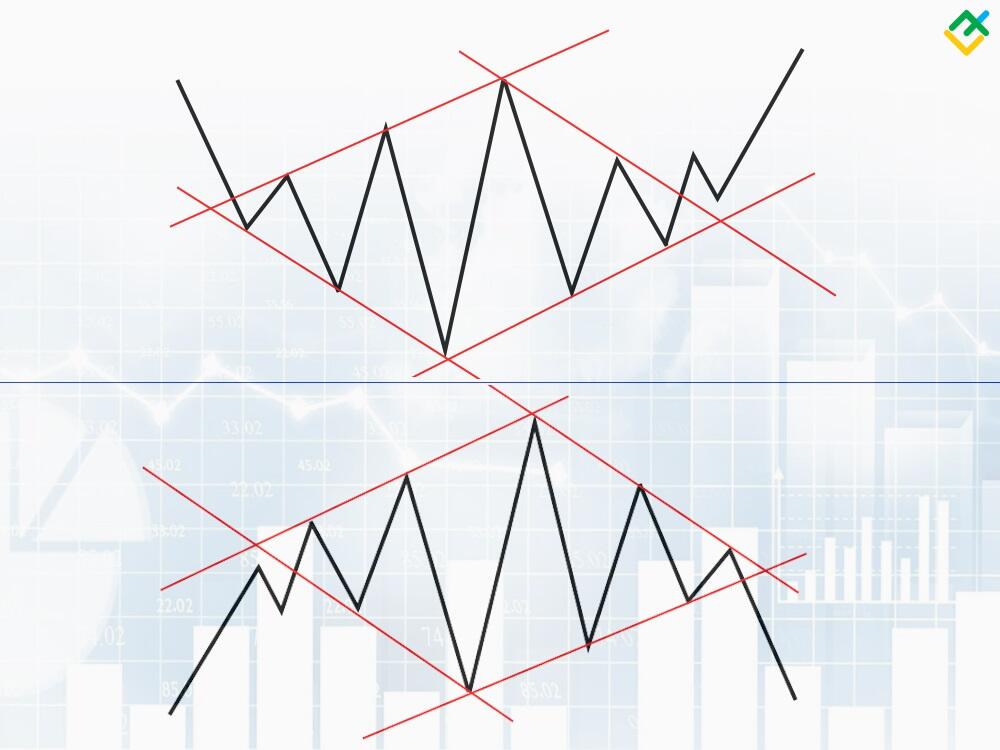
A Diamond chart pattern consists of a sequence of triangles that alternately diverge and converge, featuring a distinct low and high, forming a diamond shape on the chart. |
|
Pattern features |
A Diamond chart pattern is frequently mistaken for a Head and Shoulders pattern. However, there is no need to worry about confusing the two, as they function similarly. |
|
Diamond pattern advantages |
The advantages include its straightforward and clear structure that can be found across various time frames, along with distinct stop order levels. |
|
Diamond pattern disadvantages |
Among the disadvantages is a high probability of a false breakout. Besides, the pattern is often transformed into a long channel with limited stop-loss size. |
|
Suitable time frames |
A Diamond chart pattern works on any time frame. However, like many patterns, it tends to be more effective on higher time frames. |
|
Stop order levels |
Stop levels can be set at any time and are typically aligned with the pattern’s highs and lows. |
What is the Diamond Chart Pattern?
A Diamond is a reversal pattern in technical analysis, occurring at the tops of an uptrend and the lows of a downtrend, signaling an imminent reversal. The reliability of a Diamond pattern signal is relatively high.
A Diamond chart pattern represents a struggle between buyers and sellers. Initially, this struggle intensifies, only to gradually subside in the final phase. Ultimately, the formation of this pattern, resembling a diamond shape, on the chart signals a decisive victory for one side, leading to a reversal of the prevailing trend. In classical chart analysis, a Diamond pattern emerges from two consecutive patterns, resembling an Ascending Triangle that transitions into a Descending Triangle.
Key Characteristics of the Diamond Pattern
The Diamond pattern is a reversal pattern which is rather uncommon. You need to follow a number of rules to identify it correctly on a chart.
-
A pattern can be of two types. A Bullish Diamond is a pattern that occurs at trend lows and signals an upward reversal. Conversely, a Bearish Diamond appears at the highs of a trend and signals a bearish reversal.
-
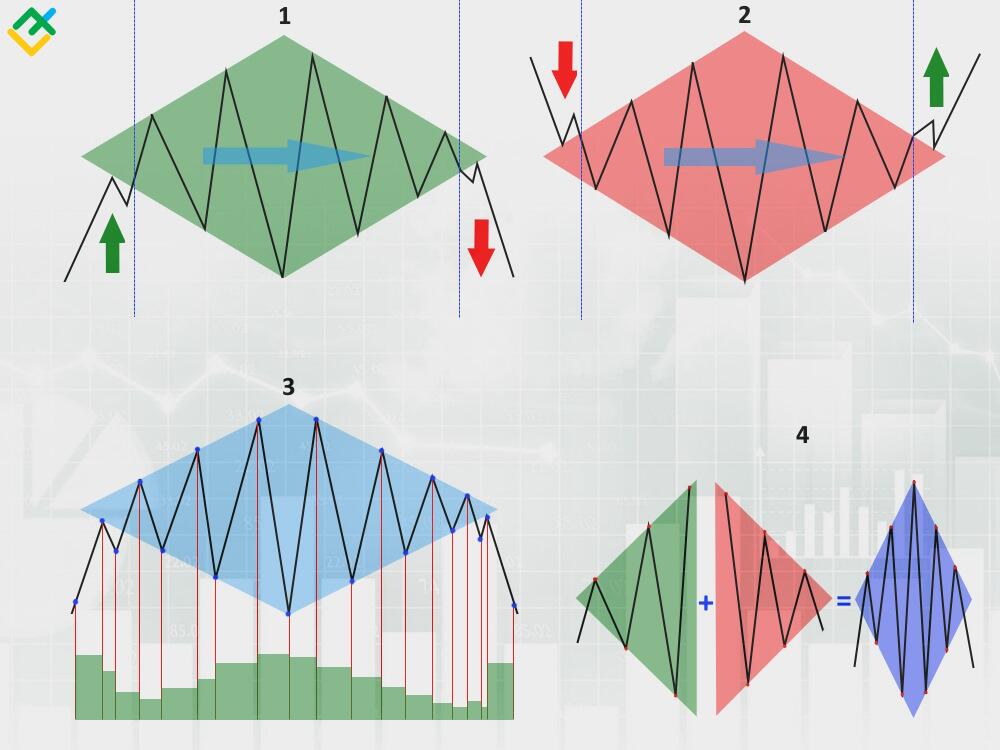
The pattern unfolds in three distinct phases. The first phase marks the entry into the pattern. The second phase represents the formation of the pattern itself, reflecting the ongoing battle between buyers and sellers. The third phase is the breakout from the Diamond pattern, which may occur with or without confirmation.
-
The pattern forms over a long period of time. This pattern is applied to any time frame, but the most accurate and effective patterns occur on daily charts and take several months to complete.
-
Trading volume behavior. The trading volume is consistently high at the beginning of a Diamond pattern development. Nevertheless, when the first wave of price fluctuations begins, the volume decreases until the key high and low of the Diamond are established. Their formation is accompanied by a surge in volume, which then declines again. The final volume spike occurs when the pattern completes and the trend changes.
-
Symmetry between two parts of the pattern. The pattern resembles diverging and converging triangles. The more symmetrical they are, the more reliable the signal for exiting the pattern will be. Essentially, symmetry is often the main indicator of the pattern on the price chart.
Types of Diamond Patterns
Similar to other trend reversal patterns, a Diamond formation comes in two variations: bearish and bullish. Essentially, they represent the same pattern, with the key difference being whether a short or long trade will yield profits after a breakout.
Bearish Diamond Pattern (Diamond Top)
The Bearish Diamond, also known as the Diamond Top pattern, is a technical analysis downward reversal pattern formed at the top of a trend. Technically, this bearish pattern reveals the struggle of the remaining buyers in the market and sellers increasingly gaining control.
In order to correctly identify this chart pattern in trading, it is essential to wait until the Diamond Top pattern forms. In the first phase, it will look like a Diverging Triangle or Broadening Formation, which transitions into a Converging Triangle. As the second phase of the formation resembles a Symmetrical Triangle, the principle of placing orders is similar.
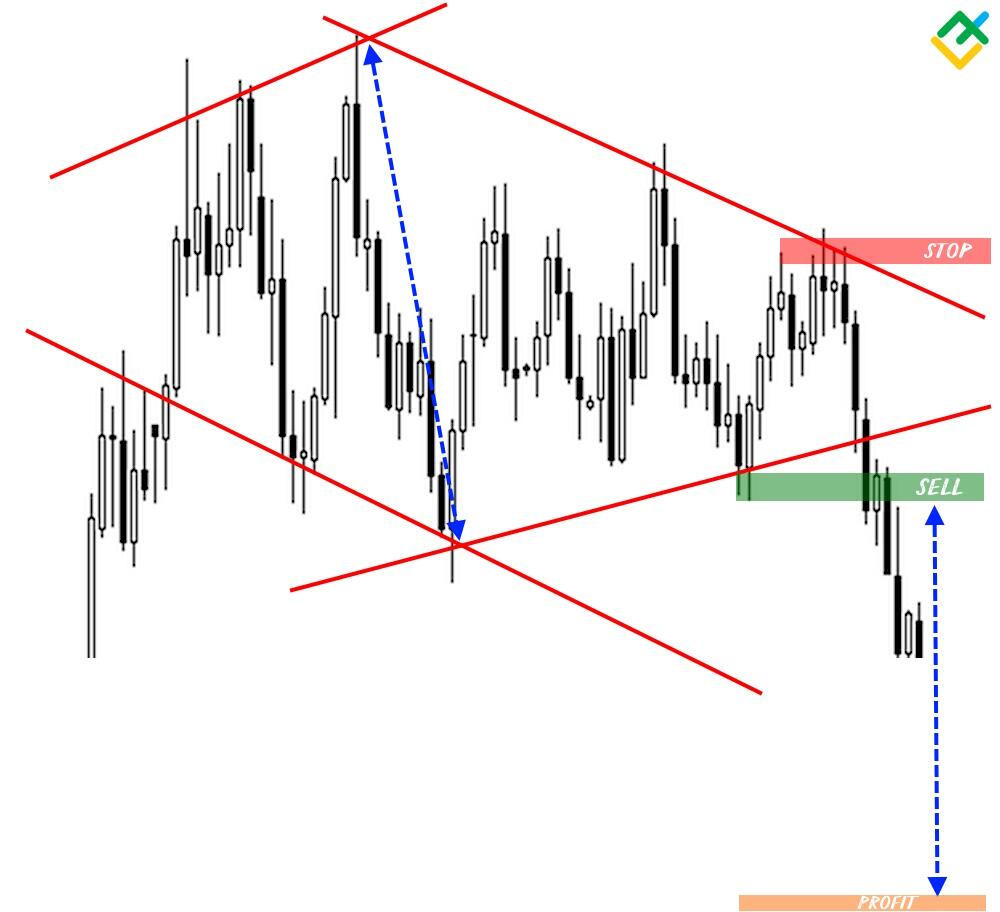
Breakout of the sloping support line is the main signal to open a short trade.
-
Firstly, you need to measure the distance in pips between the pattern’s high and low, the height of the Diamond, and project this distance from the breakout point to set your potential price target.
-
Secondly, identify potential entry points. If you use pending orders, the entry point will always be the level of the low within the pattern, which precedes the breakout point (as illustrated by the green horizontal bar on the screenshot). As new lows are established, the order simply moves higher.
-
Once the lower trendline of the Diamond Top formation is breached and the price hits the low preceding the breakout point, a short trade can be opened.
-
A take-profit order should be set at a distance equal to the range between the pattern’s high and low in pips.
-
A stop-loss order is placed at the pattern’s high (or slightly above) that preceded the support line breakout point.
Bullish Diamond Pattern (Diamond Bottom)
A Bullish Diamond, called a Diamond Bottom pattern, is a chart formation that signals an upward reversal occurring at swing lows. Technically, this bullish pattern reflects the combat between the remaining sellers and buyers, who are steadily gaining momentum in the market.
To accurately identify the chart pattern, you should wait for the formation of the low, which is called the bottom of a Diamond. Initially, the structure will resemble a diverging triangle or an expanding formation, but it will eventually transition into a converging triangle.
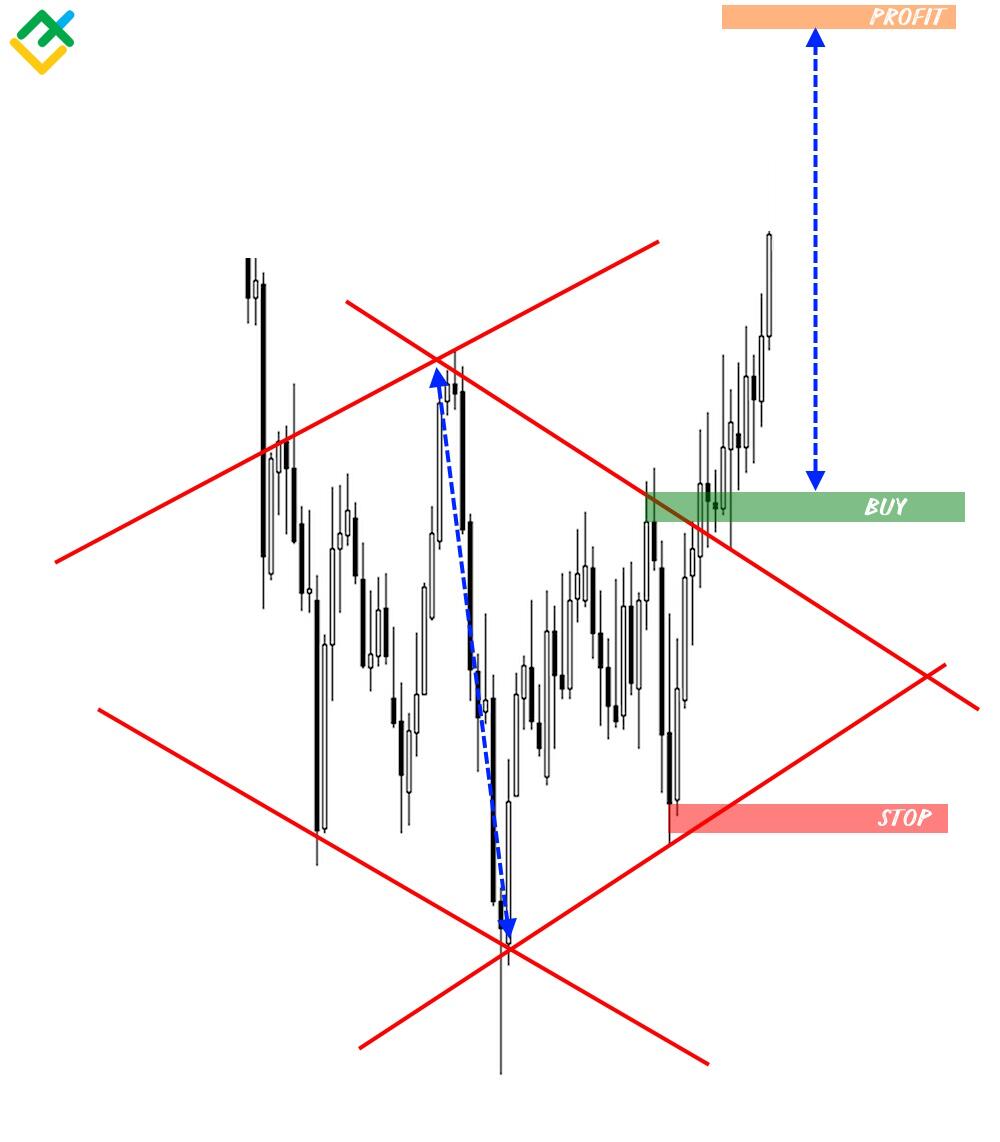
You can open a buy trade at the point when the price breaks through the descending resistance line.
-
Firstly, measure the distance between the pattern’s lowest and highest points, the height of the pattern, and project this distance from the breakout point to set your profit target.
-
Next, determine the entry point for a long trade. If you open positions using pending orders, the entry point will always be the highest level within the pattern, formed before the breakout of the resistance line (indicated by the green horizontal bar on the screenshot). As new highs emerge, the order simply moves lower.
-
Once the price pierces the resistance line and hits the high formed before the breakout, a short trade can be initiated.
-
A take-profit order should be set at a distance equal to the range between the pattern’s high and low.
-
A stop-loss order is placed at or just below the low that preceded the resistance breakout point.
How to Trade Diamond Patterns
A Diamond is a quite rare pattern in the market and is often confused with other reversal patterns. As a result, the order levels are set incorrectly, which can lead to losses. Thus, there are several basic strategies for trading Forex with this pattern.
Breakout Trading
The most popular and simple strategy for trading a Diamond pattern on Forex involves focusing on the trendlines’ breakout. If the pattern is bullish, the price breaches the resistance line, while in a bearish scenario, it pierces the support line.
Let’s take a closer look at this strategy.
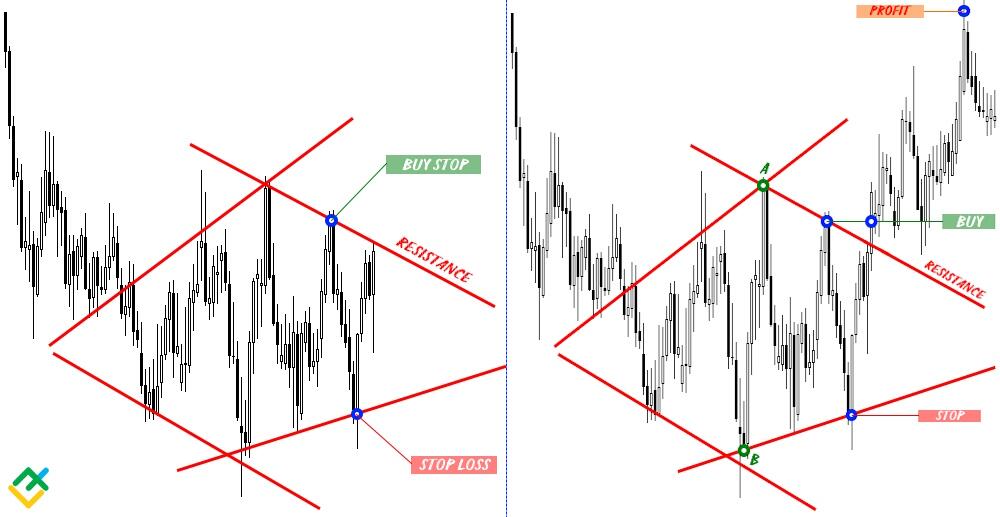
As the chart above shows, two orders are placed when the pattern is identified. A buy stop order will open a long position when the price breaks through the line, while a stop-loss order will close a losing trade in the event of a false breakout from the Diamond pattern. Since the breakout has not occurred yet, a buy stop order is placed at the level of the previous high. A stop loss is set near the recent low and remains inactive until the pending order is triggered.
When the resistance line is broken, wait for the price to hit the previous high or for a buy stop order to initiate a trade. Once it is triggered, a stop-loss order will also activate. At this point, you can set a take-profit order, which is equal to the distance between points A and B. Moreover, when the price exceeds point A, you can adjust your stop-loss order to the breakeven level and then activate a trailing stop.
Retracement and Reversal Trading
Another simple strategy for trading a Diamond pattern involves locking in profits after a breakout or using price retracement. If the pattern is bullish, the price should break through the resistance line and retrace downward. If the pattern is bearish, the price breaches the support line and retraces upward.
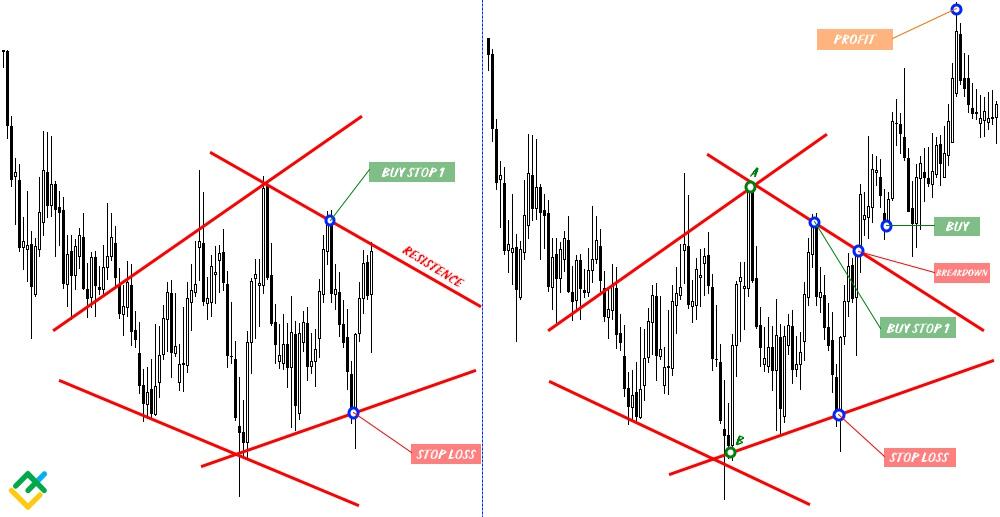
As illustrated above, once the pattern is identified, the levels of two orders should be determined. The buy stop 1 will indicate a possible buy order level when the line is breached. A stop-loss order will close a losing position in case of a false breakout. However, do not set the orders just yet. Since the breakout has not yet occurred, place a buy stop 1 at the level of the previous high and a stop-loss order at the level of the recent low.
Once the resistance line is crossed, wait until the price exceeds the previous high and retraces back. At the same time, place the buy stop 1 order at a predetermined point. When the price retreats and reaches the buy stop 1 level, a stop-loss order will be triggered, opening a long trade. Now, you can set a take-profit order, which is equal to the distance between points A and B. Additionally, when the price surpasses the point A level again, a stop-loss order can be shifted to the breakeven point, and a trailing stop can be activated.
When using this Diamond trading strategy, there is a possibility of missing a favorable moment to open a trade because the price retracement may not occur. However, you will not incur losses. Besides, the price may return back to the pattern during the retracement, which could increase the risk of triggering a stop-loss order.
Comparing Diamond Patterns to Head-and-Shoulders Patterns
A Diamond is a reversal pattern often compared to a Triangle or Head and Shoulders pattern.
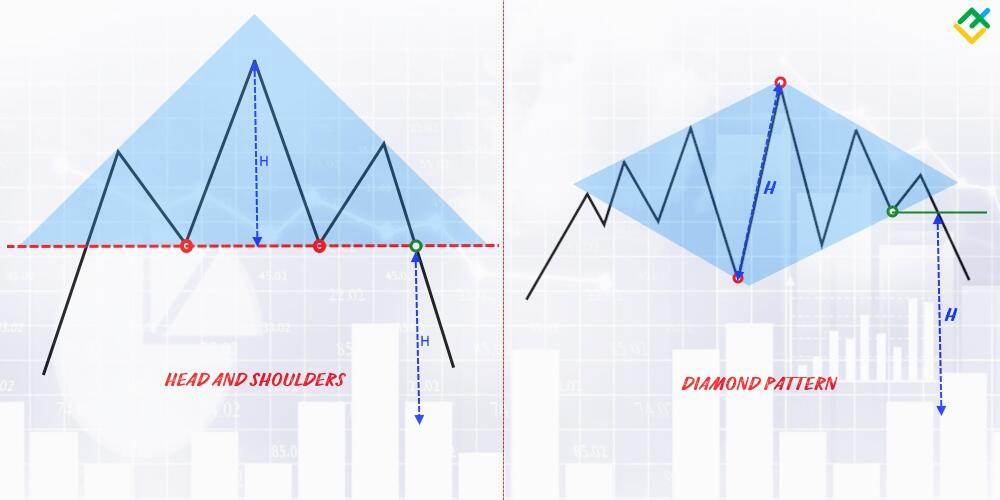
Actually, the resemblance between a Diamond and a Head and Shoulders pattern is not so obvious. The image above shows that a Diamond consists of two triangles combined into a single shape, while a Head and Shoulders pattern features one Ascending triangle.
A Head and Shoulders pattern consists of three peaks, with the central one being the highest and the other two at about the same level. Besides, a single line, known as the neckline, can be drawn across all the lows of the pattern.
In contrast to the Head and Shoulders, a Diamond has two pronounced low and high points and differs in its formation. Firstly, the price exceeds the previous high, but during the second stage, it gradually retreats from that high. Besides, it is impossible to draw a single line that connects all the lows or highs in the Diamond pattern on a chart.
Each pattern has its unique approach to giving entry signals. If the Head and Shoulders pattern’s signal involves a neckline breakout, a Bearish Diamond pattern breakout needs additional confirmation by the price hitting the previous low.
Using the Diamond Pattern with Other Technical Indicators
Like any other technical analysis pattern, a Diamond is most effective when used with other technical indicators, particularly those considering trading volumes or moving averages.
Awesome Oscillator
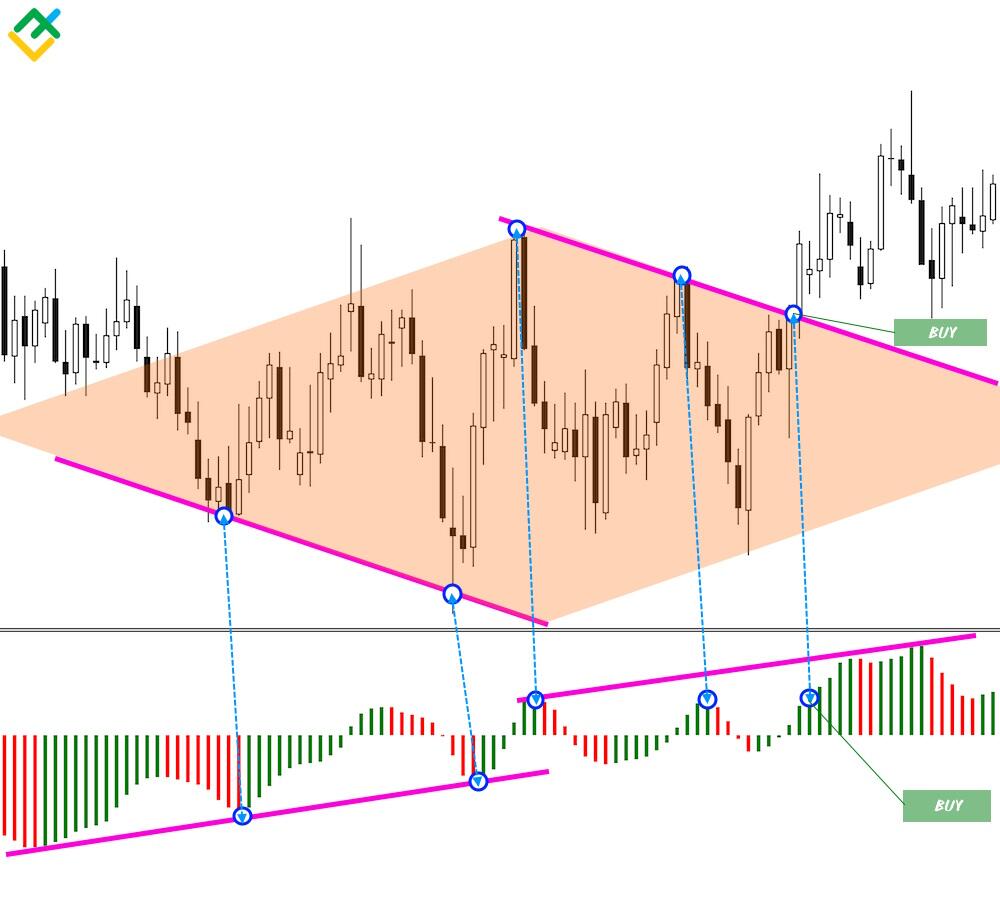
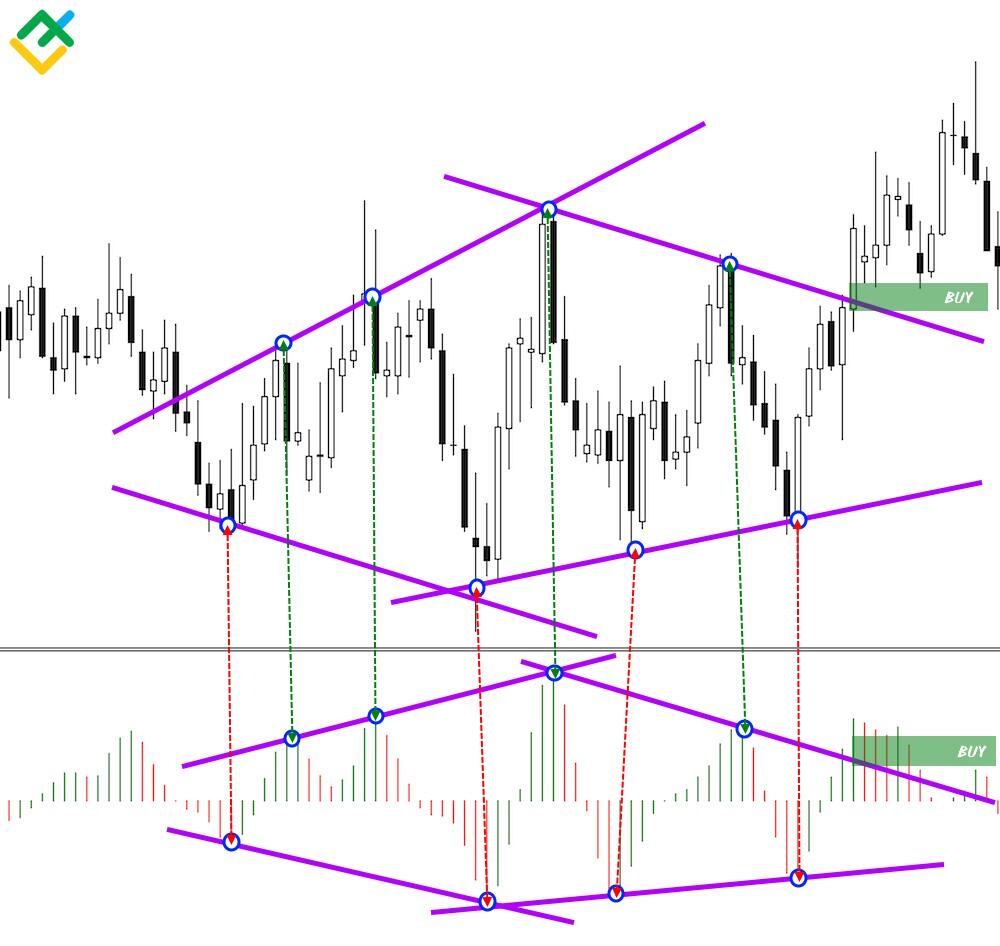
A Diamond pattern is effective when used in combination with the Bill Williams Awesome Oscillator.
This oscillator allows you to gauge trading activity in various assets. Heightened activity is indicated by higher-amplitude bars, and low activity, on the contrary, by shorter bars. By comparing the highs and lows on the market chart with the oscillator, you can track volume fluctuations. As the pattern develops, the amplitude gradually diminishes. If you draw lines through the lows in the first phase of the pattern, you might observe a convergence of the pattern’s lines. In the second phase, just before the pattern completes, the pattern’s lines diverge, forming the diamond shape. When the price pierces the resistance line, the indicator starts to form higher bars that exceed the size of bars within the pattern, signaling an opportunity to enter a trade.
Accelerator Oscillator
The second useful combination is trading the Diamond pattern with the Bill Williams Accelerator Oscillator.
This oscillator indicates the deceleration or acceleration of market strength. It works similarly to the Awesome Oscillator but shows changes in volume more accurately.
This indicator helps you easily spot the pattern on a price chart. If you draw the support and resistance lines across the pattern’s lows and highs and then the lines connecting the corresponding points on the indicator, you may see that the lines are identical. The indicator’s ability to showcase fluctuations in market forces is so precise that it effectively validates the pattern. Furthermore, when the price breaks through one of the pattern’s lines, the indicator will show an uptick in volume. If the volume does not increase during the breakout, it is considered to be false.
What are the Benefits of the Diamond Pattern
Diamond chart patterns are considered reliable reversal indicators. The pattern has several other advantages that distinguish it from other chart patterns.
-
The pattern indicates a trend reversal rather accurately. Since a Diamond pattern involves a significant drop in trading volume, it becomes relatively straightforward to spot a potential trend reversal during a breakout.
-
The signal to enter the market is often confirmed. Frequently, when one of the pattern’s boundaries is pierced, the price tends to retrace and retest it. This enhances the likelihood of the pattern providing a reliable signal.
-
Predetermined order levels. Like any other reversal pattern, a Diamond pattern has clear and straightforward levels of limit orders, which are linked to the highs and lows. This makes it accessible for even novice traders.
-
Price targets are often 100% reached. By the time a pattern low or high is hit, the price target is usually already 50% achieved, and the pattern is only halfway to full completion.
-
High trade execution probability. Compared to other reversal patterns, a Diamond boasts an 81% success rate, making it one of the most reliable and effective reversal formations.
-
Favorable risk/reward ratio. A Diamond pattern typically provides a profit-to-loss ratio of over 2:1 and often as high as 3:1.
-
Versatility. The pattern can appear on any time frame. Therefore, it provides a fairly high frequency of transactions. However, any pattern works better on a higher time frame.
-
The pattern is easily confirmed by volume indicators. It is easy to recognize the pattern on a price chart when using any trading activity indicator in your strategy.
Limitations and Pitfalls of the Diamond Pattern
Despite the distinct advantages, the pattern has a number of disadvantages, which can be mitigated if the following rules are followed.
-
Do not trade within the pattern, even if the pattern has appeared on a higher time frame. A Diamond pattern often transforms into a sideways channel, which can trigger stop orders too early.
-
Avoid entering a trade prematurely before confirming the final breakout of one of the pattern’s lines. Some traders tend to enter the market immediately when the line is breached. However, according to the trading rules, it is essential to wait until the price hits the previous low or high level.
-
The pattern cannot indicate the previous trend continuation, as it is a reversal pattern. Thus, if there was an uptrend, the pattern should signal a transition to bearish momentum.
-
A breakout from the pattern cannot occur on low trading volume. A breakout will always be supported by increased trading volume.
Possible pitfalls of a Diamond pattern.
-
The pattern may produce frequent false breakout signals. To avoid a false breakout, always wait until the price hits the previous low or high level after the key line breakout.
-
When trading the pattern on lower time frames, the size of a stop-loss order may be too small. Thus, the order may be triggered prematurely because of the market noise. To mitigate this risk, avoid trading the pattern if a potential loss is less than 300 pips.
Conclusion: The Diamond Pattern in Technical Analysis
Pattern trading is a favored approach among traders with limited capital. Patterns are easy to identify on the chart and have clear trading rules.
There are not many opportunities to trade the Diamond chart pattern as the pattern is rather uncommon. Nevertheless, if you learn to utilize it effectively, you can develop a comprehensive trading strategy. Follow a number of simple rules to make your trading even more effective. Firstly, focus on patterns that appear on the higher time frames. The pattern is the most reliable on the H4 and D1 time frames. Besides, waiting for the pattern to fully complete is not always necessary. If the price moves in the anticipated direction by more than 80%, it is better to close the trade manually.
Diamond Pattern FAQ
The Diamond pattern itself can be both bullish and bearish, depending on the market trend prevailing before its formation. When the pattern appears after an uptrend, it suggests a bearish reversal. Conversely, if it emerges following a downtrend, it signals a bullish reversal.
The most effective strategy for trading the Diamond pattern is during the trendline breakout. A trader needs to wait for a breakout of one of the pattern’s boundaries and open a trade once the signal is confirmed
Trading a Diamond pattern involves opening short or long trades, depending on the type of the pattern. If the Diamond pattern forms at the highs, one may open a short trade. Conversely, if the pattern occurs at the market lows, long trades can be initiated.
A Diamond chart pattern is a technical analysis tool that indicates a potential trend reversal. Traders can use this pattern to profit from a price drop or increase. The profit target is determined by the distance between the pattern’s high and low points. Besides, the probability of the pattern completing and giving a reliable signal is high.
The Diamond pattern formation in the stock market signifies a struggle between buyers and sellers, with no obvious advantage for anyone. When one of the sides leaves the market, the pattern starts to progress on the stock chart, accompanied by rising trading volume.
The content of this article reflects the author’s opinion and does not necessarily reflect the official position of LiteFinance. The material published on this page is provided for informational purposes only and should not be considered as the provision of investment advice for the purposes of Directive 2004/39/EC.
{{value}} ( {{count}} {{title}} )
This post is originally published on LITEFINANCE.

