The DAX 40 index has experienced significant growth, surpassing its March peak. This achievement can be attributed to the US-China agreement, the ECB’s monetary policy, Germany’s fiscal stimulus measures, and improved German macroeconomic statistics. What developments can we expect in the future? Let’s discuss this topic and make a trading plan.
The article covers the following subjects:
Major Takeaways
- Reduced tariffs between the US and China boosted stock markets.
- Capital outflows from the US to Europe benefit the DAX 40 index.
- The German stock index is buoyed by the ECB and the German chancellor.
- One can consider buying the DAX 40 with a target of 26,000.
Quarterly DAX 40 Fundamental Forecast
While the S&P 500 index is returning to levels seen at the beginning of the year, Germany’s DAX 40 has become the first major stock index to reach above its record highs. Europe is outperforming the US across the board, and even the “buy American” strategy will not deter investors from buying EU stocks.
Over the past decade, capital has moved in one direction from Europe to North America. The United States has shown consistent superiority in economic growth over the European Union, primarily due to higher productivity levels and a strong inclination to consume rather than save. The reasons for this are fiscal stimulus, a safe distance from military conflicts, and the absence of an energy crisis. The return of Donald Trump to the White House has had a significant impact on the industry.
The uncertainty surrounding the 47th US president’s policies has led to a shift in the perception of American exceptionalism. Investors recognized the risk associated with allocating all their capital to US assets. In light of these developments, the decision was made to pursue diversification, with a focus on affordable European stocks that presented a promising opportunity. As a result, the EuroStoxx 600 has outperformed the S&P 500 by 19 percentage points in US dollar terms since the beginning of the year.
EU and US Stock Indices Performance
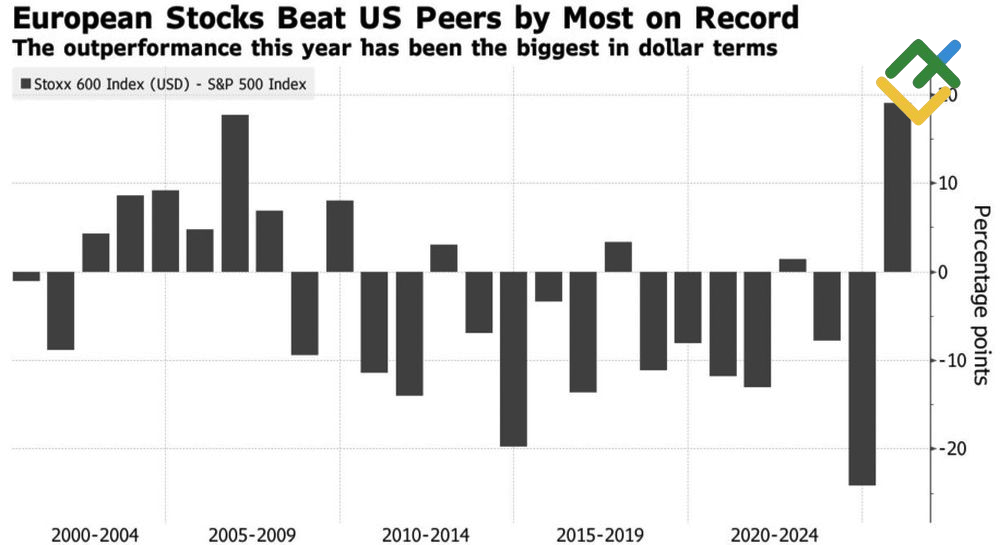
Source: Bloomberg.
The DAX 40 is showing particularly strong performance. Since January, it has increased by 18.6% and by 26% in dollar terms. The German stock index has reached a new record high, driven by the reduction in US import duties on Chinese goods from 145% to 30%. Its rally is not only based on portfolio diversification by US investors and European investors relocating capital to their home countries.
Germany’s adjustment of its fiscal brake rules marked the country’s transition from austerity to profligacy. It has the financial resources to make these investments, and its optimism about the future has contributed to the economy’s stability. In the first quarter, GDP expanded by 0.2% after two years of recession. Key economic indicators such as the manufacturing PMI, retail sales, and the business climate index are showing growth, exceeding initial forecasts.
When considering the ECB’s seven acts of monetary expansion and the likelihood of two or three more by the end of 2025, the DAX 40’s trajectory appears to be well-founded. The rally has led to increased costs. Its P/E ratio of 14 is higher than its European peers, although it is still significantly lower than the S&P 500’s 21.
P/E Ratio for DAX 40 and EuroStoxx 600
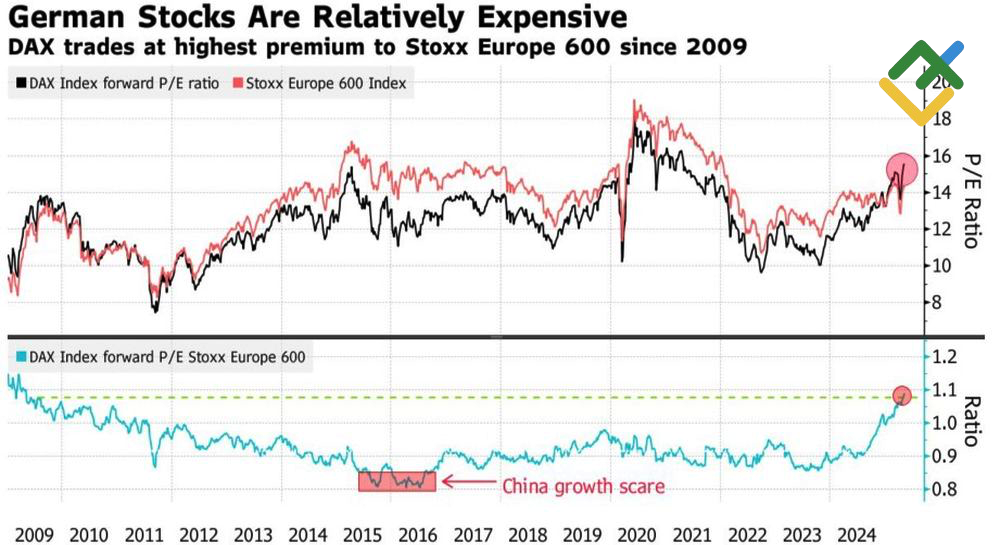
Source: Bloomberg.
Quarterly DAX 40 Trading Plan
Notably, there are inherent risks involved. Having reached an agreement with China, Donald Trump is now turning his focus to Europe. The fact that Friedrich Merz was unsuccessful in his first attempt to become German chancellor is a cause for concern. However, the rise in trade and political risks may only trigger a correction in the DAX 40 index, allowing investors to purchase it at a more favorable price. The index will likely hit the established target of 26,000 in mid-September. Therefore, long positions can be opened on pullbacks.
This forecast is based on the analysis of fundamental factors, including official statements from financial institutions and regulators, various geopolitical and economic developments, and statistical data. Historical market data are also considered.
Price chart of FDAX in real time mode

The content of this article reflects the author’s opinion and does not necessarily reflect the official position of LiteFinance broker. The material published on this page is provided for informational purposes only and should not be considered as the provision of investment advice for the purposes of Directive 2014/65/EU.
According to copyright law, this article is considered intellectual property, which includes a prohibition on copying and distributing it without consent.
{{value}} ( {{count}} {{title}} )
This post is originally published on LITEFINANCE.