The question of whether oil will rise or fall is a pressing concern for traders and investors who closely follow the energy market. Geopolitical and economic factors make oil price forecasting a challenging task. Therefore, it is crucial to analyze expert forecasts before making informed trading decisions.
Recent data shows a notable decrease in oil purchases of WTI and Brent among asset managers. According to the Commodity Futures Trading Commission, the pace of reduction is the fastest in 4 years. Meanwhile, OPEC is sticking to its decision for member countries to temporarily reduce production until the end of 2024, preventing further price declines.
The overall trend is downward, but oil is susceptible to any geopolitical events that may reverse the current trend.
This article analyzes the factors that may affect the price of oil and presents forecasts for the WTI rate. Let’s find out what will happen to the WTI rate in the near and distant future.
The article covers the following subjects:
Highlights and Key Points: WTI Crude Price Forecast for 2024–2030
-
The oil price is $75.285 as of 26.08.2024.
-
Most experts assume that oil will fluctuate within the sideways channel of $70.00–$85.00 until the end of 2024, suggesting that the market will remain relatively stable, with minimal price changes.
-
During a sideways market, it is better to open trades near the trading channel’s boundaries. Short and long trades can be opened at $87.00 and $68.00, respectively.
-
In the short term, oil is projected to slump to the lower boundary of the sideways channel. If the price goes beyond the key levels, buyers and sellers may develop the trend. The bearish and bullish scenarios assume that the crude price may reach $62.40 or $93.85, depending on the trend direction.
-
Analysts forecast growth for 2025. The average price is predicted to be in the range of $83–$84 per barrel.
-
According to long-term forecasts for 2026–2030, the price is expected to rise to $115 per barrel. Such limited growth typically precludes significant and risky corrections, which could result in financial losses for inexperienced traders.
-
Oil trading can be a lucrative investment opportunity. Oil is one of the world’s most widely traded assets. Due to the high trading volumes, you can find favorable buying and selling prices.
-
The oil price is influenced by a number of factors, including geopolitical events, shifts in supply and demand, natural disasters, and political decisions. The market’s high volatility presents numerous opportunities for traders to generate profits from both rising and falling prices.
-
Oil can be an excellent asset for investors to diversify their portfolios. Oil trading helps to reduce overall risk, especially if the investment portfolio consists of stocks and bonds.
-
You can trade oil using various instruments such as futures, options, contracts for difference, exchange-traded funds, and even oil company stocks. This wide variety provides flexibility in choosing a trading strategy.
-
Before making any trading decisions, it is essential to conduct a detailed analysis, assess the risks, and compare potential profits with potential losses. Any forecasts should be treated with caution as they may change depending on various factors.
-
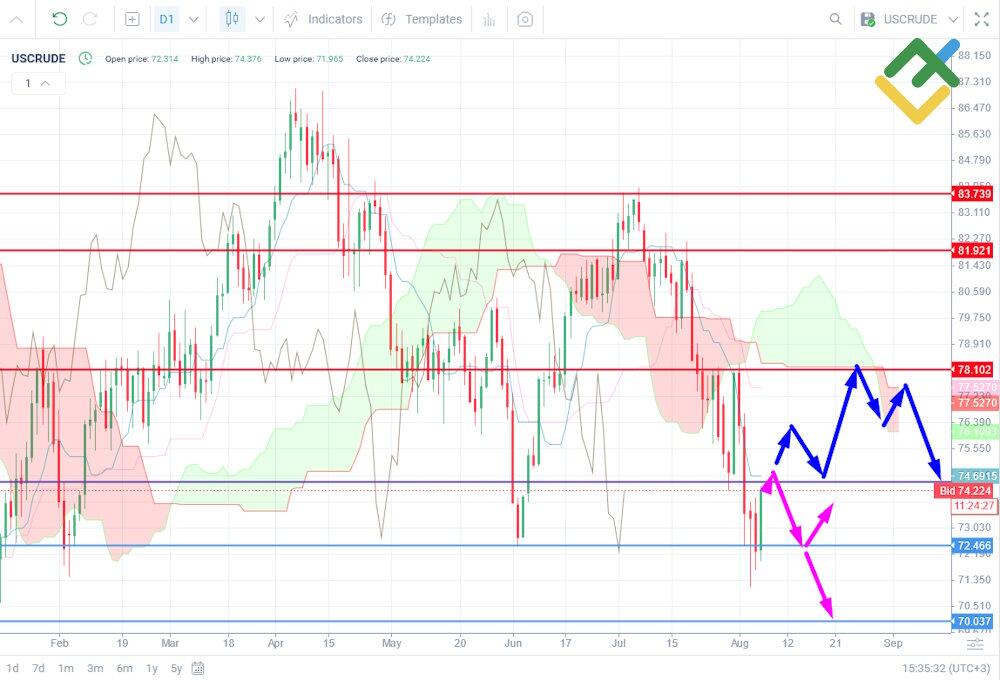
USCrude: according to technical analysis, all short trades opened near the previous key resistance have reached their bearish targets. The price is trading in an upward correction.
Oil weekly price forecast as of 26.08.2024
Early last week, oil continued to trade in a medium-term downtrend. As a result, the price tested the support of 71.35, the previous low. Once all short trades opened near the previous key resistance reached their bearish targets, the price started an upward correction.
If the correction continues this week, the price may reach the resistance (A) 77.88 – 77.29. After hitting this area, one may consider short trades with the target of 71.35.
If the asset breaks through the resistance (A) during trading, the correction will continue to the trend’s boundary 81.15 – 80.26.
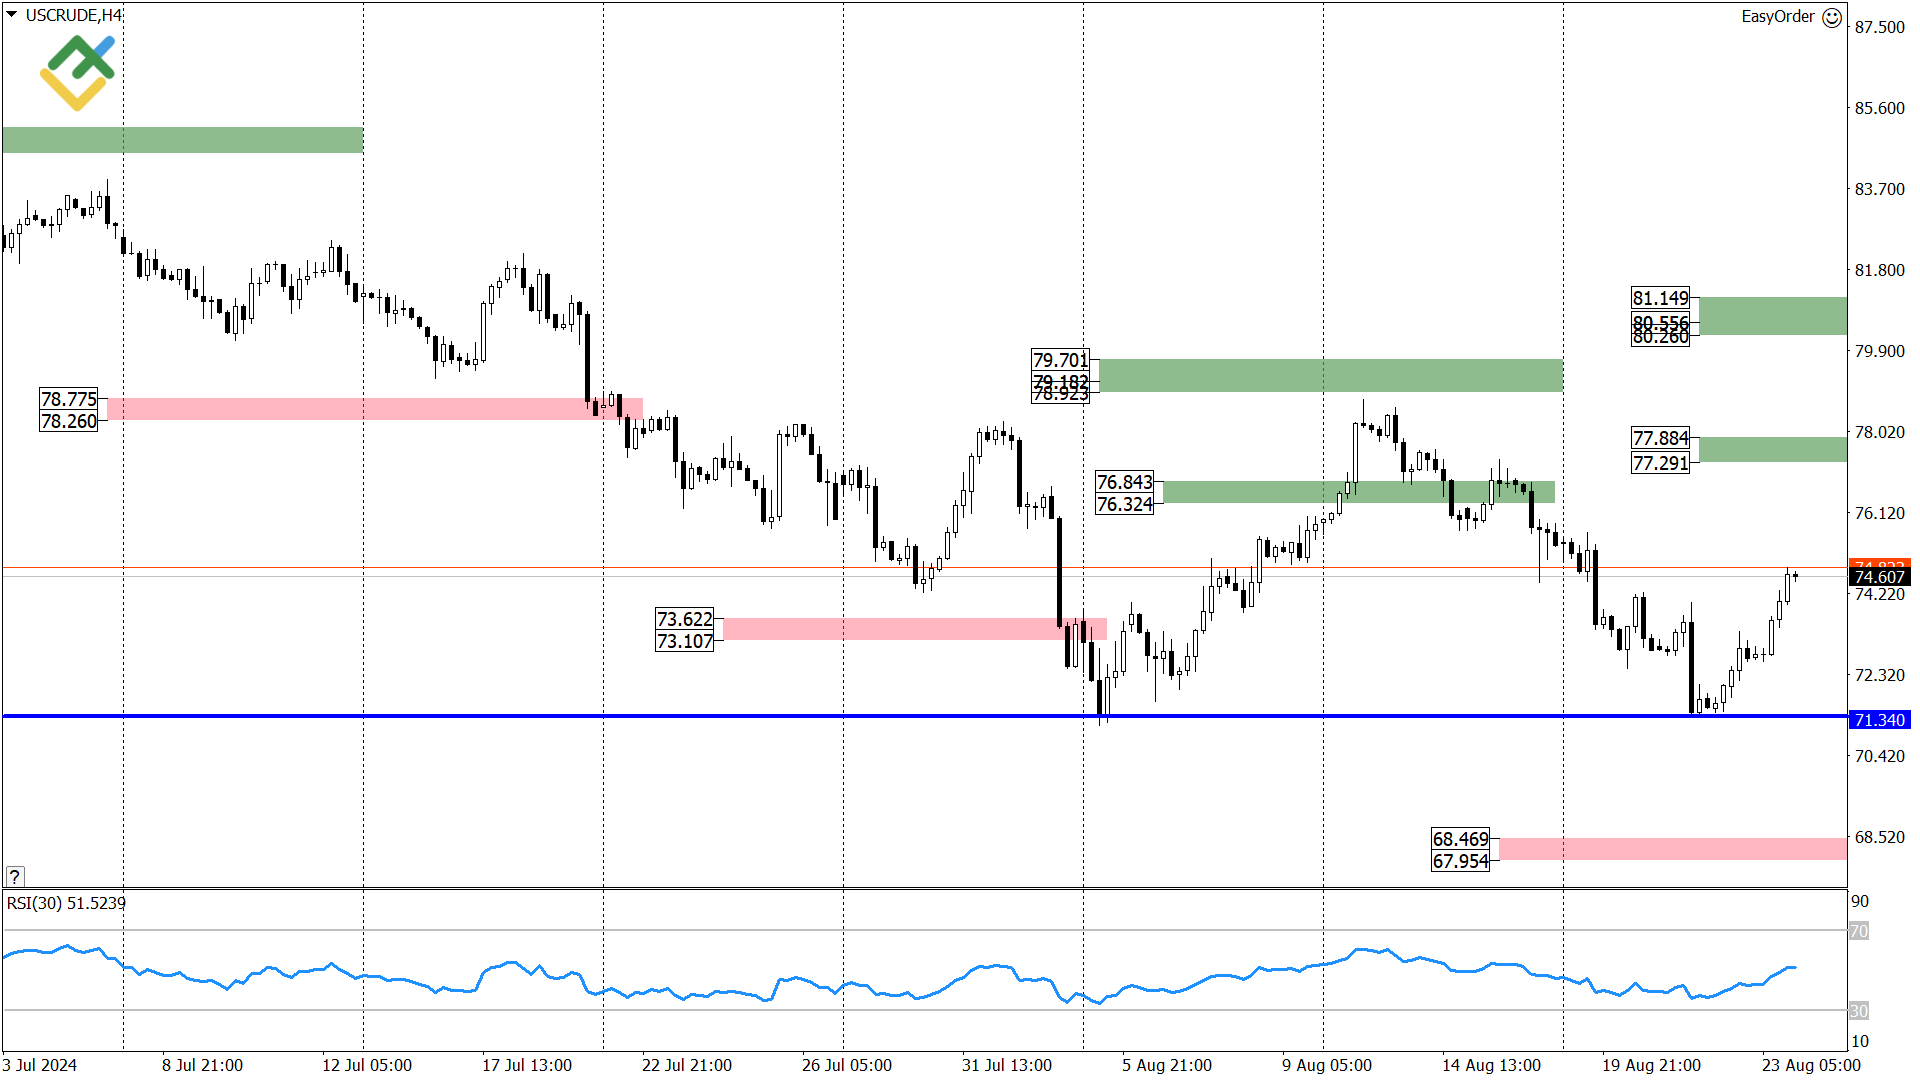
USCrude trading ideas for the week:
-
Sell according to the pattern at resistance (A) 77.88 – 77.29. TakeProfit: 71.35. StopLoss: according to the pattern rules.
-
Sell according to the pattern at resistance (B) 81.15 – 80.26. TakeProfit: 71.35. StopLoss: according to the pattern rules.
Technical analysis based on margin zones methodology is presented by an independent analyst, Alex Rodionov.
Get access to a demo account on an easy-to-use Forex platform without registration
US Crude Oil Technical Analysis
Let’s examine the daily chart of US Crude to gain insight into the asset’s quotes.
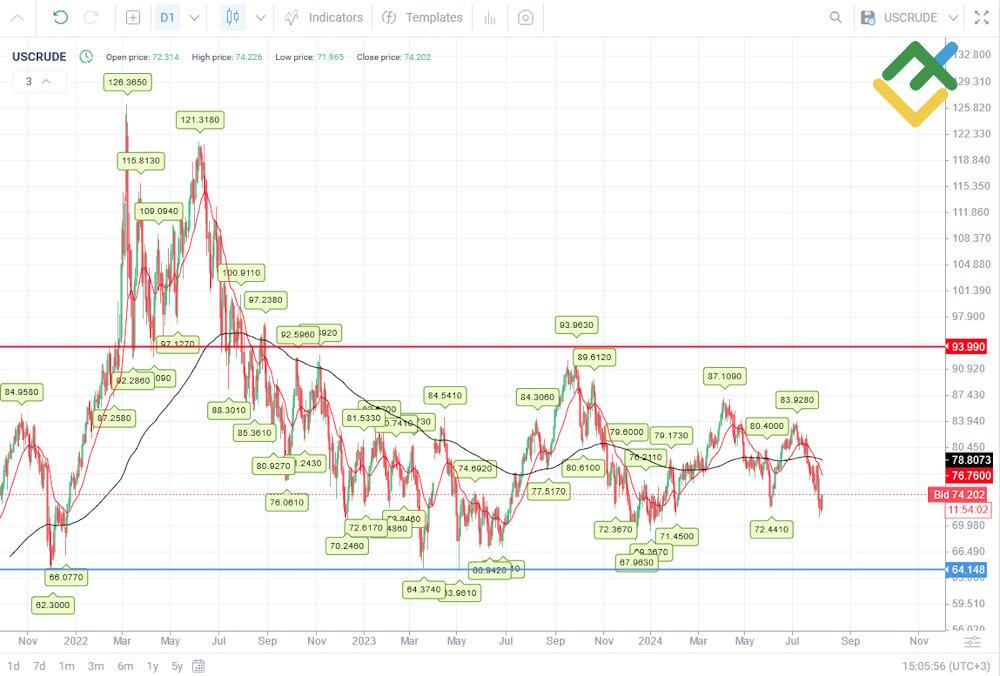
The chart shows that the oil price is trading in a global downtrend that began in the summer of 2022. The quotes fell from $121.31 in June 2022 to $63.96 in May 2023. Currently, the WTI crude oil trades at $75.285 per barrel as of 26.08.2024.
The daily price chart helps identify strong support and resistance levels. The key resistance is at $94.00, while the key support is at $64.15.
Let’s zoom in on the chart and examine the current state of the asset in more detail.
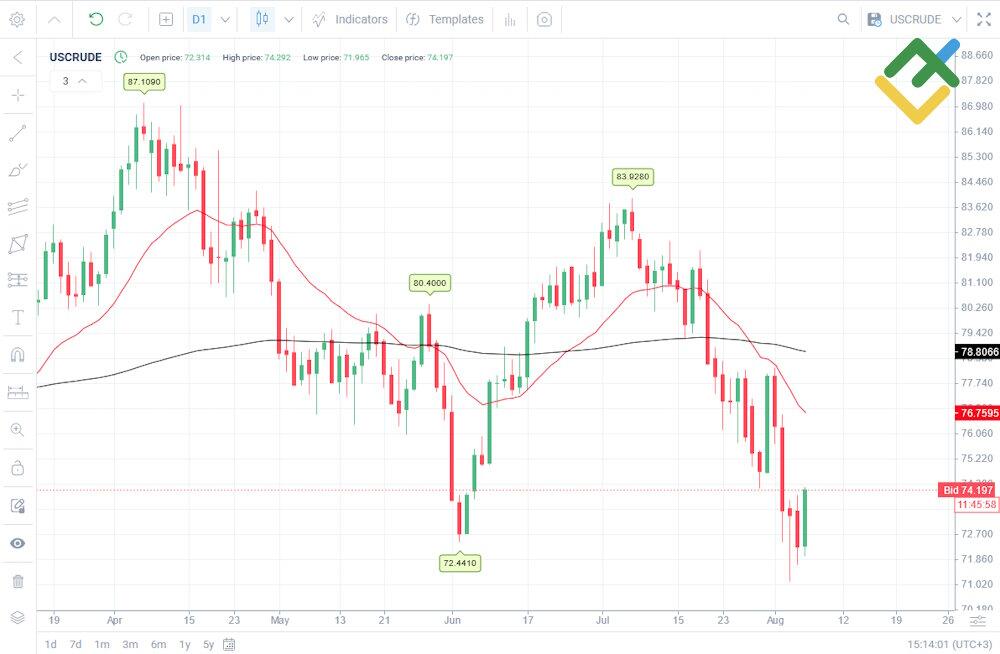
On April 5, 2024, the price surged to a high of around $87.10. However, by June 4, it dropped to a low of $72.44. On July 5, the price reached another high of $83.92 and fell to $71.12 on August 5. The decline in the major highs and lows points to a downtrend on the daily chart.
The long-term trend’s EMA 190 does not show a clear direction and is moving horizontally. The EMA 21 is bearish, which indicates a short-term downtrend.
Let’s use technical analysis indicators to make a forecast for three months and 2024.
blog
Promo code
WTI Crude Analysis For Next Three Months
Let’s use the daily chart with the Ichimoku indicator to spot different trends and potential pivot points.

In June 2024, the price tried to reverse the long-term downtrend by breaking through the red cloud. WTI traded above the cloud for some time but failed to form an upward movement. As a result, the asset fell again and reached below the June low near the support of $72.45.
Oil is trading in a long-term downtrend. The red cloud emerging on the right side of the current price confirms this. Tenkan and Kijun lines are descending, meaning the short-term and medium-term trends are also bearish.
Let’s add support and resistance levels to identify potential pivot points.
The nearest unconfirmed resistance level is at $74.50. If bears manage to hold the price below this level, the decline will continue to $72.45. The Tenkan line located near this level provides additional strength to the $74.50 level.
The chart shows the August high of $78.10, which serves as resistance. If the price breaks through the $74.50 level, the growth will continue to $78.10. Consider short trades at this level. The Kijun line located near this mark adds strength to this level.
The downtrend is expected to continue for the next three months. Therefore, consider short trades at the resistance levels of $74.50 and $78.10 with the target of $72.45. If the asset breaches the $72.45 level, the decline will continue to $70.00 and $67.65.
Long-Term US Crude Technical Analysis for 2024
Let’s use a weekly chart with the Ichimoku indicator for a long-term forecast.

The Ichimoku clouds, which have formed recently, are shrinking and changing their color frequently. This indicates market uncertainty and the absence of a clear trend.
The Tenkan and Kijun lines are horizontal, implying the absence of short- and medium-term trends.
Let’s define key support and resistance levels in order to understand how to trade flat and what happens with the asset in case of a sideways breakout.
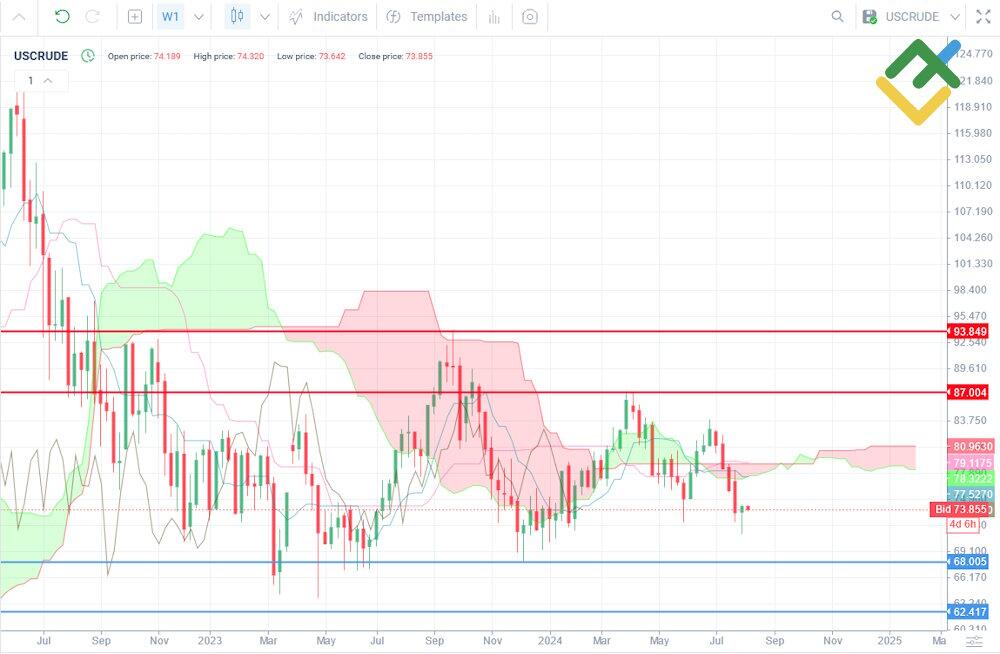
The oil’s key support is the December 2023 low near $68.00. If the price breaks through this level, bears may push the quotes down to $62.40.
The key resistance is the April 2024 high near $87.00. If the price breaches this level, the asset may rise to $93.85 in the long term.
Therefore, the quotes are expected to move either to the upper or lower boundary of the channel in the remaining half of 2024. Besides, the asset will likely try to break through the key resistance or support. If so, the price will move further to the breakout level. The highest bullish target for 2024 is $93.85, and the lowest bearish one is $62.40.
|
Month |
WTI Crude Price Forecast |
|
|
Minimum, $ |
Maximum, $ |
|
|
August |
70.00 |
76.00 |
|
September |
65.00 |
70.65 |
|
October |
62.40 |
68.00 |
|
November |
65.00 |
71.30 |
|
December |
68.00 |
77.00 |
Long-Term Trading Plan for WTI Crude
Let’s make a long-term trading plan for US Crude.
-
The oil is trading in a short-term downtrend. Therefore, the quotes may decline after a correction in the next month. The bearish target is the August 2024 low near $71.20.
-
In the next three months, the price will be trading flat within the $68.00–$87.00 range. If the rate breaches the range boundaries, the asset will trade in a wider channel of $62.40–$93.84.
-
Long-term trading requires focusing on the global trend, which has remained bearish since March 2022. Therefore, the price may try to break the support of $68.00 in 2024.
-
If oil breaks through the $68.00 level, the price may reach below the 2023 low and decline to $62.40.
-
The negative outlook will remain valid if the price fails to break through the resistance of $87.00 marked on the weekly chart. If oil breaches this level, the quotes will grow to $93.85.
-
If the price consolidates above $93.85, the downtrend may reverse. If so, the asset may reach above the 2022 highs near $126.00.
In our blog, you can find daily short-term oil forecasts and trading signals based on a combination of margin zones methodology and technical analysis.
Start trading with a trustworthy broker
Oil Price Forecast for 2024 – Experts Predictions
Most experts believe that the oil price will trade in the channel of $70.00–$85.00 until the end of 2024. Analysts expect growth in August and early fall, but the average WTI oil price will hover around $75 by the end of 2024.
Long Forecast
Price range: $70.65 – $88.23 (as of August 14, 2024).
Long Forecast forecasts a modest increase to $79.62 by the end of the year, with the highest price anticipated in November at around $88.23. The lowest price is expected at $70.65 in September.
|
Month |
Opening, $ |
Min–Max, $ |
Closing, $ |
|
September |
80.63 |
70.65–86.85 |
82.71 |
|
October |
82.71 |
75.72–83.70 |
79.71 |
|
November |
79.71 |
79.71–88.23 |
84.03 |
|
December |
84.03 |
75.64–84.03 |
79.62 |
CoinPriceForecast
Price range: $72.94 – $81.46 (as of August 14, 2024).
According to CoinPriceForecast, the WTI price will trade near $72.94 by the end of the year. The price may grow to $81.46 in the short term but then return to its previous values. The forecast assumes the absence of a clear trend and the continuation of a sideways trend.
|
Year |
Mid-Year, $ |
Year-End, $ |
|
2024 |
81.46 |
72.94 |
WalletInvestor
Price range: $74.67 – $80.85 (as of August 14, 2024).
WalletInvestor expects WTI oil to trade in a narrow range of $74.67–80.85. The price will slightly appreciate to $80.08 in September, followed by a slow decline. Analysts foresee the quotes hovering around $76.16 by the end of 2024. In this situation, it is favorable to open trades at the range boundaries and stick to intraday or intra-week trading.
|
Month |
Opening, $ |
Closing, $ |
Min, $ |
Max, $ |
|
September |
80.610 |
80.085 |
80.028 |
80.850 |
|
October |
80.065 |
78.655 |
78.587 |
80.321 |
|
November |
78.448 |
75.581 |
75.581 |
78.448 |
|
December |
75.200 |
76.161 |
74.673 |
76.161 |
Predict Price
Predict-price‘s UK Brent oil forecast suggests no clear trend. There is a 22.04% chance of prices decreasing, with no chance of an increase. Thus, a neutral trend is expected over the next five months. By December 20, 2024, the highest Brent price will reach $78.27, while the lowest one may hit $39.15.
EIA
The US Energy Information Administration (EIA) updated its forecast for oil prices in August 2024. The prices are expected to grow due to the extension of the OPEC+ agreement on production cuts. The average price of Brent crude oil is projected at $84 per barrel in 2024, while WTI will trade at around $80 per barrel.
The forecast takes into account the production cuts by OPEC and some other oil producers, as well as the prospects for economic growth in major oil-importing countries.
This prediction is relevant given recent market events and EIA’s outlook for the next few months.
OPEC
The latest OPEC report, published in August 2024, revised its forecast for global oil demand growth downward. Demand is expected to rise by 2.1 million barrels per day in 2024, 135,000 barrels less than anticipated. This is due to China’s economic slowdown. However, the estimated growth still surpasses the historical average of 1.4 million barrels per day before the COVID-19 pandemic.
OPEC aims to maintain the WTI price above $75 for a long time, avoiding any oil price cuts until at least 2025. During the August meeting, OPEC+ member countries reaffirmed their commitment to existing production reduction agreements.
Oil Price Forecast for 2025 – Experts Predictions
In 2025, most experts predict prices will rise to about $83–$84. The forecasts consider the ongoing conflicts in Eastern Europe and the Middle East, which will keep oil prices from falling. Besides, analysts anticipate moderate global economic growth, with oil production remaining approximately the same.
Long Forecast
Price range: $70.24 – $93.53 (as of August 14, 2024).
According to LongForecast, the WTI crude oil will slowly rise and exceed $80.00 in 2025. In the first half of the year, the rate will climb to $89.08 and then correct to $73.94. By the end of the year, the price is expected to hover around $83.37.
|
Month |
Opening, $ |
Min–Max, $ |
Closing, $ |
|
January |
78.02 |
72.73–80.39 |
76.56 |
|
February |
76.56 |
76.56–85.32 |
81.26 |
|
March |
81.26 |
79.69–88.07 |
83.88 |
|
April |
83.88 |
83.88–93.53 |
89.08 |
|
May |
89.08 |
79.84–89.08 |
84.04 |
|
June |
84.04 |
74.89–84.04 |
78.83 |
|
July |
78.83 |
70.24–78.83 |
73.94 |
|
August |
73.94 |
73.94–82.45 |
78.52 |
|
September |
78.52 |
76.26–84.28 |
80.27 |
|
October |
80.27 |
80.27–89.51 |
85.25 |
|
November |
85.25 |
84.44–93.32 |
88.88 |
|
December |
88.88 |
79.20–88.88 |
83.37 |
CoinPriceForecast
Price range: $72.34 – $75.34 (as of August 14, 2024).
CoinPriceForecast analysts offer a more moderate outlook. The oil price will remain approximately at the current levels. Analysts expect the rate to reach $72.34 by mid-2025 and $75.34 by the end of the year. Thus, the price will trade in a narrow range, making it favorable to open positions at its boundaries.
|
Year |
Mid-Year, $ |
Year-End, $ |
|
2025 |
72.34 |
75.34 |
WalletInvestor
Price range: $76.26 – $88.77 (as of August 14, 2024).
WalletInvestor experts provide a moderate forecast for 2025, with the asset reaching its high at $88.77 and closing the year at $83.17. The maximum decline during the month will be approximately -3.1%, suggesting no major drawdowns.
|
Month |
Opening, $ |
Closing, $ |
Min, $ |
Max, $ |
|
January |
76.263 |
77.430 |
76.263 |
77.575 |
|
February |
77.459 |
81.759 |
77.446 |
81.759 |
|
March |
82.223 |
83.086 |
82.156 |
83.086 |
|
April |
83.223 |
83.850 |
83.223 |
85.159 |
|
May |
83.951 |
87.172 |
83.790 |
87.245 |
|
June |
87.295 |
88.570 |
87.283 |
88.570 |
|
July |
88.561 |
87.380 |
87.327 |
88.772 |
|
August |
87.151 |
87.310 |
86.311 |
87.352 |
|
September |
87.544 |
87.049 |
87.049 |
87.825 |
|
October |
87.089 |
85.550 |
85.550 |
87.344 |
|
November |
85.335 |
82.768 |
82.768 |
85.335 |
|
December |
82.357 |
83.170 |
81.698 |
83.170 |
Long-Term Oil Predictions 2026–2030
Most experts anticipate the WTI oil to rise steadily until 2030. In 2028–2029, the price will trade around $115 per barrel. A moderate upward trend with correction ranges typical for this instrument is expected. However, some analysts believe the price will not change significantly and will stand at $89.63 in 2030.
Long-term forecasts do not take into account unforeseen events, such as armed conflicts or natural disasters. Investors should be aware of potential risks when making long-term investments.
Long Forecast
According to Long Forecast, WTI will rise to $114.87 by September 2028, with high volatility expected. In 2026, the quotes will fluctuate between $84.39 and $65.01 based on months’ closing prices. However, starting from 2027, the rate will strengthen and reach its peak in 2028.
|
Month |
Opening, $ |
Min–Max, $ |
Closing, $ |
|
2026 |
|||
|
January |
83.37 |
80.17–88.61 |
84.39 |
|
February |
84.39 |
78.98–87.30 |
83.14 |
|
March |
83.14 |
76.80–84.88 |
80.84 |
|
April |
80.84 |
75.38–83.32 |
79.35 |
|
May |
79.35 |
75.40–83.34 |
79.37 |
|
June |
79.37 |
70.73–79.37 |
74.45 |
|
July |
74.45 |
74.45–83.02 |
79.07 |
|
August |
79.07 |
70.46–79.07 |
74.17 |
|
September |
74.17 |
66.09–74.17 |
69.57 |
|
October |
69.57 |
62.00–69.57 |
65.26 |
|
November |
65.26 |
58.15–65.26 |
61.21 |
|
December |
61.21 |
61.21–68.26 |
65.01 |
|
2027 |
|||
|
January |
65.01 |
63.54–70.22 |
66.88 |
|
February |
66.88 |
66.88–74.17 |
70.64 |
|
March |
70.64 |
70.64–78.77 |
75.02 |
|
April |
75.02 |
75.02–83.65 |
79.67 |
|
May |
79.67 |
79.67–88.84 |
84.61 |
|
June |
84.61 |
75.39–84.61 |
79.36 |
|
July |
79.36 |
79.36–88.49 |
84.28 |
|
August |
84.28 |
84.28–93.99 |
89.51 |
|
September |
89.51 |
79.76–89.51 |
83.96 |
|
October |
83.96 |
80.14–88.58 |
84.36 |
|
November |
84.36 |
84.36–94.07 |
89.59 |
|
December |
89.59 |
89.59–99.14 |
94.42 |
|
2028 |
|||
|
January |
94.42 |
94.42–105.28 |
100.27 |
|
February |
100.27 |
91.81–101.47 |
96.64 |
|
March |
96.64 |
96.64–107.76 |
102.63 |
|
April |
102.63 |
102.63–114.44 |
108.99 |
|
May |
108.99 |
108.99–121.54 |
115.75 |
|
June |
115.75 |
115.75–129.08 |
122.93 |
|
July |
122.93 |
109.54–122.93 |
115.31 |
|
August |
115.31 |
102.75–115.31 |
108.16 |
|
September |
108.16 |
108.16–120.61 |
114.87 |
CoinPriceForecast
CoinPriceForecast suggests a slow pace of the quote’s growth. The price will remain almost at the same level until 2030, trading in the $70.00–$80.00 range. Periods of growth will be balanced by periods of decline. However, oil will be able to grow slightly by 2030, with experts projecting a year-end rate of around $89.63.
This forecast may come true if the geopolitical situation remains approximately the same until 2030. However, this is unlikely, given the unforeseen events of the last decade. Therefore, these estimates should be treated with caution.
|
Year |
Mid-Year, $ |
Year-End, $ |
|
2026 |
82.70 |
72.51 |
|
2027 |
70.58 |
79.65 |
|
2028 |
73.23 |
73.03 |
|
2029 |
76.36 |
81.41 |
|
2030 |
83.83 |
89.63 |
WalletInvestor
WalletInvestor estimates that the WTI rate will appreciate until August 2029. By the end of 2026, quotes will reach $90.30 and increase to $97.16 in 2027. In December 2028, the oil price will grow to $104.06 and $114.45 by August 2029. Thus, the average growth rate will amount to 9.4% per year.
|
Month |
Opening, $ |
Closing, $ |
Minimum, $ |
Maximum, $ |
|
2026 |
||||
|
January |
83.399 |
84.441 |
83.346 |
84.578 |
|
February |
84.448 |
88.524 |
84423 |
88.524 |
|
March |
89.061 |
90.012 |
89.061 |
90.012 |
|
April |
90.207 |
91.021 |
90.207 |
92.197 |
|
May |
90.837 |
94.105 |
90.786 |
94.165 |
|
June |
94.260 |
95.530 |
94.256 |
95.531 |
|
July |
95.583 |
94.280 |
94.280 |
95.762 |
|
August |
93.993 |
94.463 |
93.327 |
94.463 |
|
September |
94.496 |
94.074 |
94.039 |
94.843 |
|
October |
94.240 |
92.661 |
92.661 |
94.355 |
|
November |
92.428 |
89.529 |
89.529 |
92.428 |
|
December |
89.358 |
90.305 |
88.726 |
90.305 |
|
2027 |
||||
|
January |
90.255 |
91.455 |
90.255 |
91.592 |
|
February |
91.448 |
95.264 |
91.414 |
95.264 |
|
March |
95.866 |
96.999 |
95.866 |
96.999 |
|
April |
97.319 |
97.913 |
97.319 |
99.202 |
|
May |
97.800 |
101.214 |
97.762 |
101.214 |
|
June |
101.219 |
102.550 |
101.219 |
102.550 |
|
July |
102.732 |
101.407 |
101.407 |
102.790 |
|
August |
101.120 |
101.413 |
100.327 |
101.413 |
|
September |
101.508 |
101.226 |
101.035 |
101.878 |
|
October |
101.112 |
99.778 |
99.778 |
101.355 |
|
November |
99.528 |
96.532 |
96.532 |
99.528 |
|
December |
96.419 |
97.160 |
95.742 |
97.208 |
|
2028 |
||||
|
January |
97.402 |
98.456 |
97.402 |
98.606 |
|
February |
98.416 |
102.790 |
98.416 |
102.790 |
|
March |
102.981 |
104.151 |
102.981 |
104.151 |
|
April |
104.700 |
105.014 |
104.700 |
106.172 |
|
May |
104.835 |
108.238 |
104.771 |
108.238 |
|
June |
108.425 |
109.600 |
108.324 |
109.697 |
|
July |
109.669 |
108.249 |
108.249 |
109.809 |
|
August |
108.113 |
108.646 |
107.310 |
108.646 |
|
September |
108.582 |
108.099 |
108.041 |
108.898 |
|
October |
108.156 |
106.517 |
106.517 |
108.346 |
|
November |
106.462 |
103.608 |
103.596 |
106.540 |
|
December |
103.348 |
104.063 |
102.722 |
104.108 |
|
2029 |
||||
|
January |
104.312 |
105.445 |
104.312 |
105.616 |
|
February |
105.596 |
109.774 |
105.473 |
109.774 |
|
March |
110.097 |
110.950 |
110.097 |
110.950 |
|
April |
111.475 |
111.899 |
111.475 |
113.108 |
|
May |
111.813 |
115.383 |
111.805 |
115.383 |
|
June |
115.292 |
116.563 |
115.292 |
116.652 |
|
July |
116.656 |
115.242 |
115.242 |
116.819 |
|
August |
115.166 |
114.458 |
114.458 |
115.218 |
IEA
The Oil 2024 report by the International Energy Agency (IEA) suggests that oil demand will gradually decline as alternative energy sources develop, particularly in Asian countries. Nevertheless, global geopolitical uncertainties and economic instability may support high oil prices in the coming years.
Oil Price History
Oil price changes reflect the supply and demand balance, geopolitical tensions, and the state of the world economy. In the 1980s, the price was highly volatile. The oil embargo and the revolution in Iran pushed the price up to $35. Later, demand fell sharply, and the price dropped to $10 by 1986.
In the early 2000s, the advent of industrialization in emerging markets spurred a surge in demand, propelling the average to $30.38 per barrel in 2000 and further to $99.67 per barrel in 2008. However, the global financial 2008 crisis led to a plummet in cost to $44.60 per barrel by the end of the year.
The subsequent recovery and geopolitical tensions in relevant regions drove US Crude’s value upwards, with 2011 seeing an average of $94.88 per barrel. The dynamics continued with the advent of shale oil production in the US, dragging prices down to an average of $48.66 per barrel in 2015. The saga continued with OPEC’s production adjustments and global demand fluctuations, reflecting a cost of $94.53 per barrel in 2022 before settling at an average of $77.59 per barrel in 2023.
Since the start of 2024, the WTI price has remained above $70 per barrel. The growth was driven by geopolitical events, OPEC+ actions, and economic conditions. OPEC+ continues to lower oil production, reducing the amount of oil available in the global market. The geopolitical situation in the Middle East has also escalated, undermining stability in the oil supply and increasing investor concerns. The conflict in the Middle East also contributes to keeping the price above $70.
The reduction of commercial oil reserves in the US, along with the economic recovery in a number of countries after the pandemic, continues to increase oil demand. The global economy’s recovery, especially in high energy-consuming countries such as China and India, supported prices until April 2024.
After the price surged to $87 at the beginning of the year, some countries began to increase oil production. Since April 2024, there have been signs of an economic growth slowdown in a number of major countries, including China, the eurozone, and the US, leading to a decrease in oil demand.
Due to a rise in production and a drop in demand, major economies experienced an increase in their commercial oil reserves. An increase in reserves usually indicates an oversupply in the market, leading to a decline in oil quotes. The US dollar appreciation in the spring of 2024 also contributed to the oil decline.
The above events caused the oil price to drop to $72.44 in June and $71.12 in August 2024. However, the asset is still trading above $70.00.
Factors that Can Affect the Oil Price
The oil price narrative is a tapestry of multiple intertwined factors. Top on the list is the geopolitics of supplier regions. Any unrest or political instability in these regions can cause significant swings. Similarly, decisions by major producing countries and organizations like OPEC regarding production levels directly impact supply and, subsequently, pricing.
Global economic health is another major player. Economic booms drive up demand for energy, pushing value upwards, while recessions dampen demand, leading to cuts in the WTI and Brent rates. Furthermore, technological advancements in extraction and production, like fracking, also affect supply levels and prices.
Additionally, the global drive towards renewable energy and subsequent policies and regulations can influence the demand. The pace at which renewable energy substitutes fossil fuels in various sectors will significantly affect WTI and Brent pricing.
Why Oil Is So Popular In Financial Markets?
Oil, referred to as black gold, remains a pivotal commodity in the global economic engine. Its intrinsic value stems from its multifaceted utility. Oil is used to fuel transportation and heat homes. It is also an essential raw material in numerous industries. This ubiquitous demand makes it a key player in the global energy scene.

Moreover, its market volatility often mirrors global economic and political scenarios, making WTI a significant indicator and, sometimes, a driver of global economic health. For investors, black gold presents an avenue for portfolio diversification, offering a hedge against inflation during turbulent times.
Oil Varieties
In the realm of financial markets, two prominent oil benchmarks are traded: the highly favored American WTI and its counterpart, UK Brent.
West Texas Intermediate (WTI)
WTI is a staple in US refineries, serving as a crucial value benchmark. It’s a light sort with high API density and minimal sulfur content. WTI is traded globally among firms and investors, primarily through the CME Group and Light Sweet Crude Oil (CL) futures.
Cushing, Oklahoma, is the principal storage hub for WTI, linking to pipelines that distribute the commodity nationwide. WTI serves as a vital feedstock for refineries in the Midwest and Gulf Coast regions.
Brent Crude Oil
Brent, originating from the North Sea’s Brent field, is a major petroleum rate oil benchmark for Europe, Africa, and the Middle East. Despite most platforms in its originating field being decommissioned, Brent’s quote often surpasses WTI’s, sometimes by over $10, due to various market factors.
Shale Oil Impact
The shale boom has caused concerns in OPEC. The cartel countries considered the new type of fuel a threat to the market. Thus, OPEC increased production, plummeting quotes to below $30 per barrel in early 2016, aiming to oust shale producers. However, OPEC failed to oust shale oil producers, and the organization’s revenues decreased.
OPEC’s Role
With stable demand predicted, the surge in US shale production poses a challenge. Initiated by high estimates in 2014, the shale revolution thrived despite high production costs. OPEC, striving for balanced costs, urges an industry investment of over $11 trillion over two decades to prevent shortages. Despite the rise in the number of electric vehicles, OPEC anticipates growing oil demand, driven partly by expanding air travel.
After the 2016 decrease, OPEC has endeavored to stabilize the value by enforcing production caps among member nations, albeit with mixed success due to non-compliance by some countries and continuous output ramp-up by non-OPEC countries, exerting prolonged pressure on the market.
Conclusion: Is Oil a Good Investment?
According to forecasts for 2024, the oil price will either trade in a sideways channel or the downtrend will continue. This means that oil should not be considered a suitable option for medium-term investment. However, one may consider short-term trades at the boundaries of trading channels. This strategy is more suitable for traders rather than investors.
At the same time, long-term forecasts assume that oil prices will rise until 2030, making WTI a potential long-term investment with projected quotes reaching $115 per barrel. However, the potential profit might not be very high, considering the possible risks and costs of maintaining positions.
The unstable geopolitical situation should also be taken into account. Military activity in oil production regions creates additional risks for buyers and sellers and negatively affects oil prices.
In the current market realities, market participants should refrain from investing in oil. However, one may consider short- and medium-term trading for up to three months.
Oil Price Prediction FAQ
The WTI oil price is $75.285 per barrel as of 26.08.2024.
Experts believe the oil price will trade around the current values in 2024. By the end of the year, oil is expected to move to one of the channel’s boundaries of $87.00 or $68.00. Long-term forecasts assume price growth to $115.00 within five years.
Oil will likely experience both rises and falls in 2024 as it trades in the $68.00–$87.00 range. Breaching the range boundaries will indicate a new trend.
Most experts anticipate the price to climb to $83 per barrel in 2025. However, neutral forecasts assume trading in the $70–$75 range.
OPEC suggests that the oil price will range between $60–$80 in 2030. Banks and analytical agencies predict that oil will trade at $70–$100. According to the most optimistic forecasts, the price will reach $115.
The medium-term oil price is expected to fluctuate from $68.00 to $87.00, while most analysts foresee WTI quotes to reach $115.00 in the long term.
Oil is a highly volatile asset that can be greatly affected by changes in global politics. Therefore, it is more profitable to trade oil rather than invest in it because the current situation does not offer a clear trend.
Currently, the global oil output stands at less than half of the world’s oil reserves. Many of these reserves remain unexplored or undiscovered.
OPEC and the IEA expect oil demand to decline due to the global shift to renewable energy sources. Nevertheless, global geopolitical risks and economic instability may prop up oil prices in the coming years.
The content of this article reflects the author’s opinion and does not necessarily reflect the official position of LiteFinance. The material published on this page is provided for informational purposes only and should not be considered as the provision of investment advice for the purposes of Directive 2004/39/EC.
{{value}} ( {{count}} {{title}} )
This post is originally published on LITEFINANCE.


