Bulls Power and Bears Power are oscillator-type indicators that show the strength of buyers and sellers on different time frames. They confirm signals received from trend indicators. The indicators take into account the asset’s high and low prices as well as 13-period exponential moving average.
This article explains how Bull Power and Bear Power indicators operate, and how to use these indicators in combination with trend indicators, providing an example of an online trading strategy.
The article covers the following subjects:
Key Takeaways
-
Bulls Power and Bears Power are indicators that measure the strength of bulls or bears in the market.
-
Bears Power gives a signal to open a long position when it is below the zero line, the bars are increasing, approaching the zero threshold. A short position can be opened if Bulls Power is above the zero line, the bars are decreasing, approaching zero. You can also consider other signals. Bulls Power generates a buy signal when its bars are growing. On the contrary, a sell signal appears when Bulls Power’s bars are declining. The zero value of the indicators point to a balance of market forces in which the price is balanced between sellers and buyers’ interest. If Bulls Power goes up, it indicates that demand exceeds supply, and the price increases. If Bears Power goes down, it indicates that supply exceeds demand, and the price decreases.
-
Both indicators are used to confirm the signals of trend indicators. They do not work in flat market conditions.
-
The indicators can be employed in the following trading strategies: a trend trading strategy using moving averages or channel indicators on H1 – H4 time frames; and trading on divergence that implies opening a trade in the direction of indicator movement once its divergence with the direction of price movement is present.
-
This indicator is clear and reasonable for trend strategies. Its disadvantage is that it is sensitive to volatility, with the increase of which it gives more false signals.
The Elder-Ray Index
The Elder-Ray index is called the Bull Bear Power indicator. It reflects the behavior of buyers and sellers in the market during a certain period of time. If the indicator hovers near the zero line, there is balance in the market – neither party prevails, demand is balanced with supply, and the price does not change. If the indicator value goes above or below the zero line, it shows that one market force dominates the other.
When developing the indicator, Dr. Alexander Elder was guided by several assumptions:
-
Trading is a confrontation between buyers trying to increase the price and sellers trying to push the price down. Whoever is more interested sets the pace in the market with trading volume.
-
A moving average reflects the average consensus of value between buyers and sellers, representing a market equilibrium. It tends to return to a level where supply and demand are in balance. However, the market is a battlefield of buyers and sellers. Once one side gains the upper hand, the price moves away from its equilibrium value.
-
The high price represents the maximum bullish strength. It means that buyers are willing to pay for the asset at the high relative to the moving average price. The low price level indicates the maximum bearish strength. This means that sellers are willing to sell the asset even at the low price.
Based on these assumptions, Dr. Alexander Elder developed Bulls Power as the difference between the maximum price and the exponential moving average to confirm the trend. A value greater than zero means that buyers dominate, and the price is going up. A value less than zero means that sellers dominate the market, and the price is declining.
The Elder Force Indexes allow traders to:
-
anticipate a likely change in trend.
-
judge how strong the trend is and how long it can last.
-
detect false breakouts and distinguish corrections from the trend.
The Bull Bear Power indicator is used as an oscillator and in combination with other signals generated by trend indicators.
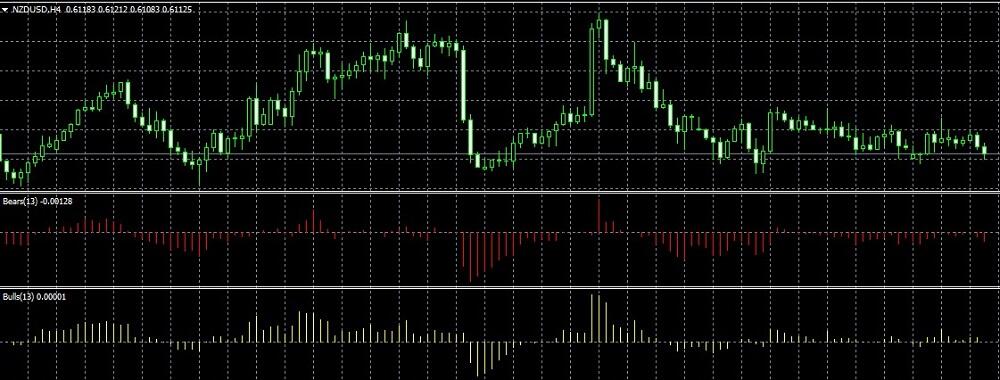
On the trading platform, Index Bull Bull Bear Power are two different indicators. They are histograms, which are built relative to the middle zero horizontal line. Both histograms are located below the price chart.
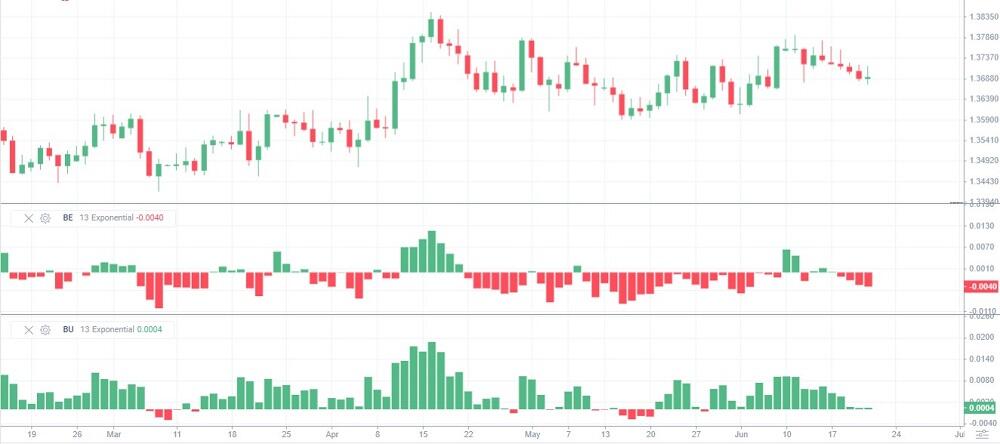
On LiteFinance trading platform, Bears Power is denoted by “BE” (upper histogram reflects bears’ power), Bulls Power is denoted by “BU” (lower histogram represents bulls’ power).
In the settings of the exponential moving average, the default period is 13, but you can change it. The smaller the period, the sharper and faster the indicators will react to price changes. At the same time, more false signals can be generated. The EMA period is selected individually for each time frame, asset, and volatility in the strategy tester.
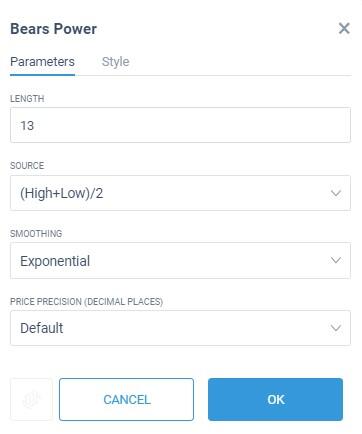
In the settings, you can also specify the type of price used in the calculation formula and the type of MA. There are eight price variants, four main open-high-low-close (OHLC) prices and four additional ones. In addition to the EMA, you can set a simple moving average (MA), as well as linearly weighted (LWMA) and smoothed (SMMA) moving averages.
Bullish and bearish power indicator signals:
1. Buy signal:
-
The Bears Power indicator is below the zero line. The bars are consistently decreasing towards the zero line.
- The Bulls Power indicator is above the zero line and increasing. The bars are consistently rising.
2. Sell signal:
-
The Bears Power indicator is below the zero line. The bars are consistently declining, moving away from the zero line.
- The Bulls Power indicator is above the zero line, declining from the maximum values. The bars are consistently decreasing towards the zero horizontal line.
The signals can be easily interpreted. If the buyers’ power grows, the sellers’ power should fall accordingly. In this case, Bulls Power goes to its maximums, and Bears Power, on the contrary, tends to the zero line. The opposite is true for selling. Bears Power will go lower in the negative zone, Bulls Power will move to the zero line.
Calculating Bull and Bear Power Indicators
The indicators are based on the 13-period exponential moving average as recommended by Dr. Alexander Elder.
The indicator’s formula:
Bears Power = Low – ЕМА (13)
Bulls Power = High – ЕМА (13), where
-
Low – the lowest candlestick price, the lowest point of the shadow.
-
High – the highest candlestick price, the topmost point of the shadow.
-
EMA – an exponential moving average. It differs from a simple moving average by an additional coefficient in the formula, which gives weight to separate periods. The EMA gives more weight to the latest data.
Both trend indicators are among the basic indicators on most trading platforms. For example, they can be found in the oscillator block on the MT4 platform.
The main setting parameter is the EMA period. Other parameters can be adjusted to the trading platform. For example, you can also specify the “Apply to” parameter on MT4. It allows you to choose the type of price that is taken into calculation. There are four main types – OHLC, and three additional types – Median, Typical, and Weighted Close prices. On the LiteFinance platform, you can also specify the type of moving average. Besides the EMA, you can choose three other types of MAs.
Using the Bull and Bear Power Indicators in MetaTrader 4
Bulls Power and Bears Power indicators are displayed differently on the MT4 and LiteFinance trading terminals. On the LiteFinance platform, they are full-body bars overlapping each other. MetaTrader 4 offers vertical lines corresponding to each candlestick.
Visually, it is convenient to draw divergence lines at a minimum scale. However, when looking for trading signals, it is more convenient to use bars that coincide with the candlestick height.
These are the only differences. In MT4, you can also change the settings of the moving average, a price type, style (line thickness, color, dotted lines). You can set price levels. This is useful when you want to examine the history of quotes for the strongest trend movements – the moment when the indicator bars are far from the zero horizontal line, warning you of an imminent trend reversal.
Trading With the Bulls and Bears Power Indicators
Since a change in the balance of power is one of the first signals of a future trend change, assessing the advantage of one market force over another is crucial. Bull and bear power indicators are a trend confirming tool in the Forex market. Therefore, it is mainly used in trending markets.
Let’s use the M30-H4 time frames. On lower time frames, indicators will show frequent trend changes and give a lot of false signals. On the D1 and higher time frames, it takes a long time for a confirming signal to emerge. This is a working strategy, but it requires patience, as early market entry may bring losses.
The following trading strategies can be used:
-
Trend trading. The idea is that every trend ends sooner or later. In an uptrend, the bullish strength runs out of steam. As the price rises, there are fewer traders willing to buy an asset, and there are more of those willing to sell it. Bearish power grows. The trend reverses once sellers engulf all buyers’ volume. The Bulls Power and Bears Power indicators signal this. The essence of the trend strategy is to wait for the trend reversal and open a trade.
-
Channel trading. The idea is that the price tends to its average consensus value – the balance of buyers and sellers. A sharp expansion of the channel means a strong distancing of the price from its median. The essence of the channel strategy is to wait for a rebound from the channel boundary with the confirmation of the signal generated by the bulls and bears’ strength indicators.
-
Trade on divergence. This is a non-standard signal that occurs on a reduced scale of the chart – divergence between the movement of the indicator and the price. The disadvantage is that it takes a long time to wait for the signal to appear, as it consists of several dozens of candlesticks and indicator bars. The advantage is that the signal is almost always relevant.
Examples of these strategies are described below.
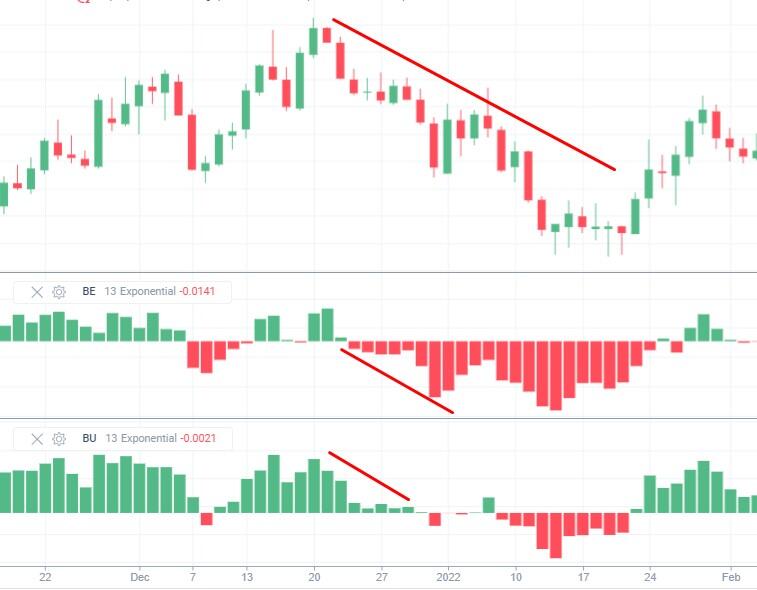
1. Trend trading.
One of the popular classic Forex strategies is trading using moving averages. This strategy is discussed in general terms in many sources, but it has nuances.
The essence of the strategy is as follows: If the price crosses the moving average from below and the trend indicator is directed upwards, it is an uptrend signal. If the price crosses the MA from above and the trend indicator is moving downwards, it is a signal of a downward trend. Oscillators confirm the signal.
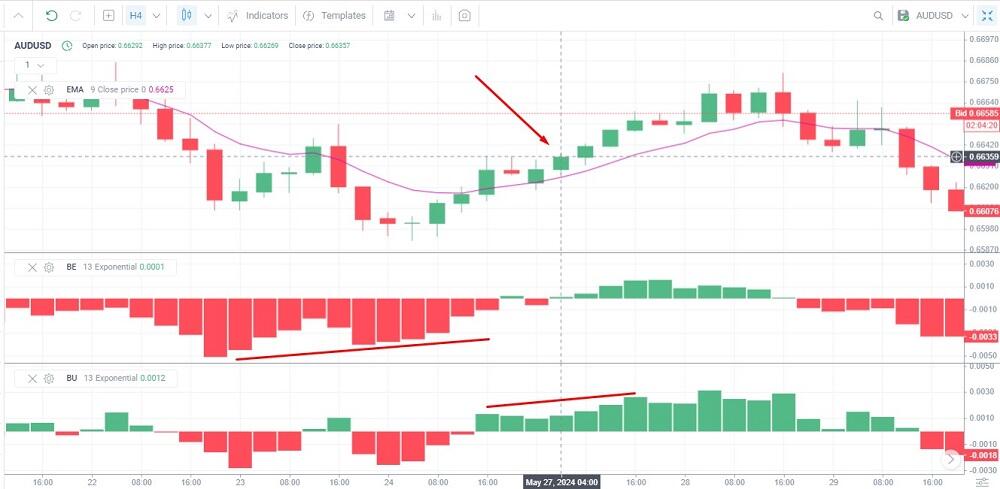
Let’s have a look at the AUD/USD currency pair on the H4 time frame. The 9-period EMA is taken as the main trend instrument. The exponential MA differs from the simple moving one in that the formula gives more weight to later periods with the help of coefficients.
The Bears Power indicator (BE) shows the gradual decline of the sellers’ strength. The price breaks through the EMA from below. We could open a long trade on the next candlestick, but the Bulls Power indicator (BU) has only two green bars formed at this point, the second of which is lower than the first one. The buy signal is weak, there could be a probability of a loss.
The price rebounds from the EMA, the Bulls Power indicator shows the growing strength of buyers. After the rebound, you can open a trade on the second candlestick, as the oscillator shows the growing strength of buyers.
2. Channel trading.
Instead of analyzing the history of quotes, let’s examine a real-life example.
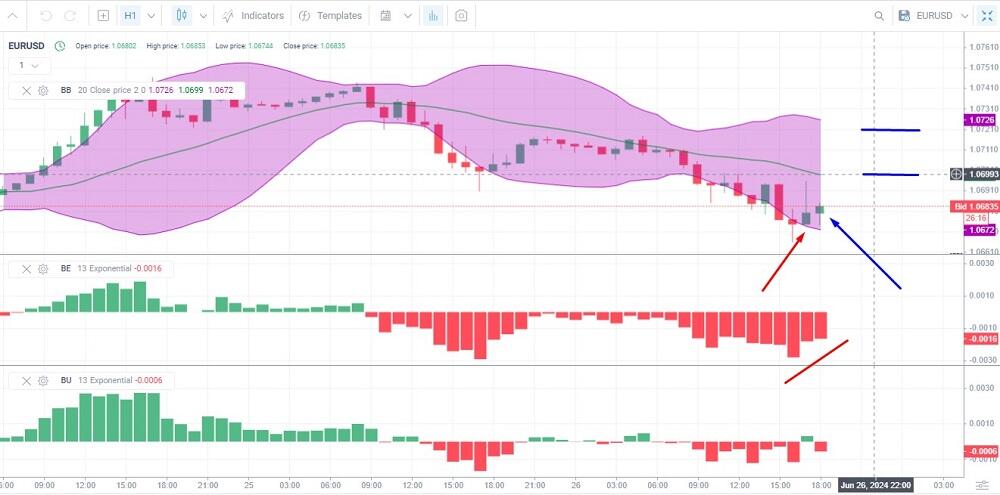
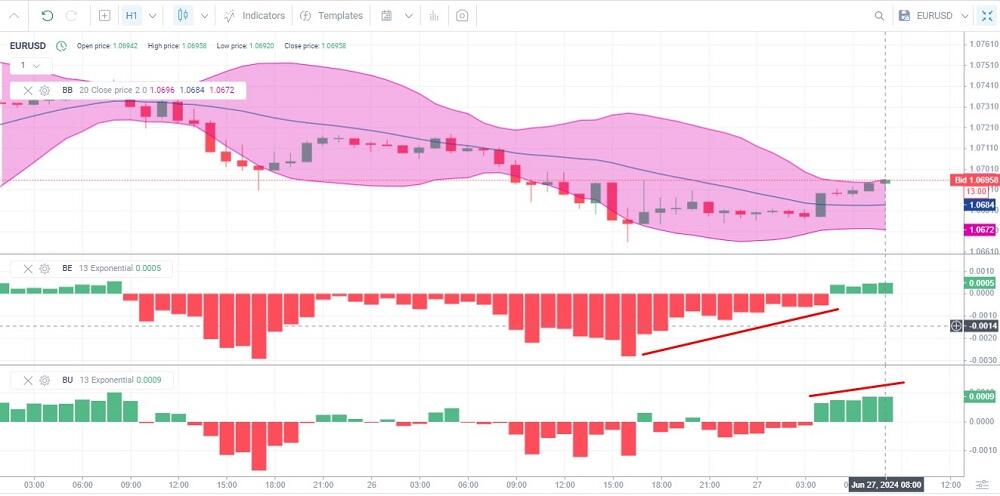
On the evening of June 26, 2024, here is how the EUR/USD currency pair on the H1 time frame looked like. In addition to the bull and bear power indicators, the Bollinger Bands channel indicator with default settings was added to the chart.
The strategy implies capturing the moment of channel narrowing after its expansion. The widening channel indicates the growth of the amplitude of the price movement in relation to the median. When the price has moved far away from the median, we should wait for a trend reversal. However, channel trading alone involves a high degree of risk as the price can break through the channel boundaries. Therefore, it requires a confirming signal generated by an oscillator.
The following signals can be seen on the chart after the formation of a wide channel:
-
The price starts returning to the middle of the channel. Two green candlesticks appear, rebounding from the BB channel border.
- After hitting its extremum in the negative zone, the bear power indicator is gradually returning to the zero line.
Both signals indicate that the strength of the sellers is weakening and a long position can be opened. I opened a trade on the second green candlestick (blue arrow). The first target is located in the middle of the channel (the first blue line). Here you can close half of the position and protect the remaining 50% with a trailing stop order or place a take-profit order at this level. You can determine a stop-loss and trailing stop levels depending on your risk management. The second target is at the channel’s opposite boundary.
I kept my trade open for a few hours. The position was opened at around 18:00 on June 26. After a while, I checked the chart at 08:00 on June 27 (GMT+3):
In addition to the fact that the bear power indicator continued moving towards the zero line, an upward movement of the bull power indicator in the positive zone confirmed the received signal. Therefore, the signal was profitable.
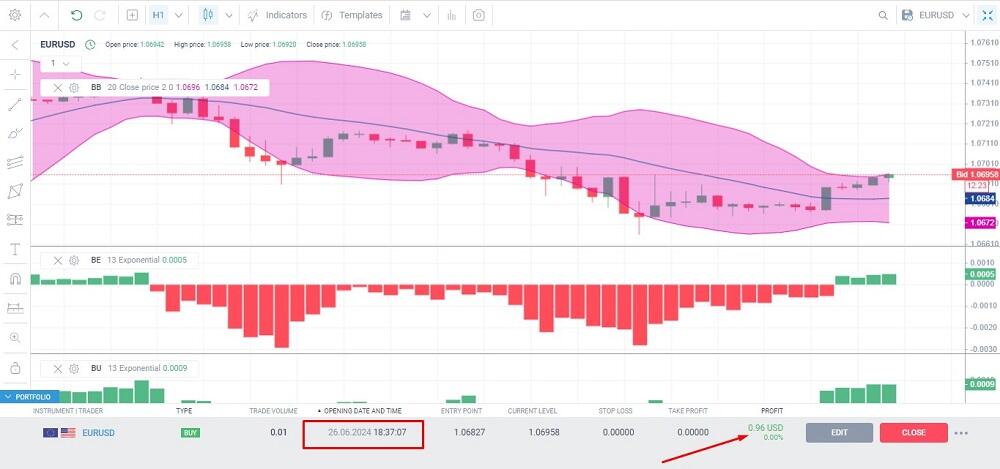
The trade with a minimum volume of 0.01 lot brought 0.96 USD or about 15 pips of profits, including the swap and spread.
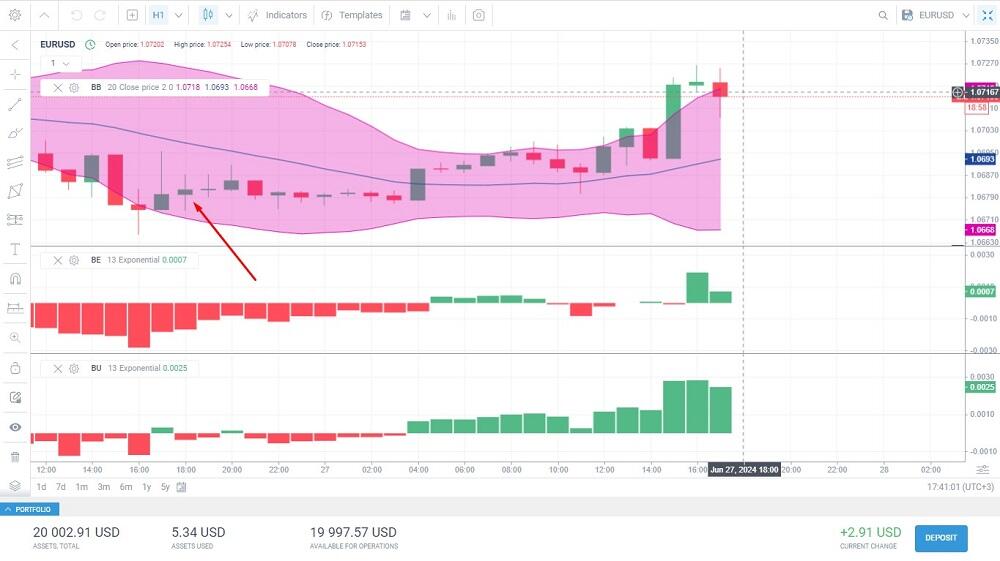
In 24 hours, the trade generated more than 2.5 USD in a strong uptrend. The arrow indicates the candlestick where the trade was opened.
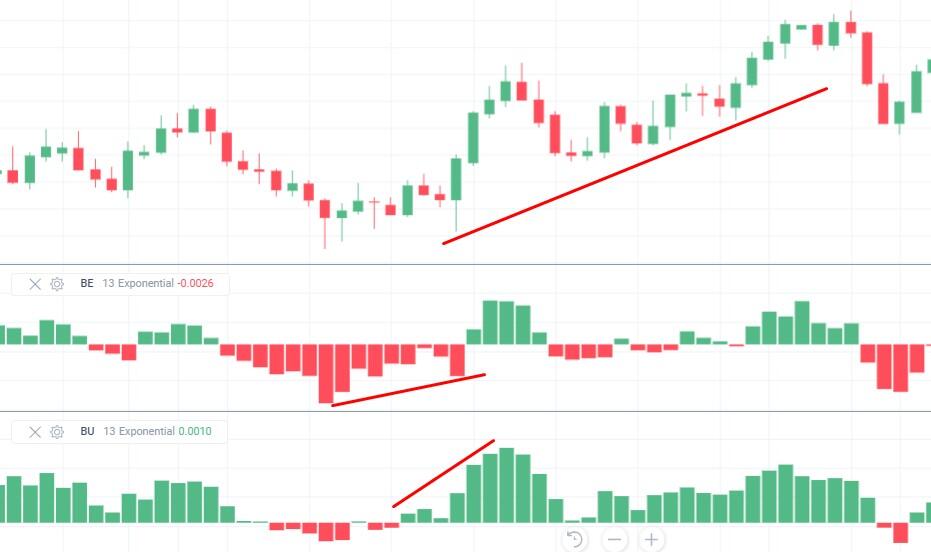
3. Trade on divergence.
Divergence is defined as a case when the price of an asset is moving in the opposite direction of a technical indicator, such as an oscillator. It can be determined by several price extremes. For example, the following conditions must be met for a short position:
-
The bull power indicator is above the zero line. The bars are gradually declining, forming at least two extremes. The second extremum must be below the first one.
-
The price is increasing. The second extremum is above the first one.
The very fact of the first condition indicates that the strength of buyers is fading, and the price may fall. If the price continues to rise due to the momentum in the market, it is a divergence – a reinforcing signal confirming the imminent reversal to the downside.
An example of a bearish divergence.
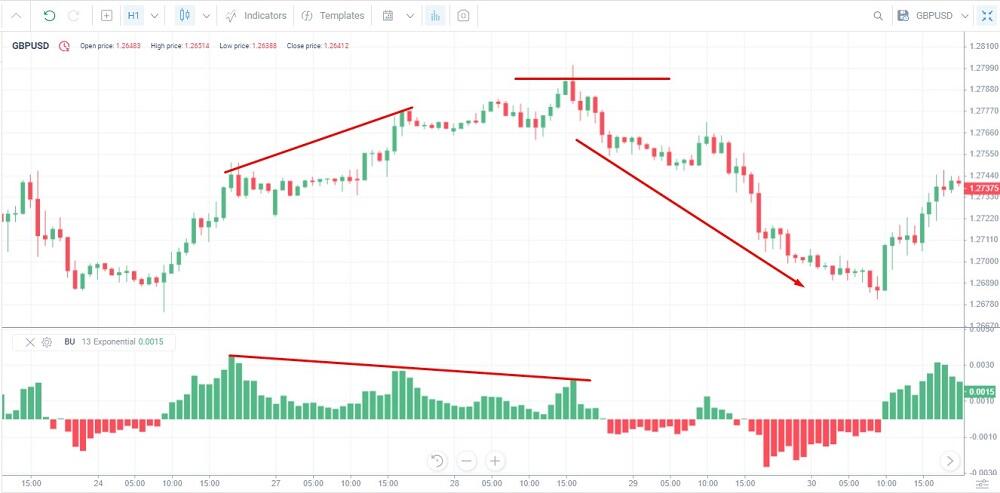
Let’s take the GBP/USD currency pair on the H1 time frame. Since it is necessary to reduce the scale of the chart in order to find divergences, higher time frames are out of consideration. The M15 – H1 time frames are suitable.
The bulls power indicator has drawn two lower highs above zero. The price has formed two higher highs, creating a divergence. In this case, the price will highly likely reverse to the downside. However, it requires patience and a properly placed stop-loss order. As you can see on the chart, the price continued to rise and Bulls Power made another lower high. After that, the bearish trend began.
There is a difference of just over 20 pips between the second and third price highs. This difference would have led to a drawdown if you had opened a short position after the second high.
Conclusion
Bulls Power and Bears Power indicators are two different indicators used to confirm a trend. Bulls Power measures the quantitative advantage of the buyers and their trading volume. Bears Power gauges the strength of the sellers. The indicators’ histograms are placed below the price chart.
Both bulls and bears power indicators are interrelated. When the strength of the buyers increases, the strength of the sellers decreases accordingly and vice versa. Most often, both indicators are placed on the chart at the same time, as they confirm each other’s signals and the signals generated by trend indicators.
-
Buy signal: Bulls Power is growing above the zero line. Bears Power is below the zero line, and the bars are decreasing.
-
Sell signal: Bulls Power is above the zero line, the bars are falling. Bears Power is below the zero line, the bars are decreasing.
-
Divergence reinforces the received signal.
Bulls and Bears Power Indicators FAQs
The difference lies in the calculation formula and in what the indicators display. Increasing values of the Bulls Power indicator says that buyers prevail in the market. The price will grow amid growing demand. An increase in Bears Power, on the contrary, indicates that there is an increase in sales in the market, so the price will decrease.
Calculation of the bulls power indicator is as follows: the value of the exponential moving average is subtracted from the maximum price value. Calculation of the bears power indicator: the value of the exponential moving average is subtracted from the minimum price value.
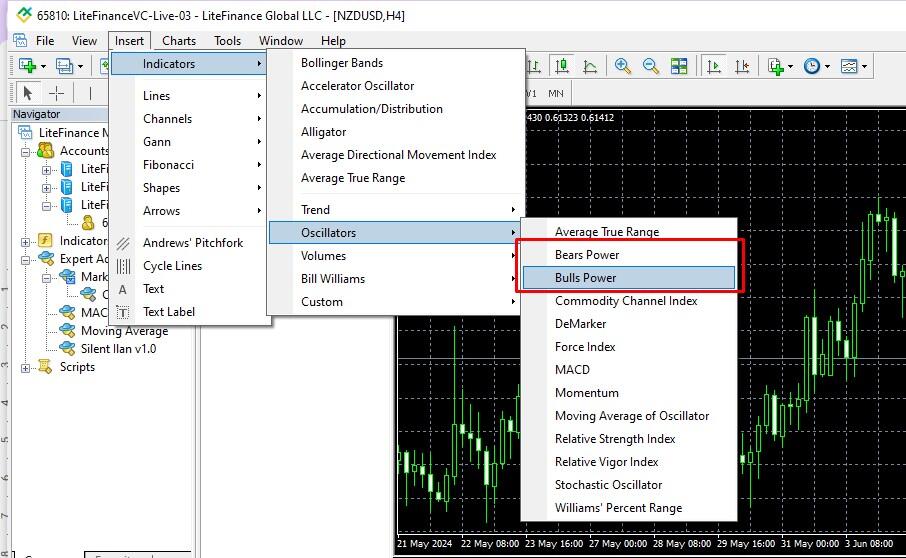
You can add the indicators to the chart by clicking “Insert – Indicators – Oscillators.” Once the indicator is plotted on the chart, you can look for signals confirming an uptrend or a downtrend.
These are additional indicators that can confirm the signals of the main trend instruments. If Bulls Power goes up after getting a bullish signal, it confirms an uptrend. If a bearish signal is received and Bears Power goes down, the indicator confirms a downtrend.
Yes, they can. However, it is necessary to choose different EMA values for each market and asset. In addition, the accuracy of indicator signals depends on the selected time frame and market volatility.
No indicator can guarantee a 100% accuracy. Every indicator should be applied to a specific time frame where signals are more or less accurate. That is why Bulls and Bears Power indicators are used with other tools that filter and confirm its signals. These are oscillators, trend indicators, resistance/support levels, patterns, etc.
They differ in their calculation formulas. Both indicators are an auxiliary tool for finding and confirming trends. Like other indicators, Bears Power and Bulls Power have their advantages and disadvantages.
The content of this article reflects the author’s opinion and does not necessarily reflect the official position of LiteFinance. The material published on this page is provided for informational purposes only and should not be considered as the provision of investment advice for the purposes of Directive 2004/39/EC.
{{value}} ( {{count}} {{title}} )
This post is originally published on LITEFINANCE.