Greetings, dear readers of our Forex blog. In this article, we will delve into profitable Forex strategies for beginners based on channel indicators, which often stand out as a distinct category. The essence of these strategies lies in identifying the opportune moment to open a position when the asset’s price breaches the channel’s boundaries or rebounds from them. In this regard, traders should hone their expertise to discern between a correction or price momentum and the prevailing trend in the market. This article provides a comprehensive overview of price levels and the trading strategies that employ them, along with hands-on guidelines that encompass several indicators.
The article covers the following subjects:
Best Pullback and Breakout Strategies on Forex
The foundation of any strategy involves identifying repeating patterns, regardless of whether the focus is on fundamental factors or technical analysis. For instance, one strategy could involve entering the market on the heels of significant events, such as news publications, or when several technical indicators generate a signal to open a trade. Another approach involves dividing a group into strategies based on the breakout of key levels or channels. An alternative strategy suggests that the price should return to a channel after it bounces from the channel’s boundary or a strong level. These strategies require traders to accurately predict whether the price will break through a significant level or rebound from it. In other words, it is essential to determine whether the trend fades or persists. This review provides a comprehensive overview of these strategies, including the various key levels and authentic examples of strategies that rely on channel indicators.
Prior to developing a customized trading system for the currency market, it is paramount to thoroughly grasp these and other Forex trading strategies and adhere to strict risk management rules. Inexperienced traders often lack a well-calibrated trading system, which is a key differentiator between them and professional traders. To develop a successful strategy, it is essential to devote sufficient time to studying financial instruments and trading on a demo account.
Trading Levels and Level-Based Forex Strategy
The psychological aspects of channel and level-based Forex strategies hinge on the notion that traders’ behavioral patterns in specific circumstances are analogous, and aligning with the predominant trends often yields substantial results. The underlying psychological principles are as follows:
- Each trader has a specific profit expectation and risk tolerance level, which is typically determined by large groups of take-profit and stop-loss orders at certain levels. As a rule, a large bulk of orders tend to gravitate to certain levels, creating support and resistance levels. The support level refers to the lowest price below which traders believe the market will not fall, while the resistance level denotes the highest price above which the market will unlikely rise. In other words, bulls do not let the asset’s price plunge below the support level, while bears prevent the price from increasing above the resistance level. In a nutshell, the strategy implies opening a trade in the opposite direction when the price reaches a key level and rebounds from it.
- A breakout occurs when a fundamental factor emerges, prompting traders to open positions even when the asset’s price moves to a strong psychological level. If a rebound does not occur, it can be assumed that a solid trend has emerged.
The chart shows the cryptocurrency market’s capitalization, offering a clear illustration of these behavioral patterns in trading.
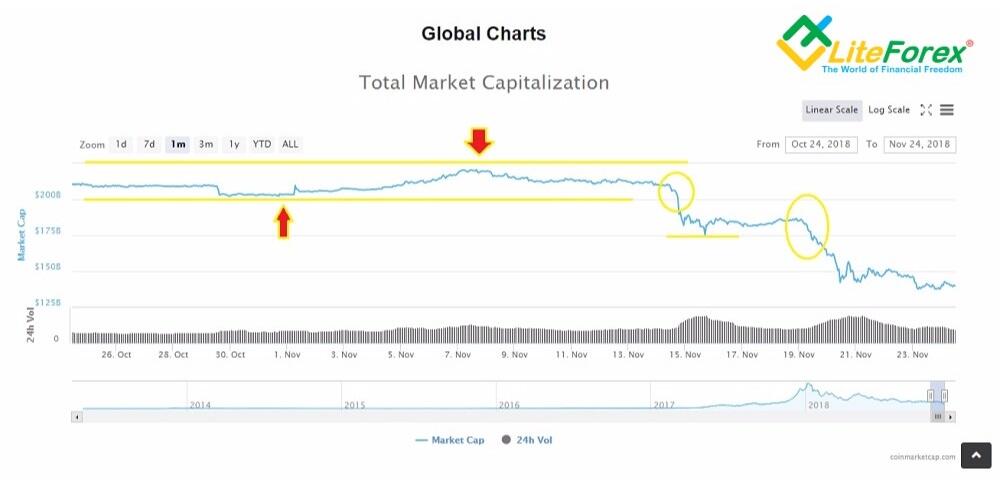
During the month, the crypto market cap oscillated between 200 and 225, failing to touch the upper or lower boundaries. However, a discernible trend is evident in the market’s movements, which exhibit a smooth progression from the lower boundary to the upper boundary and vice versa. The most profitable market entry points are indicated by arrows, which align with the capitalization chart of the top cryptocurrencies. Following a breakout of the 200 level in the first yellow circle, the market cap reached the psychological threshold of 175, where it remained within a narrow trading range for some time. The second yellow circle marks a new breakout, notching the onset of a strong downward trend.
The main challenge of this trading strategy is to determine whether a key level has been breached or if the asset’s price has pierced the key level and is poised to reverse. For this reason, we offer the following guidelines:
- Refrain from hastily opening a trade in the opposite direction once the price has reached the key mark. Instead, wait for a reversal or a continuation of the movement and subsequent correction.
- Similarly, if the price reverses and does not touch the key level, it may not be a reversal but rather a temporary pullback. In this case, the price will likely resume moving according to the prevailing trend and direction.
- Finally, pay close attention to the trend and the price movement. If the price has been trending smoothly for an extended period, followed by a steep increase or decrease in quotes, this may give a signal to open a trade. An illustration of this scenario is provided on the chart above, where the price sharply turns to the downside in the first yellow circle.
Types of Forex Levels:
- Fibonacci levels are an infinite sequence of numbers that follows a mathematical pattern. As practice shows, traders have found that Fibonacci levels offer a reliable reference point. The Fibonacci calculator will help you determine Fibonacci levels.
- Psychological levels. These are levels based on crowd psychology. For example, traders often consider price levels that end in zero or five.
- Historical levels. These are strong levels that the price revisits with a certain frequency over a long time span.
- Mirror levels. The price breaks through a certain key level, returns to it after a correction, and proceeds to move according to the main trend. For example, if the resistance level is broken, it becomes a mirror one and works as the support level.
- Pivot levels. These levels are based on statistics of opening and closing prices. We will dive deeper into these levels in one of the following strategies.
Channel or dynamic levels follow a similar principle. The only difference is that channel boundaries are represented by curved lines that change over time, adapting to the most recent price action. There are many channel indicators, and it is hard to say which of them is more or less accurate, as this depends on the current market situation and settings. Examples of such indicators will be introduced below.
Dynamic Channel Trading Strategy on Forex
This trading strategy is based on the Keltner Channel or KC indicator, which builds a dynamic price channel. It combines two classic tools:
- Exponential Moving Average (ЕМА);
- Average True Range (ATR).
The KC indicator draws a dynamic channel by adding and subtracting ATR values from the EMA. The correction factor, or the ATR multiplier by which the ATR data is multiplied, is specified in the settings and depends on a chosen currency pair. The idea behind the strategy is that in a calm market, the price moves within the channel near its average value. However, if the price deviates from its average values and approaches the channel’s boundaries, it tends to return to the middle of the channel. The EURUSD pair on the M15 time frame is optimal for the indicator settings. It is not recommended to choose a lower time frame. However, it may be possible to a higher time frame when trading other currency pairs if this will increase the number of true signals.
KC indicator settings: EMA period = 20, ATR period = 20, Factor = 1.5 (the coefficient by which the ATR value is multiplied). You can download the template for MT4.
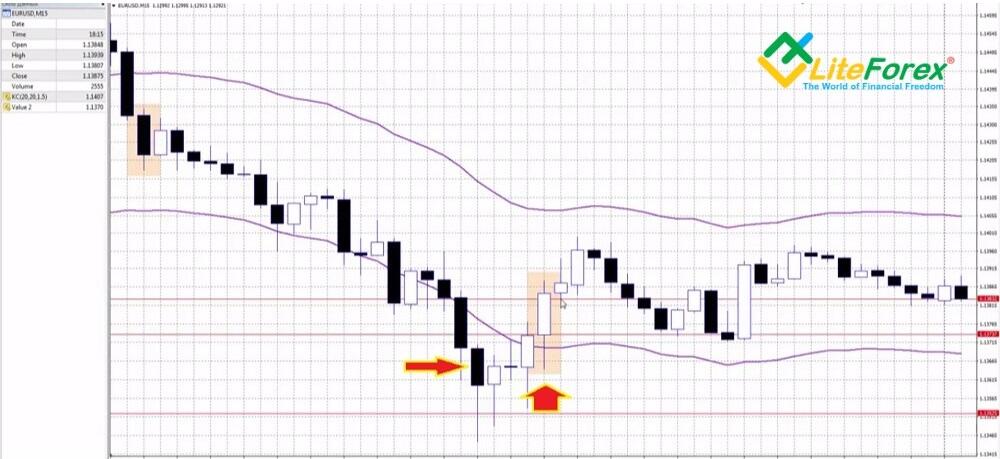
Opening a Long Trade:
- Make sure that at least one candlestick has gone beyond the lower boundary of the channel. The number of candlesticks should not exceed seven. Otherwise, a breakout of the channel will be followed by a new strong trend. Candlesticks should be located below the lower boundary of the channel.
- The distance between the lower dynamic line and the candlestick’s high should exceed 5 points.
- Once these conditions are met, a bullish candlestick appears on the chart and closes above the lower dynamic level. In other words, the price reversed, returning to the middle of the channel. The larger the candlestick’s body, the better.
A long trade is opened once the next candlestick emerges. A stop-loss order should be placed 15–30 points below the entry point. It is better to close your trade after the price reaches the middle of the channel. It is possible to close only 50% of your trade, and the rest can be left open. In this case, the stop-loss order can be moved to a breakeven point, placing a trailing stop order.
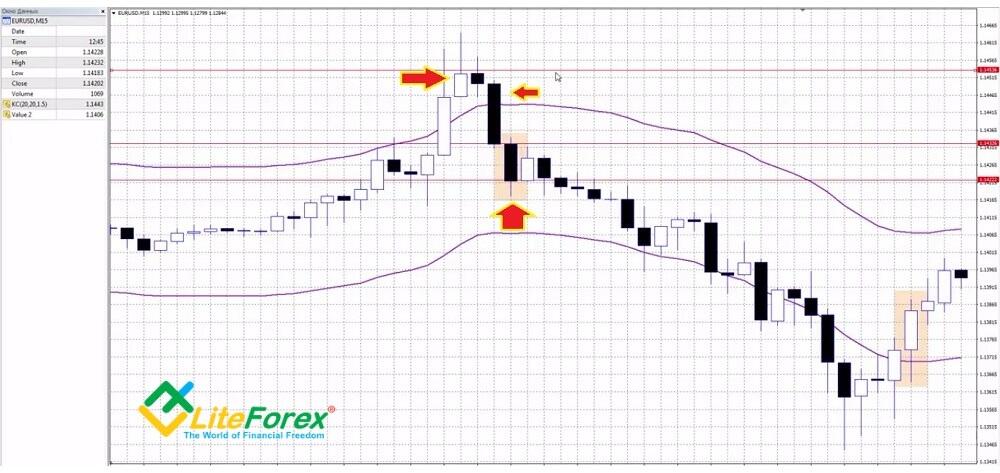
Opening a Short Trade:
- One or several candlesticks should pierce the upper boundary of the channel. The number of candlesticks should not exceed seven. The candlesticks should be located above the channel line.
- The distance between the upper dynamic level and the low of the candlestick should be more than five points.
- Once these conditions are met, a bearish candlestick will appear on the chart and close below the upper dynamic level. In other words, the price reverses and returns to the middle of the channel. The larger the body of the candlestick, the better.
The setup for opening and closing positions is the same. A candlestick reversal pattern formed outside the channel will generate an additional confirming signal.
The indicator performs optimally during periods of calm market movement. When news is released, it is better to refrain from trading, as a lot of false signals are more likely to appear during these times. It is also recommended to exclude trading in the Asian session and during flat market movement. If the channel appears visually narrower than in previous periods, it is better to avoid entering the market. In addition, it is advisable to refrain from entering a trade if the signal candlestick has reached or is close to reaching the middle of the channel.
Pivot Level Breakout Trading Strategy
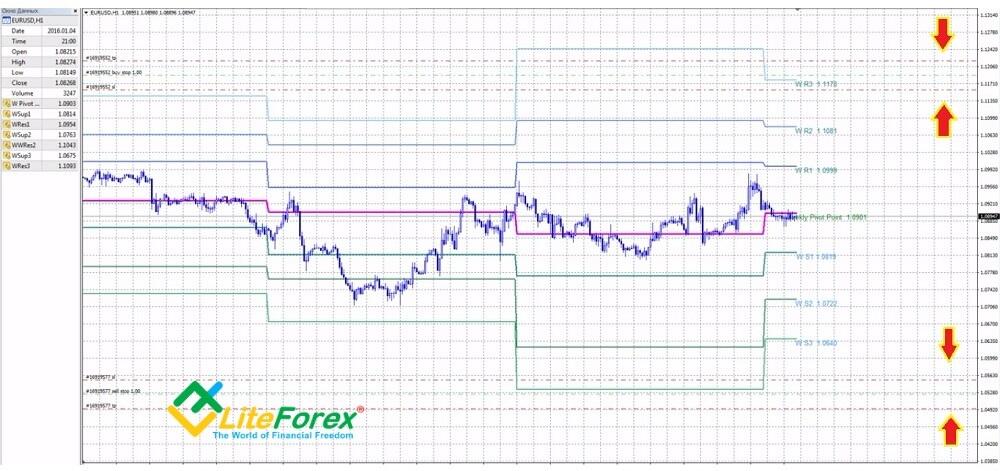
This strategy is based on a channel indicator (W1 Pivot) that determines pivot levels. The indicator plots weekly resistance and support levels on the chart, and profits can be made at the breakout of these levels.
Firstly, it is important to understand what pivot points are. A candlestick comprises a body and shadows. Shadows represent the maximum and minimum prices for the time interval, while the body’s extreme values represent the opening and closing prices. Pivot levels denote reversal levels, calculated using the following formula:
- R1 (resistance level) = (Price*2) – min.
- R2 = Price + max – min.
- R3 = max + 2*(Price – min).
- S1 (support level) = (Price*2) – max.
- S2 = Price – max + min.
- S3 = min – 2*( max – Price).
“Price” is a reference level, which can be calculated as follows: (max+min+close)/3, where “max” is the maximum price for a certain period, “min” is the minimum price, and “close” is the closing price of a candlestick. This calculation method is considered to be the most basic. Other methods exist, such as Woodie’s Pivot, Camarilla, DeMark, etc. You can test them yourself and share your opinion in the comments.
You can download the W1 Pivot indicator and apply it to any currency pair on the H1 time frame. W1 Pivot settings: fortsize = 10, labelShift = 0. The settings are purely symbolic, as the formulas are the same and cannot be changed.
Opening Long and Short Positions:
- Place a pending Buy Stop order at R3 + 10–20 points. For less volatile pairs, place a stop-loss order closer to the entry point.
- Set a pending Sell Stop order at S3 + 10–20 pips according to the same principle.
When it comes to trading breakouts, it is important to choose a suitable distance for your stop-loss and pending orders, as the price should not trigger them if the market faces elevated volatility. The approximate distance is 30–50 points, the same distance applies to a take-profit order.
Although the strategy almost completely eliminates the chance of a losing trade, it rarely generates buy or sell signals. Therefore, it is better to apply it to several currency pairs at once or use it as an additional one.
Dynamic Trend Trading on Forex
This trading strategy is considered to be both simple and intensive, keeping a trader in constant suspense. While it does not necessitate constant monitoring of trades and signals, it is important to recognize that the strategy tends to generate a lot of false signals. However, it has been observed that a few profitable trades can effectively offset losses and generate profits. The strategy is based on probability theory, which favors high-frequency trading. This means that it is possible to open one trade per day and incur a 100% loss or open two and have 50% of losing trades. The more signals there are, the higher the probability of success.
The Dynamic Trend indicator, on which the strategy is based, draws dynamic levels that constantly change with the price direction. Short and long trades are opened almost all the time. The strategy implies trading the EUR/USD currency pair on the H1 time frame, although it is possible to use the M30 time frame. You can download the Dynamic Trend indicator and apply the following settings: Percent = 15 (percentage of indicator deviation) and MaxPeriod = 50 (calculation period).
Opening a Long Trade:
- The price should move below the Dynamic Trend line for some time.
- A bullish signal candlestick emerges and closes above the indicator line, breaking through the dynamic level.
Open a trade once the signal candlestick closes. A stop-loss order should be set 50–100 points below the entry point. After the position has generated 50 points of profits, close one-third of your position; after reaching 100 points of profit, close another third and secure your trade with a trailing stop order. If the candlestick goes below the indicator line, it is better to close the trade prematurely.
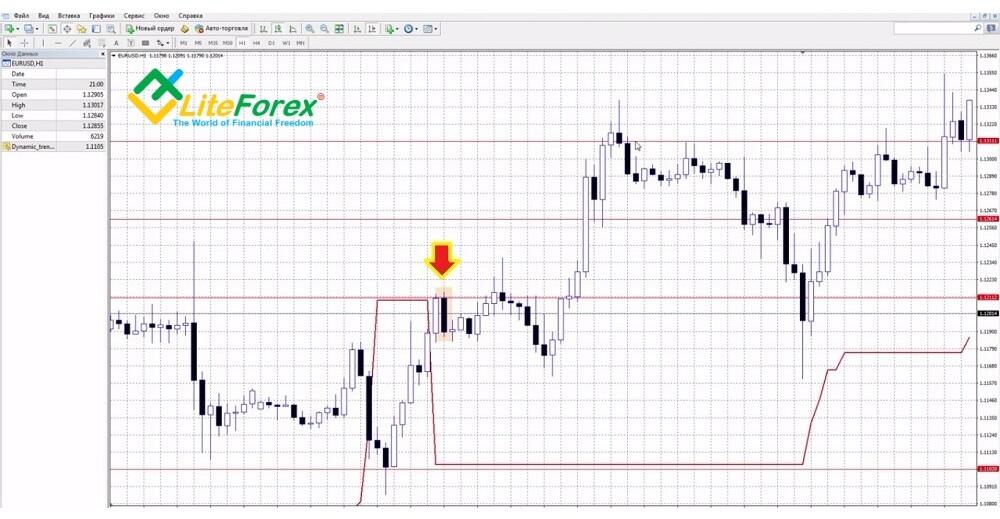
Opening a Short Trade:
- The price should exceed the Dynamic Trend line for some time.
- A bearish signal candlestick appears and closes below the indicator line, breaking through the dynamic level.
The same approach should be adopted when opening a trade, with traders required to act swiftly in the event of an error. Notably, the price can undergo a change in direction due to corrections, which poses a risk to traders who place stop-loss orders at a large distance from the entry point. You can adjust the rules for closing a trade or choose another currency pair. In addition, it is possible to move your trailing stop manually, although this will divert attention from monitoring open trades and signals. For those interested in exploring additional options, compare this channel indicator with other analogs, plotting Bollinger Bandsto the chart. At the same time, oscillators may not be necessary at this stage.
Conclusion
Channel strategies are straightforward in their application, and traders simply need to select an indicator, a currency pair, a time frame, and a suitable moment to open and close a trade. The following suggestions are provided to assist in this regard:
- Channel strategies require constant monitoring of charts so testing will require a significant amount of time.
- Avoid trading shortly after economic reports and news are published, and do not trade during the first two hours of Monday or the last two hours of Friday. Remember to close your trades before the weekend.
- Instead of opening as many trades as possible, it is better to limit yourself to a few trades and ensure that each is properly executed.
- Learn to feel the market. It is important to be able to take risks wisely, bearing in mind that perfect alignment of all market conditions, prices, and indicators is rare.
There is no one-size-fits-all approach; rather, successful trading strategies result from a confluence of market conditions, news, and indicators. In addition, your trading experience is paramount. The more you familiarize yourself with various tools and the more you practice, the more your market intuition will develop. For this reason, I recommend that you delve into new indicators, hone your skills on demo accounts, and embrace a calculated risk-taking approach. Best of luck in your trading endeavors, and please share this review with your friends and colleagues. I welcome your thoughts, remarks, and insights in the comments below.
P.S. Did you like my article? Share it in social networks: it will be the best “thank you” 🙂
Useful links:
- I recommend trying to trade with a reliable broker here. The system allows you to trade by yourself or copy successful traders from all across the globe.
- Use my promo code BLOG for getting deposit bonus 50% on LiteFinance platform. Just enter this code in the appropriate field while depositing your trading account.
- Telegram chat for traders: https://t.me/litefinancebrokerchat. We are sharing the signals and trading experience.
- Telegram channel with high-quality analytics, Forex reviews, training articles, and other useful things for traders https://t.me/litefinance
The content of this article reflects the author’s opinion and does not necessarily reflect the official position of LiteFinance broker. The material published on this page is provided for informational purposes only and should not be considered as the provision of investment advice for the purposes of Directive 2014/65/EU.
According to copyright law, this article is considered intellectual property, which includes a prohibition on copying and distributing it without consent.
{{value}} ( {{count}} {{title}} )
This post is originally published on LITEFINANCE.


