Scalping is a type of high-frequency trading that involves holding trades in the market from a few seconds to a few minutes. This trading strategy is complex, requiring maximum concentration, good reaction, quick decision making, and intuition. Nevertheless, scalpers can earn several times more per trading day than positional traders, profiting from corrections and sideways price moves.
This article will introduce you to the best indicators for scalping that help you find entry and exit points efficiently.
The article covers the following subjects:
Major Takeaways
|
Topics |
Key points |
|
Definition of scalping |
Short term trading strategy that involves holding trades in the market from a few seconds to a few minutes. A trader profits even from small market movements. |
|
Advantages of scalp trading |
There is no need to search for price trends; it works well during flat markets; it accepts small initial deposits; you can have trading results in a few minutes. |
|
Scalping drawbacks |
Emotional load; constant control over charts; big capitals influence the price; dependence on spread values. |
|
Best scalping indicators |
Combination of multiple indicators and oscillators: moving averages, Parabolic SAR, RSI, CCI. Additionally, one can use volume indicators to confirm strong short-term momentum. |
|
Best scalping strategies |
Key levels breakouts, trading with pending orders, news scalping, channel trading. |
What Does Scalping Mean in Forex?
Scalping is a short-term CFD trading strategy that suggests profiting from small price movements. It aims to compensate for broker fees using strong market momentum.
A few varieties of scalping are distinguished:
-
HFT (High-frequency trading) – high-frequency trading with zero spread, where trades are opened and closed in a split second. The strategy is implemented using neural networks. Some brokers may prohibit scalp trading due to a huge server load. Understanding how neural networks operate and how their Depth of Market orders may influence price movements is important.
-
Pipsing is a scalping strategy that involves trading on M1-M5 timeframes and holding a trade in the market for a few minutes. Trades can be opened manually, but most often, this is done by a trading advisor.
-
Classic scalping is trading on M5-M15 timeframes, holding a trade from several minutes to an hour. With a solid market trend, there is no point for a scalper to close the trade early.
If a good market trend emerges, scalping can shift to day trading. Everything will depend on the market situation.
Scalping advantages:
-
The trend is not important. Scalpers do not need a pronounced trend direction as they profit from price movements in either direction.
-
Big variety of trading strategies. Scalpers can earn from price movements unsuitable for trend traders, such as false breakouts, corrections, or sideways price movements.
-
Quick profits or losses. Scalping can yield results in a few minutes.
-
Fast paced nature of signals. A scalper can open several dozen trades daily, but the question is how efficient they are.
-
Suitable for small capital traders. One can start scalping even with a small capital since scalpers enter and exit trades quickly with small gains.
Scalping works in any financial market and with any financial instrument—currency pairs, stocks, commodities. Only high liquidity and volatility matter. Cryptocurrencies are ideal for scalping, but you may experience significant losses unless stop orders are used.
Drawbacks of scalp trading:
-
It’s essential to stay at the computer continuously or automate trading; however, automated systems should still be monitored.
-
Emotional stress and visual workload. A deep understanding of the market dynamics, quick decision making, and exiting trades quickly are important in scalping. Constantly monitoring charts and dealing with unsuccessful trades can be exhausting.
-
Limited simultaneous work with several assets. Usually, scalpers trade two or three assets maximum, as keeping track of all trades is physically impossible.
-
Small profits per trade. The goal of scalping is to lock in the minimum profit. If a strong trend emerges, scalpers may hold a position as long as they wish. However, the core principle of scalping is ‘a bird in the hand is worth two in the bush’—meaning it’s often best to lock in the profit available right now.
-
Significant dependence on the size of the spread, slippage, and asset liquidity.
-
Price noise, the influence of market makers on price fluctuations. Big capital traders may affect the price on short timeframes.
-
Trading results depend on the accuracy of price data.
Professional scalpers earn more than traders who do day trading. However, this is a challenging trading strategy not recommended for beginners. If you have not acquired enough experience yet, you can start with intraday strategies.
How Scalping Works
Scalping means trading on small timeframes and opening a trade amid slight price fluctuations in either direction. The M5 and M15 timeframes are most commonly used in scalping, while the M1 timeframe is a rare one. It’s nearly impossible to conduct analysis and open/close a trade on the one-minute chart, as trades typically remain in the market for 4 to 7 candlesticks. Using robots is an exception to the rule.
The main principles of Forex scalping strategies are the following:
-
Short-term trades. Scalpers work within a few minutes or seconds, seeking to make a quick profit from short price movements.
-
High frequency of transactions. Scalping involves making a large number of transactions during a trading session.
-
A scalper can open and close dozens of positions in a trading day.
-
Using small timeframes. Any intervals, including larger ones, are used for technical analysis, but when scalping, transactions are opened on small timeframes.
-
Precise entry and exit points. The ability to accurately determine the moment to open and close a trade is a key skill for scalpers. A late entry is unacceptable: even a 2-candle delay can turn a profitable trade into a losing one, as spreads will not pay off.
-
Risk management and short-stop losses. No holding on to losing positions. If the price reverses immediately after the opening, the trade is closed right away.
-
Trading assets with high liquidity and a minimal spread, close to zero.
-
Emotional stability. A trader must be able to make quick decisions, avoid emotions, and have good reaction time. Also, scalpers rely on intuition—automatism developed through experience.
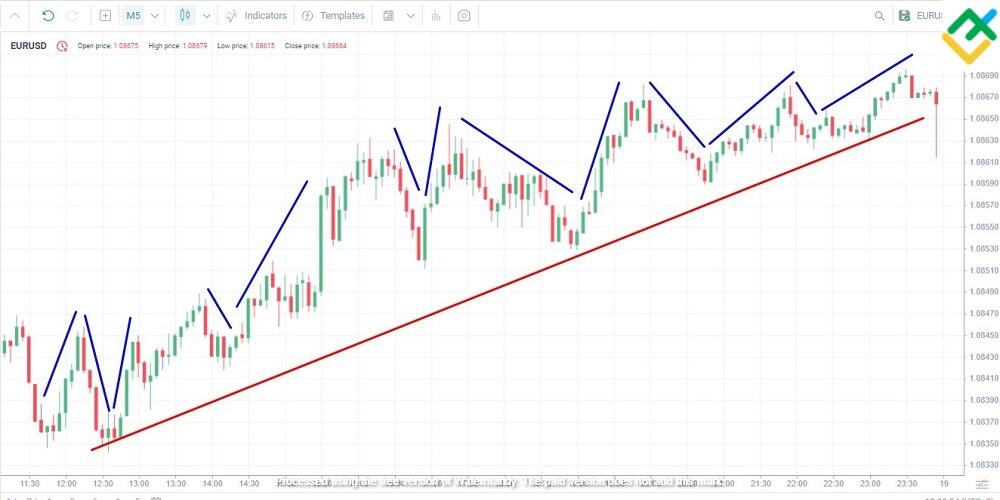
The picture above shows two different trading styles on the M5 timeframe. A position trader will wait for a trend to reverse, open a trade at the start of a new trend, and maximize its potential (red line). To protect against potential trend reversals, a trader will secure a position with a trailing stop and go through temporary corrections.
A scalper does not care about the direction of the trade (blue lines). They will constantly reverse positions, staying in the market for up to 10 candles. Some trades will be closed at a loss due to a short stop-loss, but the profitable trades closed with a take profit will cover these losses.
The Best Scalping Indicators
Testing basic indicators in a strategy tester suggests that they are instrumental in scalping, too. They can help identify potential entry and exit points in volatile markets on short timeframes. However, they operate differently: oscillators show potential trend reversal points, while trend indicators with short periods help detect short term trends.
Volume-Weighted Average Price (VWAP)
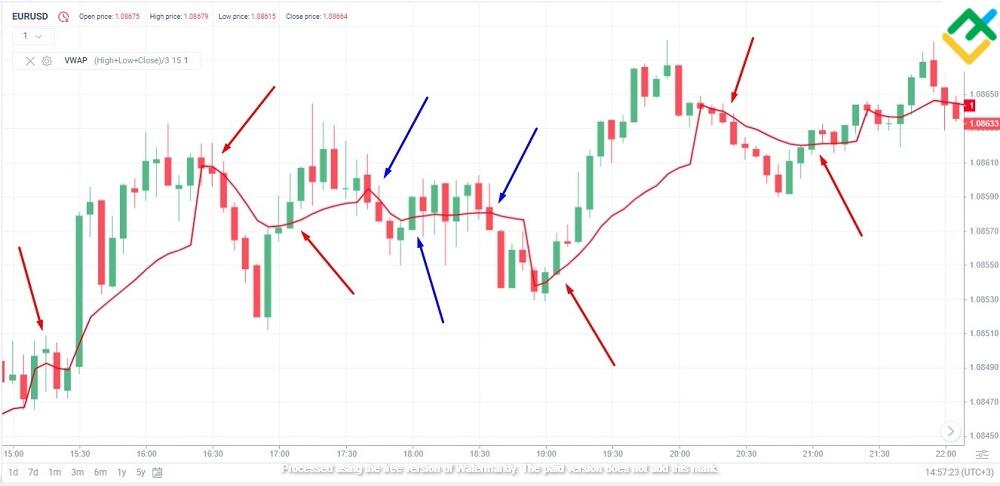
VWAP (volume weighted average price) is one of the simplest indicators. Its calculation algorithm considers a typical price and trading volumes on each candle. The typical price is the arithmetic mean of the open, close, and low prices.
Scalping indicator signals are similar to those of moving averages. If the price is above the VWAP line and moving upward, the trend is bullish; if it is below and moving downward, the trend is bearish. However, unlike moving averages, where a relatively short period is set, VWAP requires a longer period to allow the price to adequately identify trends.
Example:
A trade is opened on the next candle after the VWAP line is broken. Successful entries are marked with red arrows, with an average profit of about 7-10 pips, excluding the spread. Blue arrows indicate false entries, which are relatively few.
The stop-loss length is 3-4 pips. It is important not to delay the trade opening. A position can be opened on the candle that breaks the indicator’s line, though there is a risk of a false breakout in such cases. The trade is closed manually after achieving a profit of 5-7 pips or at the trader’s discretion.
Exponential Moving Average (EMA)
Exponential Moving Average (EMA) is a moving average that prioritizes recent prices, in contrast to simple moving averages. It is used to identify trends.
Compared to the SMA, the exponential moving average reacts more quickly to price changes, making it better suited for scalping. The period is reduced to 5-7 candles for a faster response to price changes. Buy and Sell signals are classic: a long position is opened if the price crosses the moving average from below to above. The EMA should also be directed upwards. For a short position, the opposite applies: the EMA is directed downwards, and the price crosses the moving average from above to below.
Example:
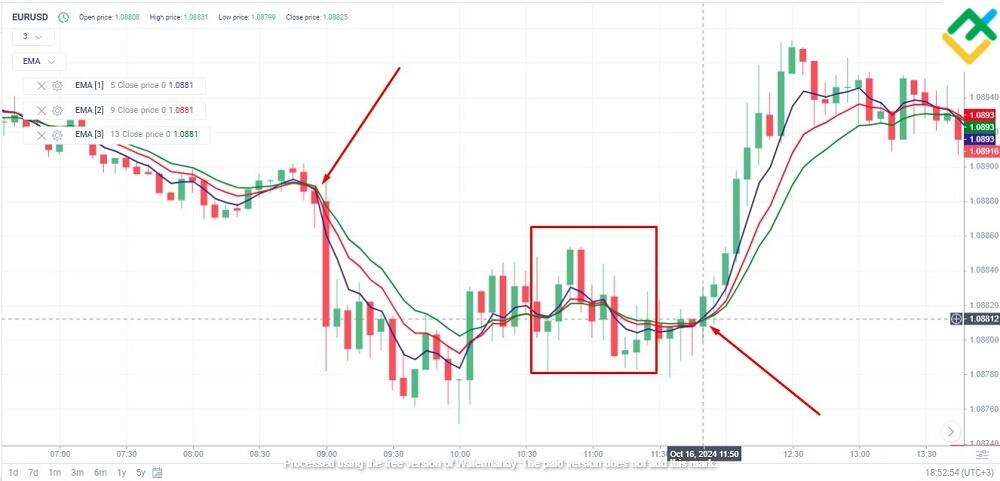
Three exponential moving averages with periods of 5, 9, and 13 are used to filter signals. A long position is opened if the moving averages cross below the candles and are directed upwards. A short position is opened if the moving averages cross above the candles and are directed downwards. For the M5 timeframe, the trade is closed once the price has moved 7-10 pips or when the moving averages reverse.
In the first case, when the small red candle closes below the moving averages at the moment of crossing and they begin to diverge, a short position is opened. In the second case, when the price closes above the moving averages at the moment of crossing and they start to diverge, a long position is opened.
However, false signals can occur, too. For instance, the moving averages have converged in the chart segment between the two positions, but the signals are false. Therefore, it’s important to wait for the divergence of the moving averages or filter signals using additional tools.
Bollinger Bands
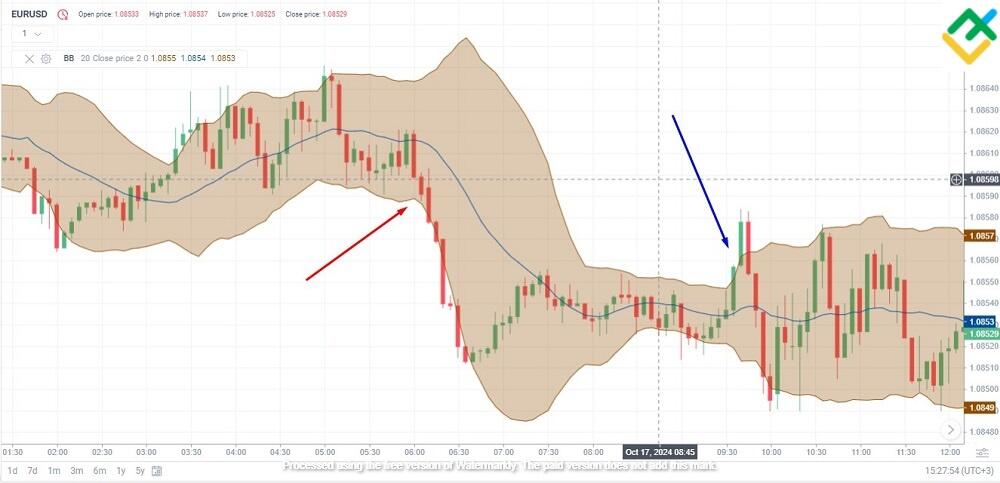
Bollinger Bands is a standard indicator based on moving averages. When the market is flat, the channel is narrow; with the market starts trending, the channel widens. Possible trading strategies:
-
A trade is opened when the price crosses the middle line. Crossing from below to above signals a long position, from above to below – a short one.
-
When the channel expands, a trade is opened in the direction of the expansion. A long position is opened if the price touches the upper boundary and the channel expands further.
There can be many false signals, so it’s better to filter them.
Example 1.
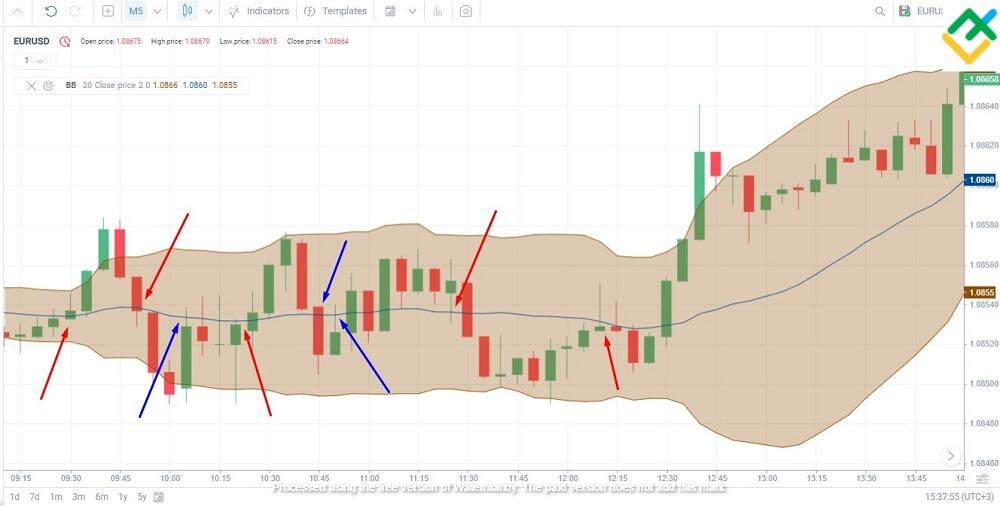
The idea behind capital management using Bollinger Bands is simple: crossing the middle line by the price is a buy or sell signal even if the price returns to the previous level after crossing, and only the shadow of the candle has crossed the line. The stop-loss order is placed at the boundary of the channel. The screenshot shows that five crossovers worked well, while three did not. The weak point of this strategy is its profitability. On the M5 timeframe, the price movement from the middle of the channel to its boundary averages 4-5 pips, excluding the spread.
Example 2.
This is an example of a second strategy. In the first case, the channel expanded as the price decreased. We open and hold a short position in the market to earn 7-10 pips. The size of the candle bodies can also give important clues: if the candle bodies reduce, the trend is fading. As soon as the first green candle closes, the trade must be closed. In the second case, the signal was false: the price reversed downward after the channel’s breakout and expansion.
Stochastic Oscillator
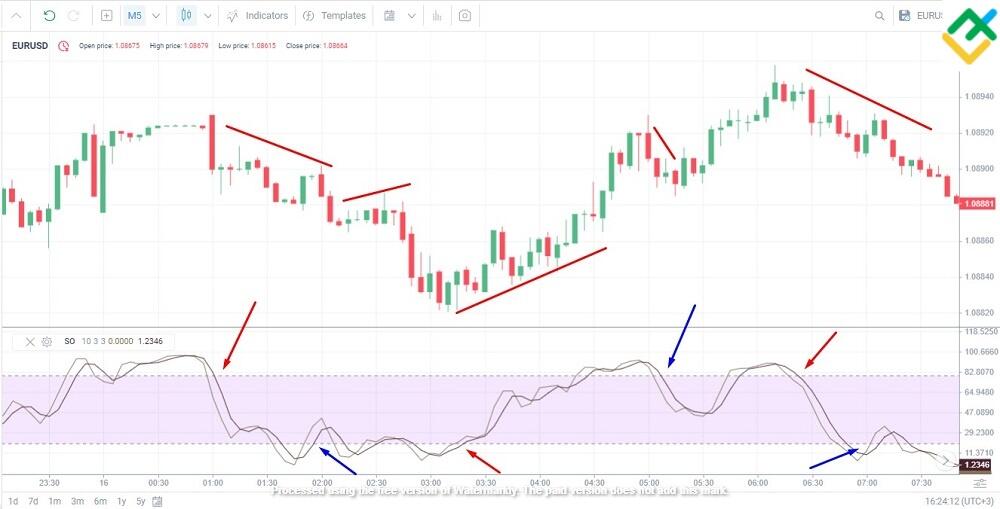
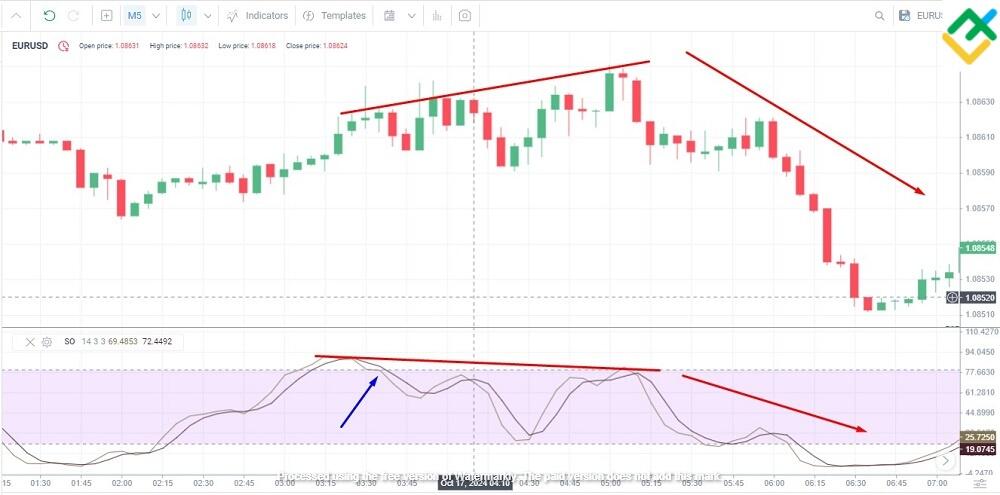
The Stochastic Oscillator is a technical indicator that signals overbought or oversold conditions. The core idea of the strategy is to buy in the oversold zone and sell in the overbought zone. Some sources also suggest divergence as a signal. However, waiting for divergence can be time-consuming, and several types of divergences exist. In scalping, where trading decisions need to be made instantly, relying on divergence can be more harmful than helpful.
Example 1.
A signal is produced when both stochastic lines cross and leave the overbought or oversold zone. Out of six signals, three are effective, while three are false. The stochastic indicator is, therefore, used in scalping only as a confirming tool in combination with trend indicators.
Example 2.
An exit of the stochastic from the overbought zone (marked by a blue arrow) was a false signal as the trend continued upward. Divergence formed: subsequent indicator peaks are lower than the first, while the price keeps setting new highs. This signals an upcoming trend reversal.
Relative Strength Index (RSI)
The relative strength index rsi determines overbought and oversold conditions and thus finds potential reversal points. You can use RSI as a confirming tool for a channel indicator:
-
If the price has touched the channel’s upper boundary, with RSI in the overbought zone and directed downward, that’s a signal to open a short position.
-
Conversely, when the price touches the channel’s lower boundary, and the RSI indicator is in the oversold zone and directed upward, it signals an opportunity to open a long position.
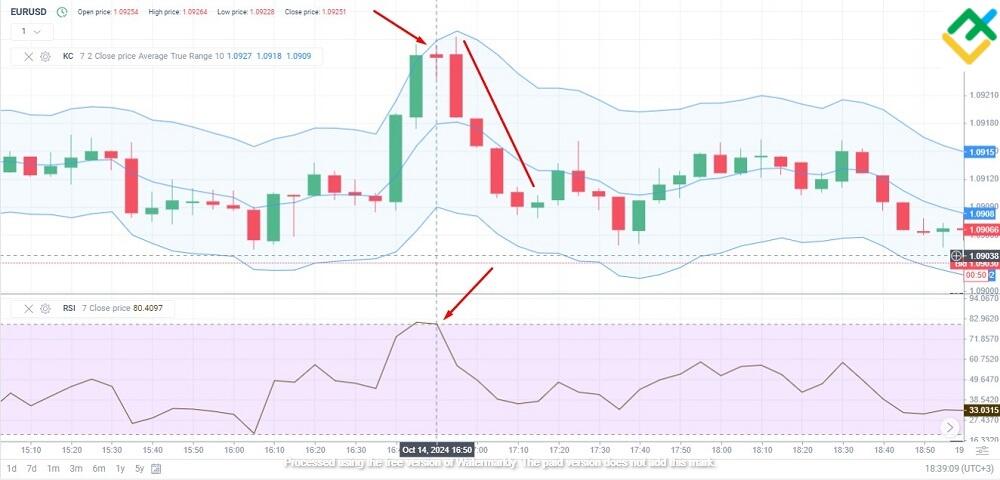
How fast a signal is produced is extremely important on shorter timeframes, hence two recommendations. First, narrow the zone boundaries to filter out false signals—from 70 and 30 to 80 and 20, respectively. Secondly, increase the indicator’s sensitivity by reducing the period from the default “14” to “7.” This change means the calculation considers only the last seven candles instead of 14, making recent price movements more influential.
Example:
After touching the upper boundary of the Keltner Channel (set to a period of 7, like the RSI), a small doji candle forms. That is a reversal signal, confirmed by the RSI oscillator directed downward at the overbought boundary, so we should open a short trade before the first green candle appears. The appearance of this green candle can be anticipated by observing a reduction in the body of the descending candle.
If entered and exited slightly later, the trade duration would be approximately 20-25 minutes, yielding 14 profit points, excluding spread. Additional tips: rely on patterns for further guidance. Aim for a profit target of 7-10 points and close half the position at this level. Set a trailing stop for the remaining half to exit the trade accordingly.
Parabolic SAR Indicator
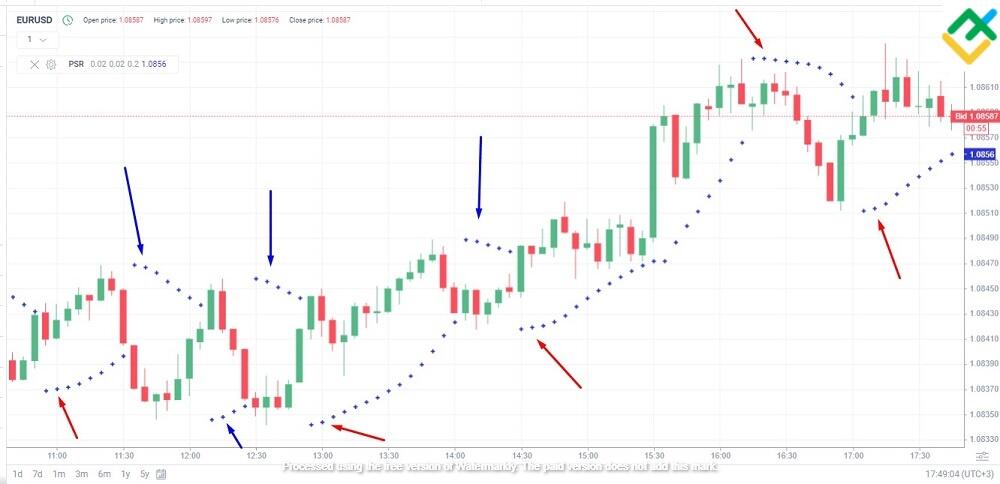
Parabolic SAR is a trend indicator that identifies a trend direction using a series of points located above or below the price. The idea behind the trading system is as follows: as soon as the indicator shifts position, open a trade in the direction of the signal at the third point.
Red arrows mark successful signals, while blue arrows indicate false ones. The ratio of successful to false signals is 5:4. Even with a tight stop-loss, the successful signals would have covered the losses due to movements lasting over 5-7 candles. However, the second successful trade (the second red arrow) would likely have been closed by a stop-loss because two red candles appeared after the upward signal, and the third green candle had a long lower shadow.
There are several risk management options:
-
You can open a position at the first point. With a tight stop-loss, early entries would result in two losing trades of 5 points each and one profitable trade of 15 points.
-
Filter signals, use oscillators, and consider support and resistance levels and trend lines.
-
Adjust the indicator settings to the volatility of the specific asset in the strategy tester.
-
It’s crucial to accurately calculate the optimal stop-loss length to avoid large losses but ensure that potentially profitable trades would not be closed due to minor pullbacks.
Commodity Channel Index
CCI is another basic oscillator that shows the degree of price deviation from its average value. The greater the deviation, the likelier a reversal. Signals: The price goes outside the “100; -100” range and remains beyond it for some time. Trades can be opened when the lines “100” and “-100” are crossed: in the first case, it’s a sell signal, and in the second—a buy signal.
Example:
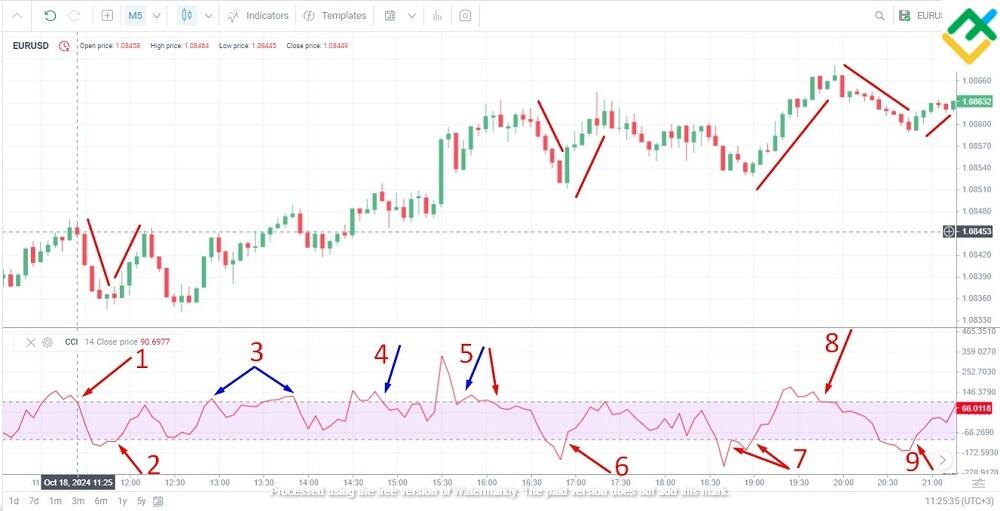
For a 5-minute timeframe, the indicator period is set to 14. With a smaller period, the indicator will not have time to exit the range, so the number of signals will decrease sharply, but the accuracy will remain the same.
Let’s break down the indicator’s signals on the chart above:
1. A timely trade allows profiting from a short position with a three-candle price movement. The trade closes when the indicator reaches the opposite border of the range. Profit – 8 points, excluding spread.
2. A mirrored scenario for a long position. The profit is again around 7.5-8 points in a flat price movement.
3. Such signals should be ignored. The price barely left the range.
4. False signal.
5. The first touch is a false signal. A sell trade opened after this signal would likely have been closed by a tight stop loss, but a repeat trade would have yielded a profit of 7 points.
6. Effective signal with a profit of 8-9 points.
7. This situation is similar to signal “5.” CCI touches the lower range boundary and bounces off it. However, there’s no stop-out. A long position would have yielded a minimum of 7 points with an early exit (when the indicator touched the “100” boundary) or 13 points if the movement had been exploited to the fullest.
8. Accurate signal with an indication of a trend direction, minimum profit of 6 points.
9. Precise signal, profit of 7-11 points.
Opening a trade exactly when the indicator touches the range boundaries is crucial to avoid late entries.
Using the CCI as a confirming or primary indicator combined with additional filtering tools is best. Testing results show that the CCI does not work well with the Stochastic and Relative Strength Index (RSI). In most cases, the oscillators’ signals diverge by 2-3 candles, and attempting to confirm a signal leads to late entries. Chart analysis effectively filters CCI signals.
Scalper Dream
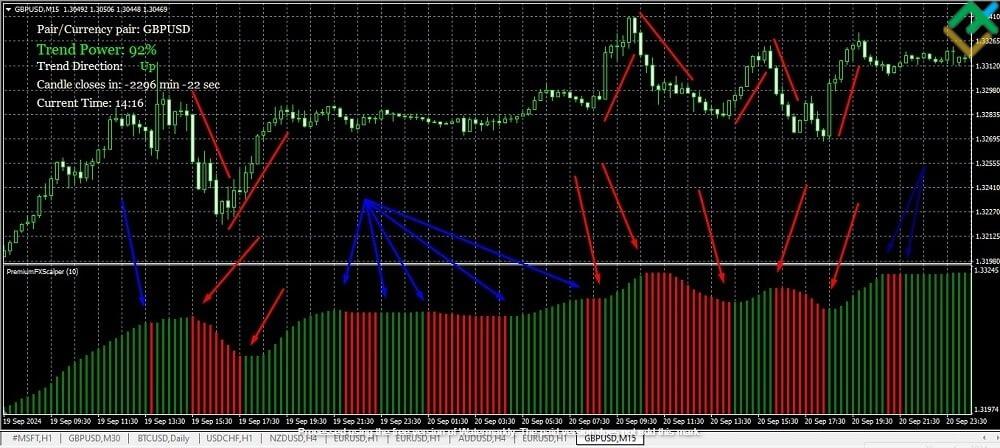
A popular indicator that is not a basic one. It is used to identify trends. You can download its free version for MT4 via this link. It looks like a histogram with columns of two colors. A change in column color from red to green signals an opportunity to open a long position, while a change from green to red signals an opportunity to open a short position.
A few nuances:
-
When the histogram color changes, the trend strength in the additional information window must be above 65%, or the signal is false.
-
If, before colors change, the indicator has displayed columns of equal height for a long period, it indicates a flat market. In this case, it is better to ignore the signal.
Scalper Dream has very few settings. The main ones are the period (which should be set to 10-15 for scalping) and the position of the informer.
Timeframe: M15, financial instrument: GBP/USD, indicator period: 10. False signals are marked with blue arrows and successful ones with red arrows. The screenshot shows that all signals are false during flat market periods when histogram columns of different colors have equal height. Thus, column height and trend strength are additional mandatory filters.
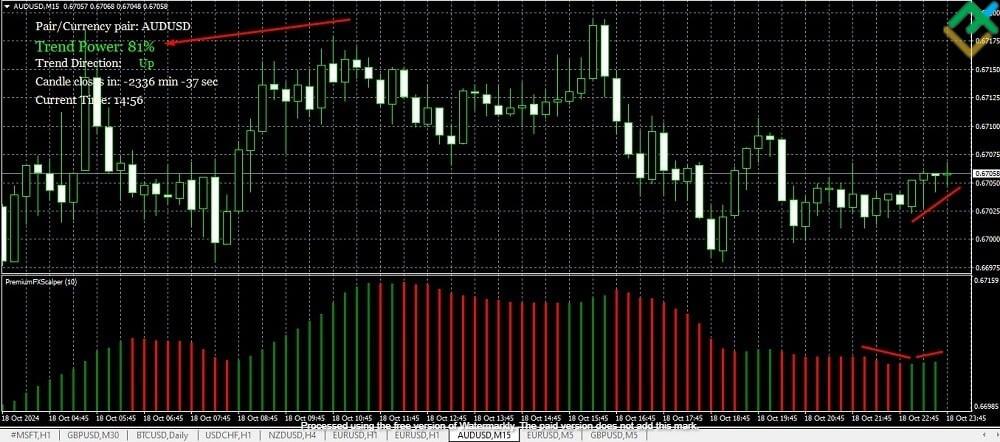
The red columns on the AUD/USD chart have a slight downward slope, and the green columns have a slight upward slope. The informer shows a trend strength of 82% with a recommendation to “buy.” You can take the risk and open a long position.
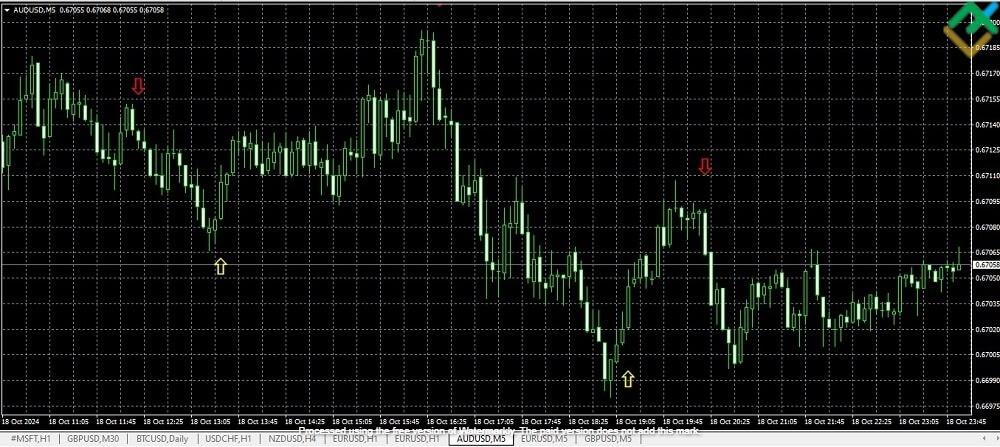
Binary Cash
Originally, this technical indicator was developed for binary options. However, it proved so effective that it also began to be used in MT4. It is a “pointer”: the red arrow pointing down recommends opening a short position, while the yellow arrow pointing up recommends a long position. You can download its free version for MT4 via this link.
The faster EMA is set to 5, and the slower EMA is set to 200. If you set the latter to 100 in this version, the indicator will not work. One drawback of this indicator is that signals are produced infrequently, with up to 4-6 signals on the M5 timeframe during a trading day.
Is Forex Scalping Profitable?
This question applies to all types of trading systems and strategies, and there is no definitive answer. The profitability of a strategy primarily depends on your ability to spot optimal moments for opening/closing trades, read and filter signals, optimize trading systems, and control your emotions. Attempts to claw back losses, greed, FOMO, and excessive enthusiasm can make any strategy unprofitable.
These are some factors and tools that can increase the effectiveness of scalping strategies:
-
Narrow spreads. The trader’s task is to capture short-term price movements and close the trade as quickly as possible before the price reverses. Concerningly, ECN accounts are most often used for scalping. They provide traders floating spreads starting from 0 pips due to the absence of a markup, but there is a commission for each completed lot. This pricing structure is more advantageous for the trader when opening multiple trades. For example, LiteFinance’s fee is 5 USD for trading currency pairs.
-
High liquidity. Lack of liquidity means there is no counterparty to the trade, which makes it impossible to quickly buy or sell an asset. As a result, you have to accept a less favorable price, leading to a wider spread and increased transaction costs.
-
Volatility levels. A price move worth ten pips can occur in 10 or 5 minutes. In the latter case, the asset is more volatile, which is advantageous for a scalper. So, scalping is often most effective during the release of important news. The timing of trading sessions is also important. For example, scalping on the EUR/USD pair is most effective during the overlap of the European and U.S. trading sessions.
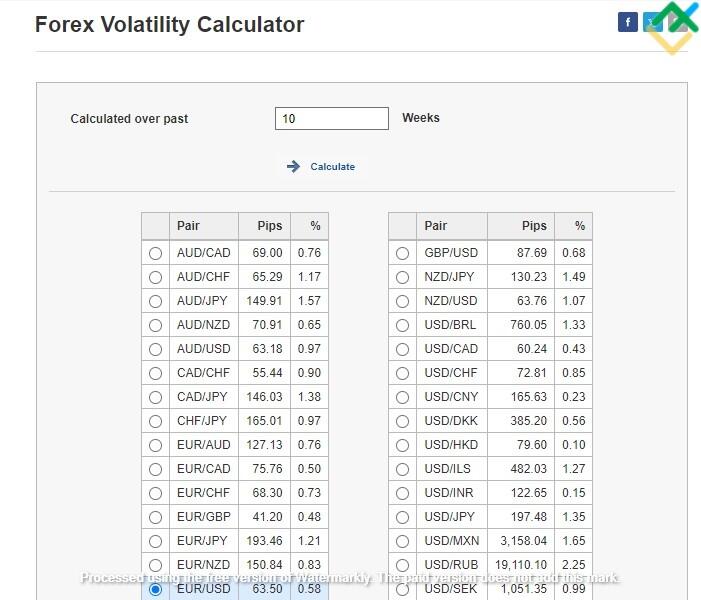
You can use a calculator for currency pairs that shows average volatility over a specific period.
Here’s another tip: use multiple chart scalping. It’s important to understand the main trend direction. Find the trend on the H1 chart, have it confirmed locally on the M15 timeframe, and then open trades on the M5 chart.
-
Automation of trading: In manual trading, the trader must constantly monitor the chart, responding instantly to changes in market conditions. As signals appear frequently, the trader often doesn’t have time to switch to another asset. This is emotionally exhausting and can negatively impact eyesight. The solution would be an Expert Advisor, programmed with a scalping algorithm, which allows opening multiple trades simultaneously.
-
Rest. Take short but frequent breaks to relieve some of the tension.
As for the technical optimization of scalping strategies, the following recommendations may be useful:
-
Use a multiple timeframe tactic. A pronounced trend on the M30-H1 timeframe is a good signal for scalping on lower timeframes.
-
Combine tools, but don’t go overboard. The main signal comes from trend or channel indicators, the secondary signal — from Price action patterns or levels (local support/resistance and trend lines), and the confirmation signal comes from oscillators. To confirm local price spikes, you can also use volume indicators.
-
Use short periods in indicator settings but within reasonable limits. The shorter the period, the faster technical indicators react to price changes. But this also increases the likelihood of false signals.
-
If possible, learn to work with the order book. It shows the levels at which orders are placed and their volume so that you can identify areas with the highest order accumulation and find “smart money” orders – large capital driving price movements on short intervals.
And I tell you again: yes, Forex scalping can be profitable. Whether it will be profitable and how much it can yield depends primarily on you.
Conclusion
Let’s review what we have learned about scalping.
-
Scalping is a high-risk trading strategy that involves opening trades on timeframes of M1 to M15 and closing them within 3-5-8 candles, with a target profit level of approximately 7-10 pips.
-
The key to success is immediate entry at the first confirmed signal. A delay of just one candle can turn a profitable trade into a losing one.
-
To make indicators trigger as quickly as possible, set the period to 5-9. This rule applies to most indicators.
-
The best indicators for scalping are those that you are comfortable working with. Classic oscillators such as CCI, RSI, the Moving Average Convergence Divergence (MACD) with the signal line, and Stochastic can provide both primary and confirming signals. You can also use trend indicators (such as the Momentum indicator) and identify sharp price impulses by spotting increased trading volumes. Signals can be confirmed through chart analysis.
-
Any strategy is first tested in a tester and then on a demo account. A scalping strategy that works well in manual mode should be automated using an expert advisor.
There is an opinion that manual scalping is a thing of the past. Traders have been replaced by neural networks with machine learning that instantly analyze the market, consider fundamental factors, and place orders faster.
This is not entirely true. HFT neural networks compete with each other, not with retail traders. So, the task of a retail trader is to abstract from other market participants. There is volatility and trading volumes; there are trends and reversal patterns. There are no other market participants – only trends and patterns. These need to be found and used to generate profit. Don’t be afraid to take risks – open a demo account and try your hand at scalping.
Forex Scalping Indicators FAQs
The best or the worst indicator does not exist. Some indicators produce as many efficient signals as possible under certain conditions. The results depend on factors such as the trading session, timeframe, indicator settings, current fundamental conditions, and the combination of scalping indicators with other tools. The optimal combination can be determined using a strategy tester.
ClusterDelta_#BookMap best suits the stock and futures market and volume-based scalping. It comes with a free trial version. Ultimate Pro Scalper is ideal for Forex. There are still many indicators that provide accurate signals and valuable insights for free. You only need to adapt them properly to a specific market situation.
Each indicator has its formula and principle for generating signals. Their accuracy depends on the settings, current volatility, fundamental factors, etc. The relative strength index rsi (considered auxiliary) may be more effective on one timeframe, while trend-following moving averages may be more effective on another. Test and select a combination of tools for better performance.
Yes, but as an additional oscillator for confirming signals. A few tips: reduce the standard period of 14 to 5-7. This will increase its sensitivity to price changes – you will get a faster response from the indicator. Also, narrow the key zone boundaries – from 70 to 80 and from 30 to 20. This will help filter out false signals during high volatility.
A strategy where signals are given by a combination of trend indicators and oscillators. For example, a combination of EMA and CCI. You can also use a combination of channel indicators and oscillators. For example, Bollinger Bands and the Relative Strength Index (RSI).
You need short periods to make the indicator respond as quickly as possible to price changes. For M1-M5 timeframes, the moving averages EMA(5)-EMA(9) are ideal; these will show the average value of the last 5-9 candles, respectively. For M15, you can use EMA(12). However, these parameters are individual, depending on current volatility and the asset type. As an option, you can use EMA to determine the intraday trend, combined with EMA(20) and EMA(9) to find short-term impulses.
Yes, but there are nuances. To reduce the likelihood of lag, lower the standard settings from (12, 26, 9) to (5, 13, 3). This option is optimal but not perfect. How much to reduce each parameter depends on the timeframe (M1, M5, M15) and the asset’s volatility level. The higher the volatility, the smaller the parameter values – the indicator should respond instantly to sharp price changes.
This depends on the chosen asset and trading platforms. Forex has no single volume aggregator, so tick volumes are used. This indicator shows the number of price changes, not the actual quantity of units bought or sold, as real volume does in the stock market. Classic indicators like Volume and VWAP are therefore used for Forex.
The content of this article reflects the author’s opinion and does not necessarily reflect the official position of LiteFinance. The material published on this page is provided for informational purposes only and should not be considered as the provision of investment advice for the purposes of Directive 2004/39/EC.
{{value}} ( {{count}} {{title}} )
This post is originally published on LITEFINANCE.

