A Bearish Harami is a widely recognized candlestick pattern in technical analysis that signals a potential trend reversal. This pattern often marks the end of an uptrend and foreshadows a price decline, referred to as a bearish movement. Traders use this pattern to decide when to exit a long position or initiate a short one.
A Bearish Harami pattern indicates weakening bullish momentum and aids in making informed trading decisions based on the analysis of the current market situation. Whether you are an experienced trader or a beginner, understanding a Bearish Harami candlestick will help improve your trading performance. The pattern is commonly used in combination with other indicators for more accurate signals, which increases the probability of successful trades.
This article explains how to identify a Bearish Harami candlestick pattern, detailing its key characteristics and effective trading strategies. Besides, it explores a Bullish Harami pattern, which is the opposite of a Bearish Harami and signals the potential start of an uptrend.
The article covers the following subjects:
Major Takeaways
- A Bearish Harami pattern is a reversal candlestick formation that signals a possible change from a bullish to a bearish trend.
- A Bearish Harami pattern consists of two candles. The first candle is a long-bodied green candle which is followed by a small red candle. Conversely, a Bullish Harami suggests a transition from a downtrend to an uptrend.
- The pattern usually emerges after a prolonged price growth, suggesting that the buying momentum is starting to fade. To open a profitable trade, it is crucial to wait for confirmation of the reversal, often indicated by the formation of a subsequent bearish candle.
- A Bearish Harami has proven effective on both daily and weekly time frames. To improve trading accuracy, it is beneficial to combine the Bearish Harami with resistance levels and additional technical indicators, such as the EMA, SMA (moving averages), or RSI.
- Single candlestick patterns can also be used to identify shifts in market sentiment. However, unlike a Harami pattern, a single candlestick can provide less reliable signals and requires confirmation.
What is a Bearish Harami Pattern?
A Bearish Harami is a two bar Japanese candlestick pattern that suggests a potential reversal after an upward trend. It consists of a long bullish candle followed by a smaller bearish candle, entirely within the range of the first one. This pattern indicates a weakening uptrend and a potential downward reversal, helping traders make informed decisions using technical analysis.
A Bullish Harami is the complete opposite of a Bearish Harami pattern. It features a large bearish candle followed by a second smaller bullish one within the first’s range. A Bullish Harami pattern indicates a potential trend reversal from bearish to bullish, making it a perfect point to open long trades.
A Bearish Harami pattern forms when a small red candle appears after a large green one, signaling market indecision and waning bullish momentum. This bearish reversal pattern is useful for identifying potential exit points for long positions or entry points for short trades. A Bearish Harami can appear on daily or higher time frames, making it a versatile tool for different types of trading.
What Are the Key Characteristics of the Bearish Harami Pattern?
A Bearish Harami candlestick pattern has a number of key characteristics that help traders recognize it on the charts and make trading decisions:
- Candlestick pattern. The pattern consists of two candlesticks — the first large bullish candlestick and the following smaller bearish one contained within the body of the first candle.
- Trend reversal. The formation of a Bearish Harami at the end of an uptrend can signal a potential reversal. It indicates that buying activity is diminishing.
- Signal confirmation. Once the pattern emerges, it is essential to wait for the next phase, when a bearish candle appears, confirming the trend reversal.
- Point of uncertainty. The Bearish Harami signals growing market uncertainty as bullish momentum weakens and indecision rises.
- Occurrence. The pattern is particularly effective if it appears near resistance levels or after a long upward movement, increasing the probability of a reversal.
- Sharp volume decline. Sometimes, a decline in trading volume can be observed during the formation of a Harami pattern, which may provide extra confirmation of a potential trend reversal from bullish to bearish.
A Bearish Harami is a valuable tool for predicting price movements and conducting technical analysis. Recognizing a Bearish Harami candlestick pattern reduces risks and improves the chances of successful trading.
Bearish Harami Example
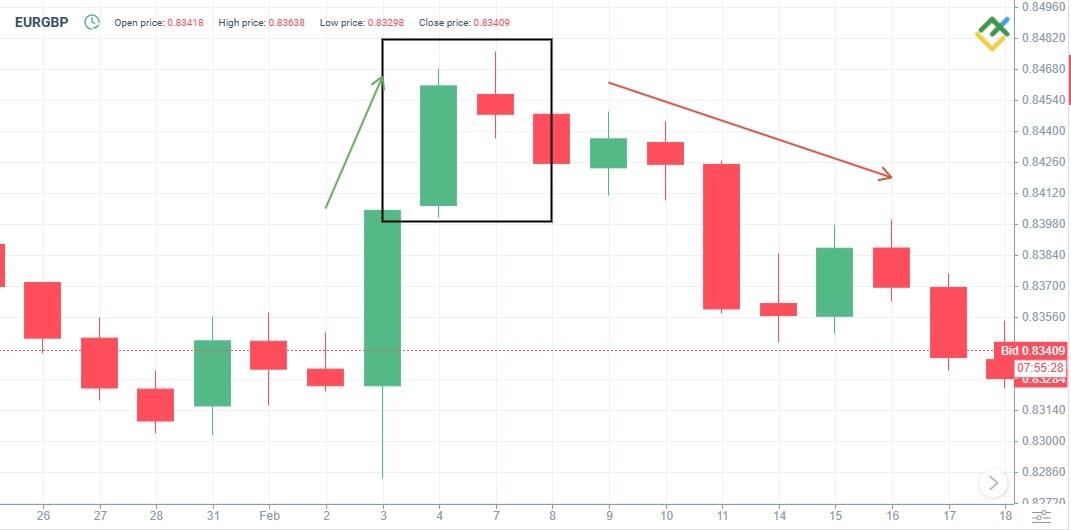
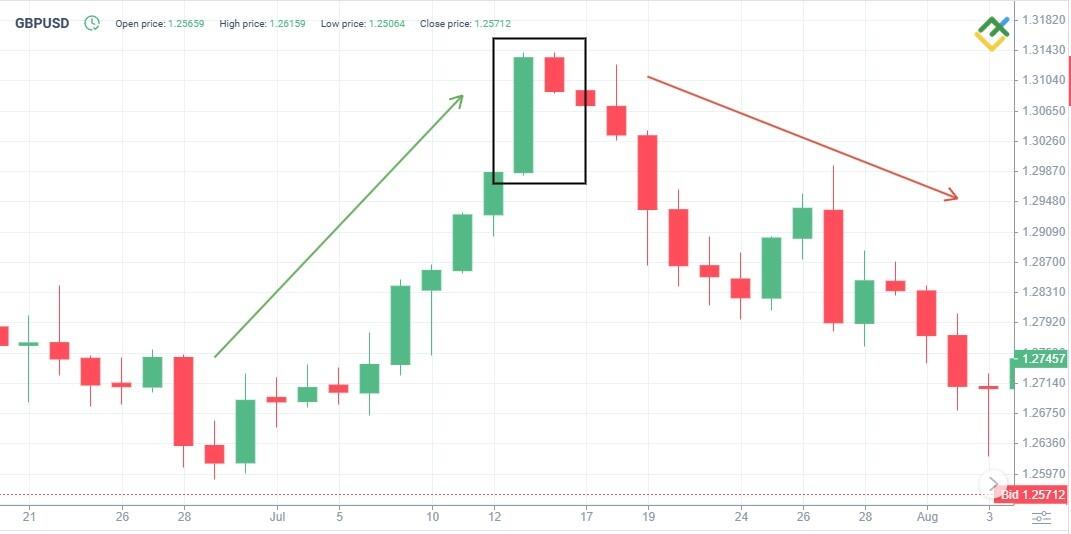
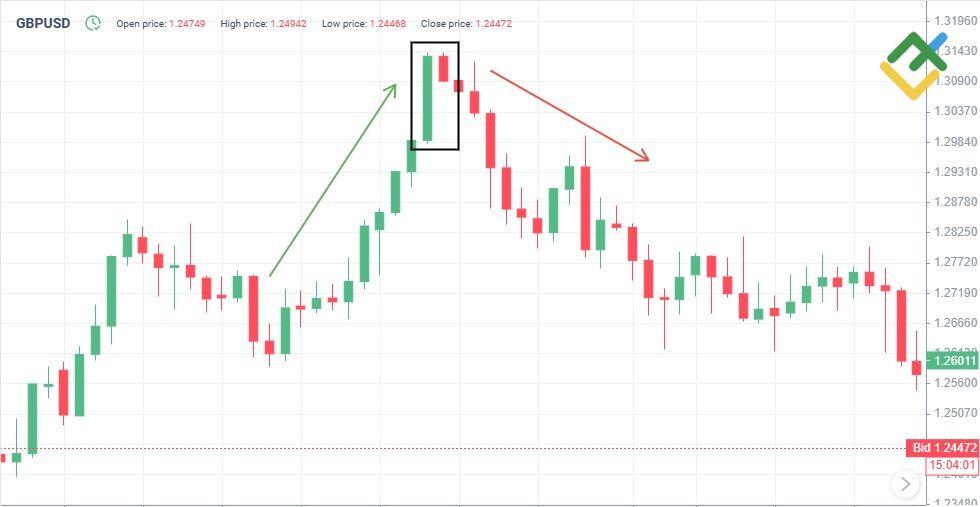
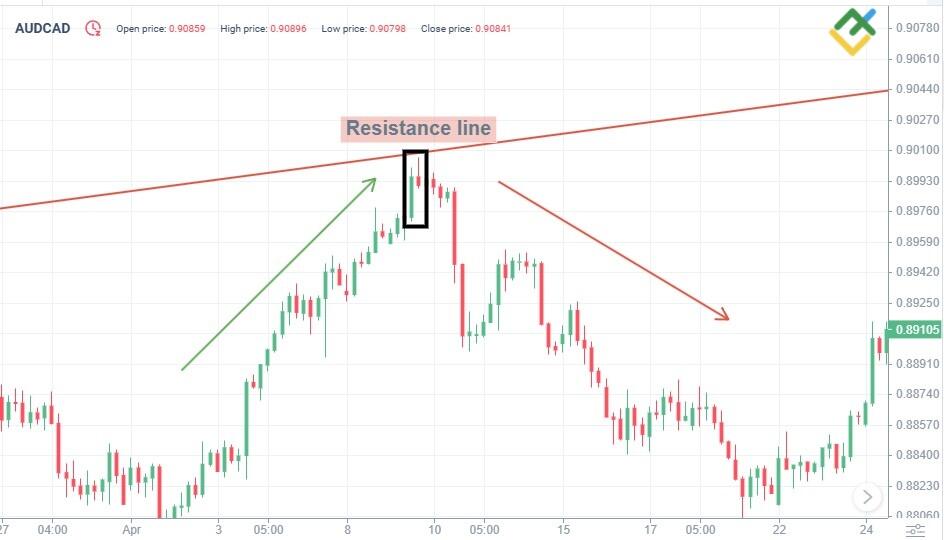
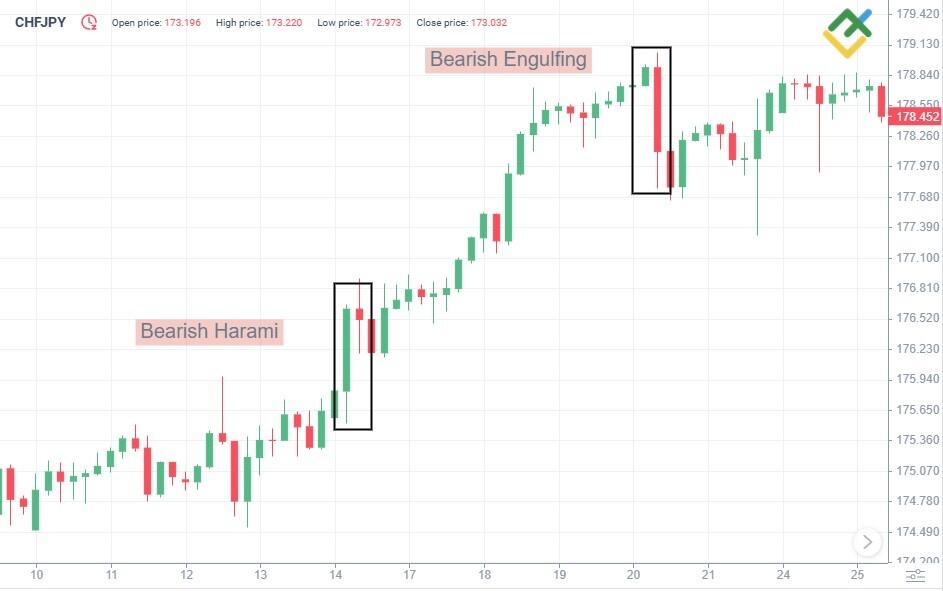
The chart below shows a Bearish Harami marked with a black frame. The pattern has formed after a long uptrend, pointing to a possible change of direction. There is a large bullish candle and a small bearish one entirely engulfed by the preceding candle. This formation signals a decelerating growth and a possible reversal. By the way, if the first candle engulfs the second one, being a Doji candlestick, it is called a Harami Cross.
When traders spot a Bearish Harami, they usually start opening short positions, expecting the price to drop. In this case, the price started to fall after the pattern formation, confirming the trend reversal.
What Are the Strategies to Trade a Bearish Harami Candlestick Pattern?
There are many options available for trading the Bearish Harami pattern, especially if you assess the market situation correctly. Such strategies are well suited for Forex trading. To successfully trade a Bearish Harami, it is crucial to consider the current trend and use additional confirming indicators such as moving averages or Fibonacci levels to minimize the risk of false signals.
Trading During Pullbacks On Naked Charts
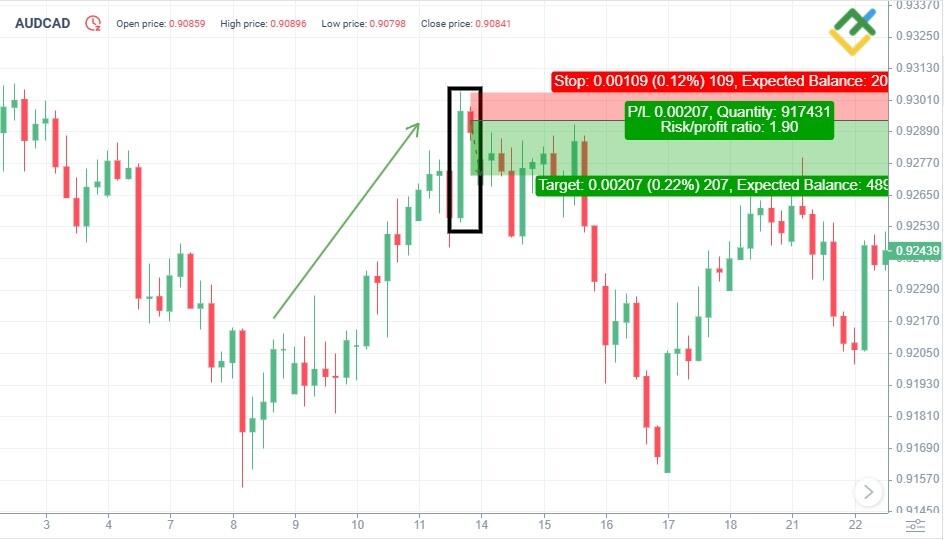
The strategy involves trading Bearish Harami patterns based on the analysis of a clean chart with no additional indicators. Traders wait for a small price pullback after the pattern formation to identify an entry point for a short position. It is essential to wait for the price to pull back slightly and enter a trade with minimal risk.
This strategy is perfect for those who favor a minimalistic approach to analysis and do not use many indicators. Trading on naked candlestick charts allows you to see market movements more clearly and avoid false signals, which can sometimes occur when using multiple technical tools.
Bearish Harami Pattern Trading With Resistance Levels
This strategy implies the use of resistance levels to trade a Bearish Harami. The trend change probability increases when a Bearish Harami candlestick pattern is formed near a strong resistance level, providing profitable entry points for short positions. Traders often place a stop-loss order above a resistance level to limit potential losses.
This strategy suits traders with a conservative approach, emphasizing the importance of using additional levels to confirm entry points. Resistance levels often serve as key reversal zones, especially when a Bearish Harami appears nearby.
Trading the Bearish Harami With Moving Averages
Moving averages significantly contribute to market analysis, helping traders recognize a prevailing trend and filter out false signals. When a Bearish Harami forms near a moving average, it is an additional signal of a possible trend change. For example, if the price is trading above the moving average, it may indicate the end of the uptrend and the beginning of a downward movement.
Traders often use a price crossover with a moving average as a signal to initiate a short position. This approach helps to avoid false signals, especially in a volatile market where price direction can change suddenly. Thus, evaluating the pattern as well as the market environment will help mitigate the risk.
Trading the Bearish Harami With RSI
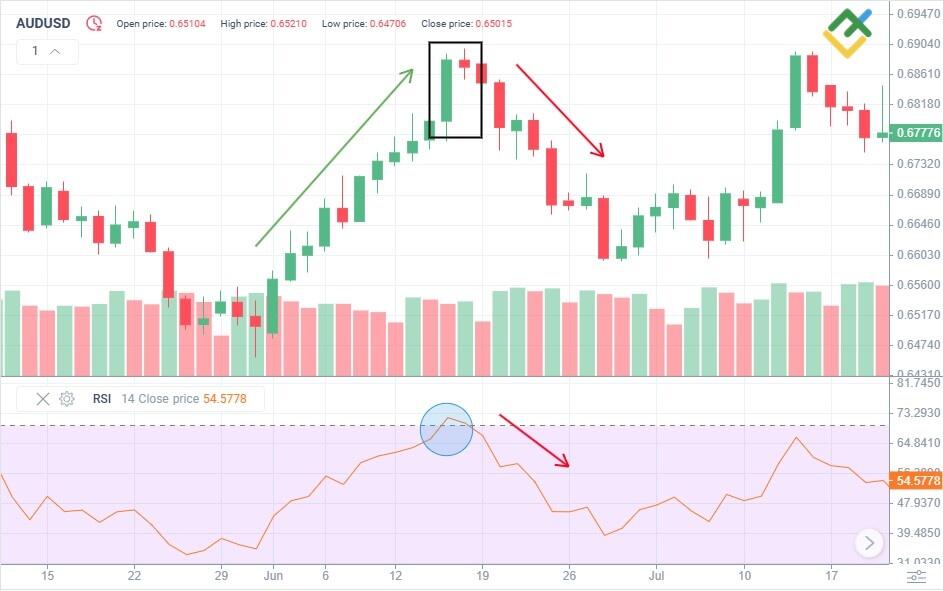
Using the Relative Strength Index (RSI) in conjunction with a Bearish Harami pattern helps traders to determine if the market is overbought or oversold. If the RSI shows a reading above 70, an overbought condition, and a Bearish Harami pattern appears on the chart at the same time, this can be a strong signal to go short.
Traders often use the RSI to confirm the signal provided by a Bearish Harami pattern. When both indicators suggest a potential reversal, it significantly boosts the chances of a profitable trade. This strategy encourages traders to make more informed decisions and prevents them from relying on only one signal, which helps to reduce the risk of false entries and enhances trading efficiency.
Trading the Bearish Harami With Fibonacci Levels
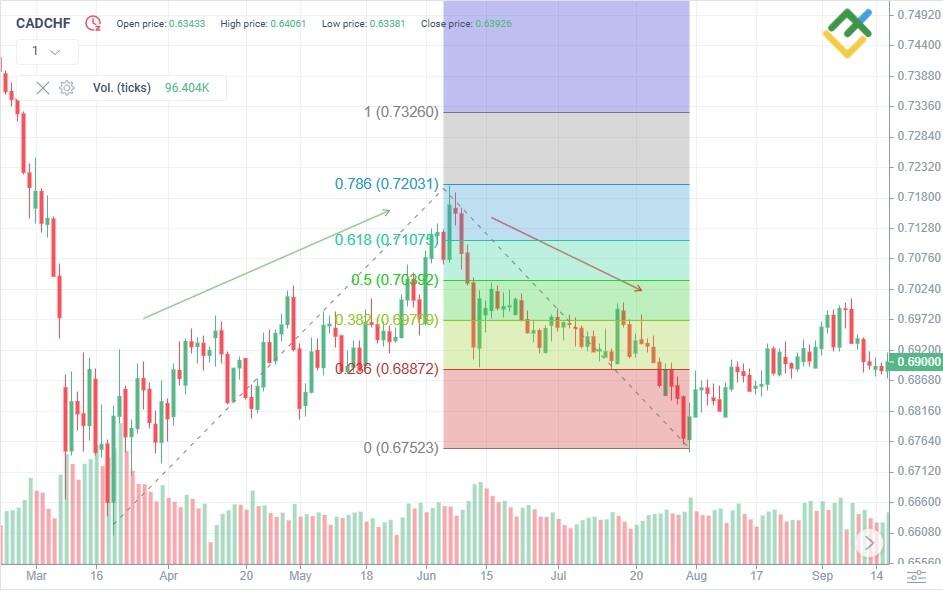
Another way of trading the Bearish Harami candlestick pattern involves applying Fibonacci levels. Fibonacci levels are widely used to identify possible price retracement points. If a Bearish Harami appears close to the key Fibonacci retracement levels, such as 50% or 61.8%, it may signal a potential reversal of the current trend. Traders usually take this opportunity to wait for the price to pull back to a key level, allowing them to enter a trade at a more attractive price.
Using Fibonacci levels with the Bearish Harami reversal pattern helps to pinpoint areas where bulls’ powers may weaken, allowing bearish forces to take over. This can be particularly useful in a volatile market, where uncovering entry points with the least risk and the highest potential reward is essential.
Trading the Bearish Harami With Pivot Points
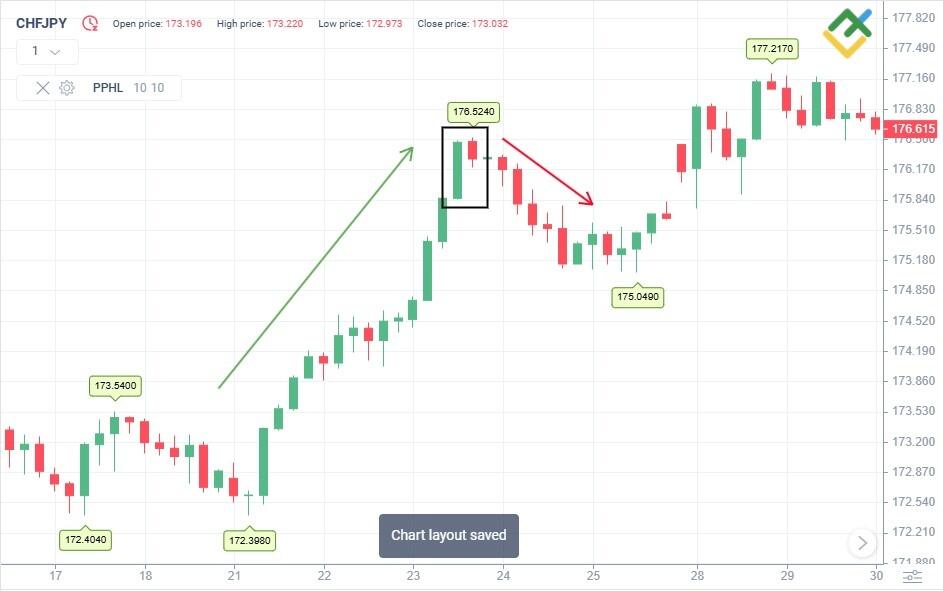
Pivot points help identify key support and resistance levels. If a Bearish Harami forms near a pivot point or at one of the resistance levels, it may indicate a high probability of a bearish trend.
Traders use pivot points to determine the best entry and exit points. When a pivot point confirms a Bearish Harami, it significantly increases the strength of the signal. The strategy is especially advantageous for those who prefer short-term trading and want to mitigate risk.
What Are the Common Mistakes to Avoid When Trading With a Bearish Harami Candlestick Pattern?
When trading a Bearish Harami pattern, traders often make the following mistakes that can lead to losses:
- Ignoring the confirmation signal. Opening a trade without confirmation can result in prematurely entering on an unreliable signal, leading to potential losses. Thus, it is important to wait for a confirming bearish candlestick.
- Wrong stop-loss placement. Setting a stop-loss order too close to the entry point increases the risk of it being prematurely triggered by small price fluctuations.
- Trading against the main trend. If a Bearish Harami forms within a strong bullish trend, the probability of a false signal is high. It is better to trade the pattern when an uptrend is weakening.
- Failing to diversify. Relying solely on a Bearish Harami pattern without using other indicators is a risky strategy that can result in losses.
Avoid these mistakes to increase the likelihood of successful trades and minimize potential losses.
What Is the Difference Between a Bearish Harami And a Bearish Engulfing Candlestick Pattern?
A Bearish Harami and a Bearish Engulfing are two similar candlestick patterns but with different signal strengths and candlestick structures.
- A Bearish Harami consists of a large bullish candle and a smaller bearish one. The second candle is engulfed by the first candle. This formation symbolizes uncertainty and bullish weakness.
- A Bearish Engulfing involves a large bearish candle that completely engulfs the previous small bullish candle, providing a strong signal of a change in market sentiment.
A Bearish Engulfing pattern is generally seen as a stronger signal, reflecting decisive seller dominance over buyers. In contrast, a Bearish Harami suggests a more gradual loss of bullish momentum and often requires additional confirmation.
What Are the Limitations of the Bearish Harami Pattern?
A Bearish Harami has a number of limitations that should be considered:
- False signals. A Bearish Harami pattern can give false signals of a trend reversal if not confirmed. Therefore, it is essential to use additional indicators and other candlestick and chart patterns to increase accuracy.
- Limited usability. The pattern works best when there is a clearly defined uptrend. In a sideways movement, it may not yield the desired results.
- Need for confirmation. A Bearish Harami alone is not a sufficient indicator to open a trade. It is important to wait for confirming signals, such as volume changes, support and resistance levels, and other factors.
It is advisable to use additional technical analysis tools such as the RSI, SMA (moving averages), and FIBO (Fibonacci levels) to compensate for these limitations.
Conclusion
A Bearish Harami is a powerful pattern that signals a downward reversal. However, in order to use the pattern successfully, it is crucial to wait for confirmation signals and incorporate additional technical analysis tools to boost the reliability of your predictions. Various strategies, such as trading with resistance levels or moving averages, provide more reliable entry points and reduce risks. Remember to avoid common mistakes, try not to ignore confirmation signals, and set your stop-loss order carefully to prevent premature triggering.
Bearish Harami FAQs
A bearish Harami signals a potential shift from an uptrend to a downtrend. This pattern implies that buyers are starting to lose their momentum, suggesting the onset of a bearish phase.
A Bearish Harami can be quite reliable, but only when there are confirming signals. Without additional confirmation, the pattern can be unreliable and may give misleading signals.
Although Inside Bar and Bearish Harami patterns may seem similar, they convey distinct meanings. An Inside Bar pattern is more often seen as a pause in the trend, while a Bearish Harami signals a reversal.
The success rate of a Bearish Harami depends on many factors, primarily the market context and confirming signals from additional technical analysis tools. Furthermore, the success rate tends to be higher when the prevailing trend is strong.
Both Dojy and Bearish Harami patterns can indicate a reversal from a bullish to a bearish market. However, a Bearish Harami usually gives a stronger signal, as it includes two candles and more clearly shows waning bullish momentum.
After a Bearish Harami formation, the price usually starts to decline, especially if a confirming bearish candle appears, signaling a change in trend direction.
The content of this article reflects the author’s opinion and does not necessarily reflect the official position of LiteFinance. The material published on this page is provided for informational purposes only and should not be considered as the provision of investment advice for the purposes of Directive 2004/39/EC.
{{value}} ( {{count}} {{title}} )
This post is originally published on LITEFINANCE.

