
I welcome my fellow traders! I have made a price forecast for the USCrude, XAUUSD, and EURUSD using a combination of margin zones methodology and technical analysis. Based on the market analysis, I suggest entry signals for intraday traders.
Gold tested the support (A) 2630 – 2625 yesterday.
The article covers the following subjects:
Highlights and key points
-
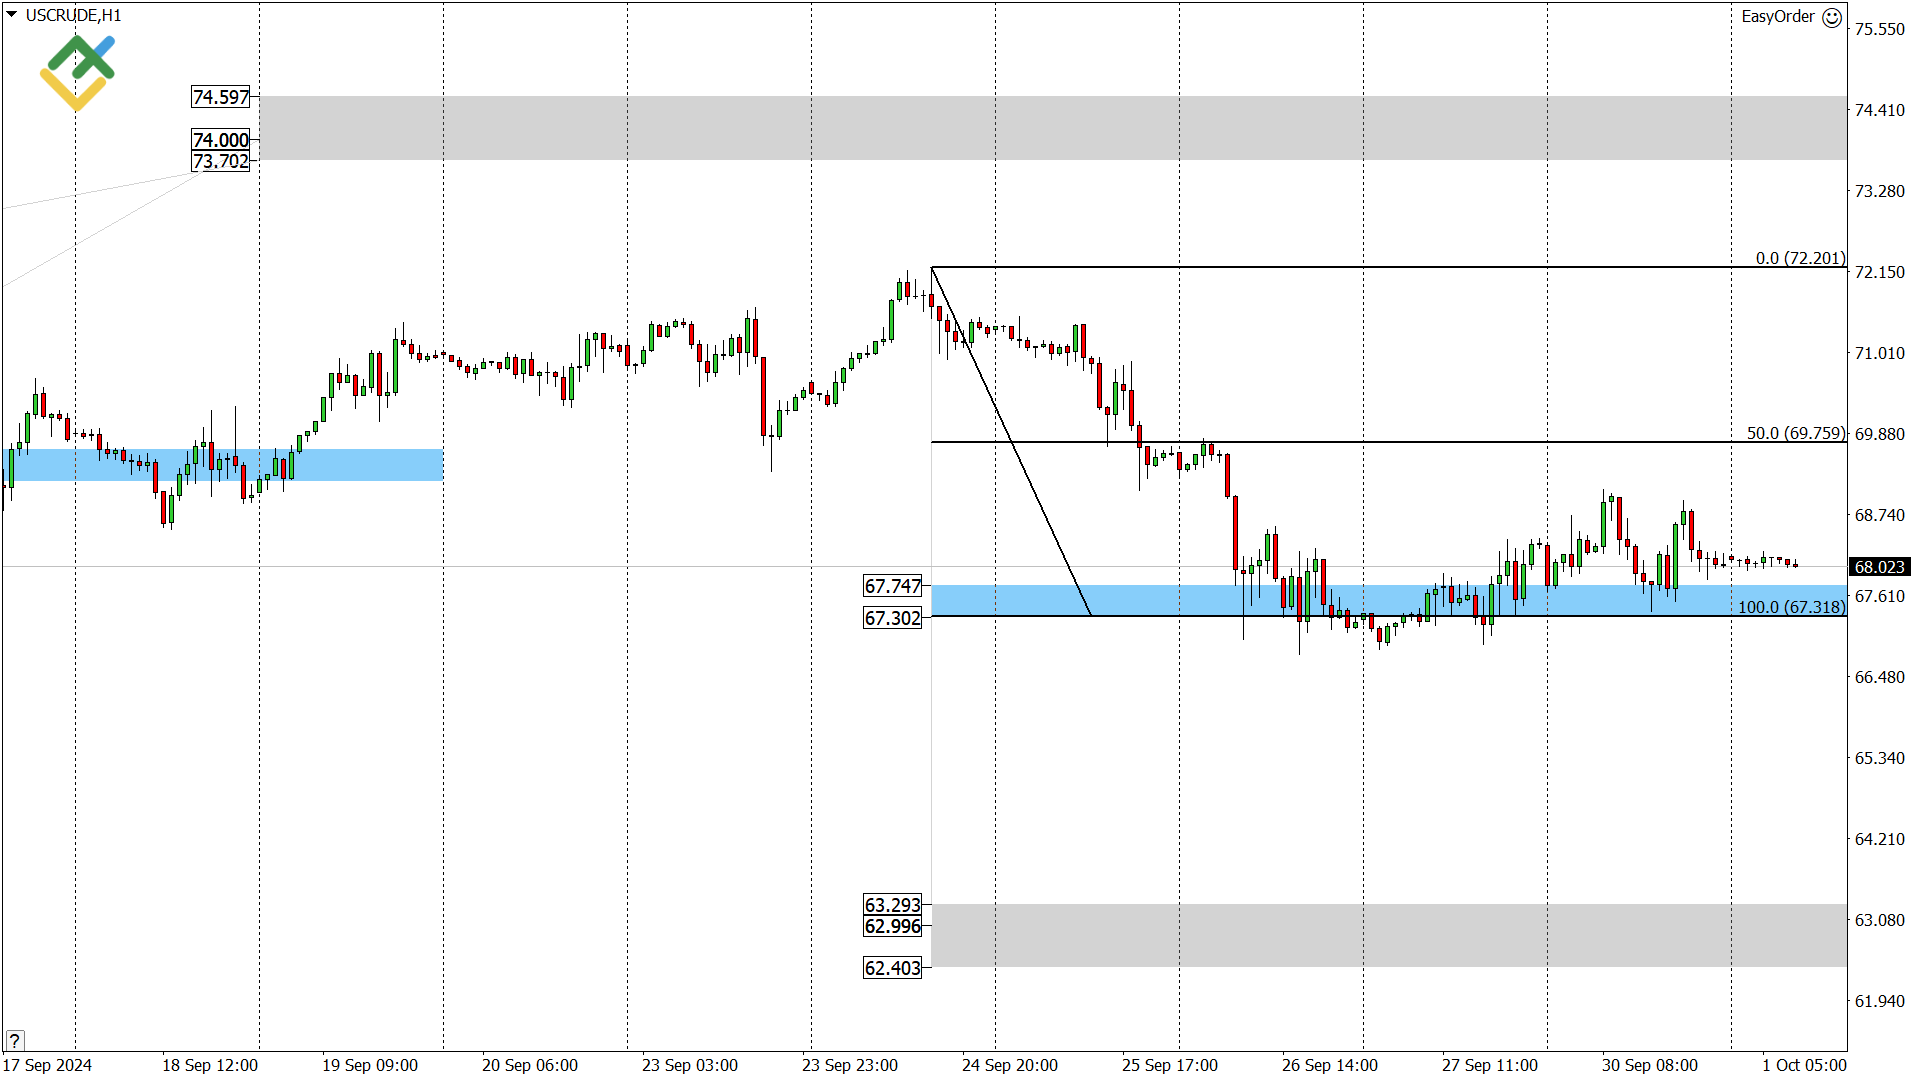
USCrude: oil is trading just above the support (B) 67.74 – 67.30. Consider long trades until the price breaches the support (B).
-
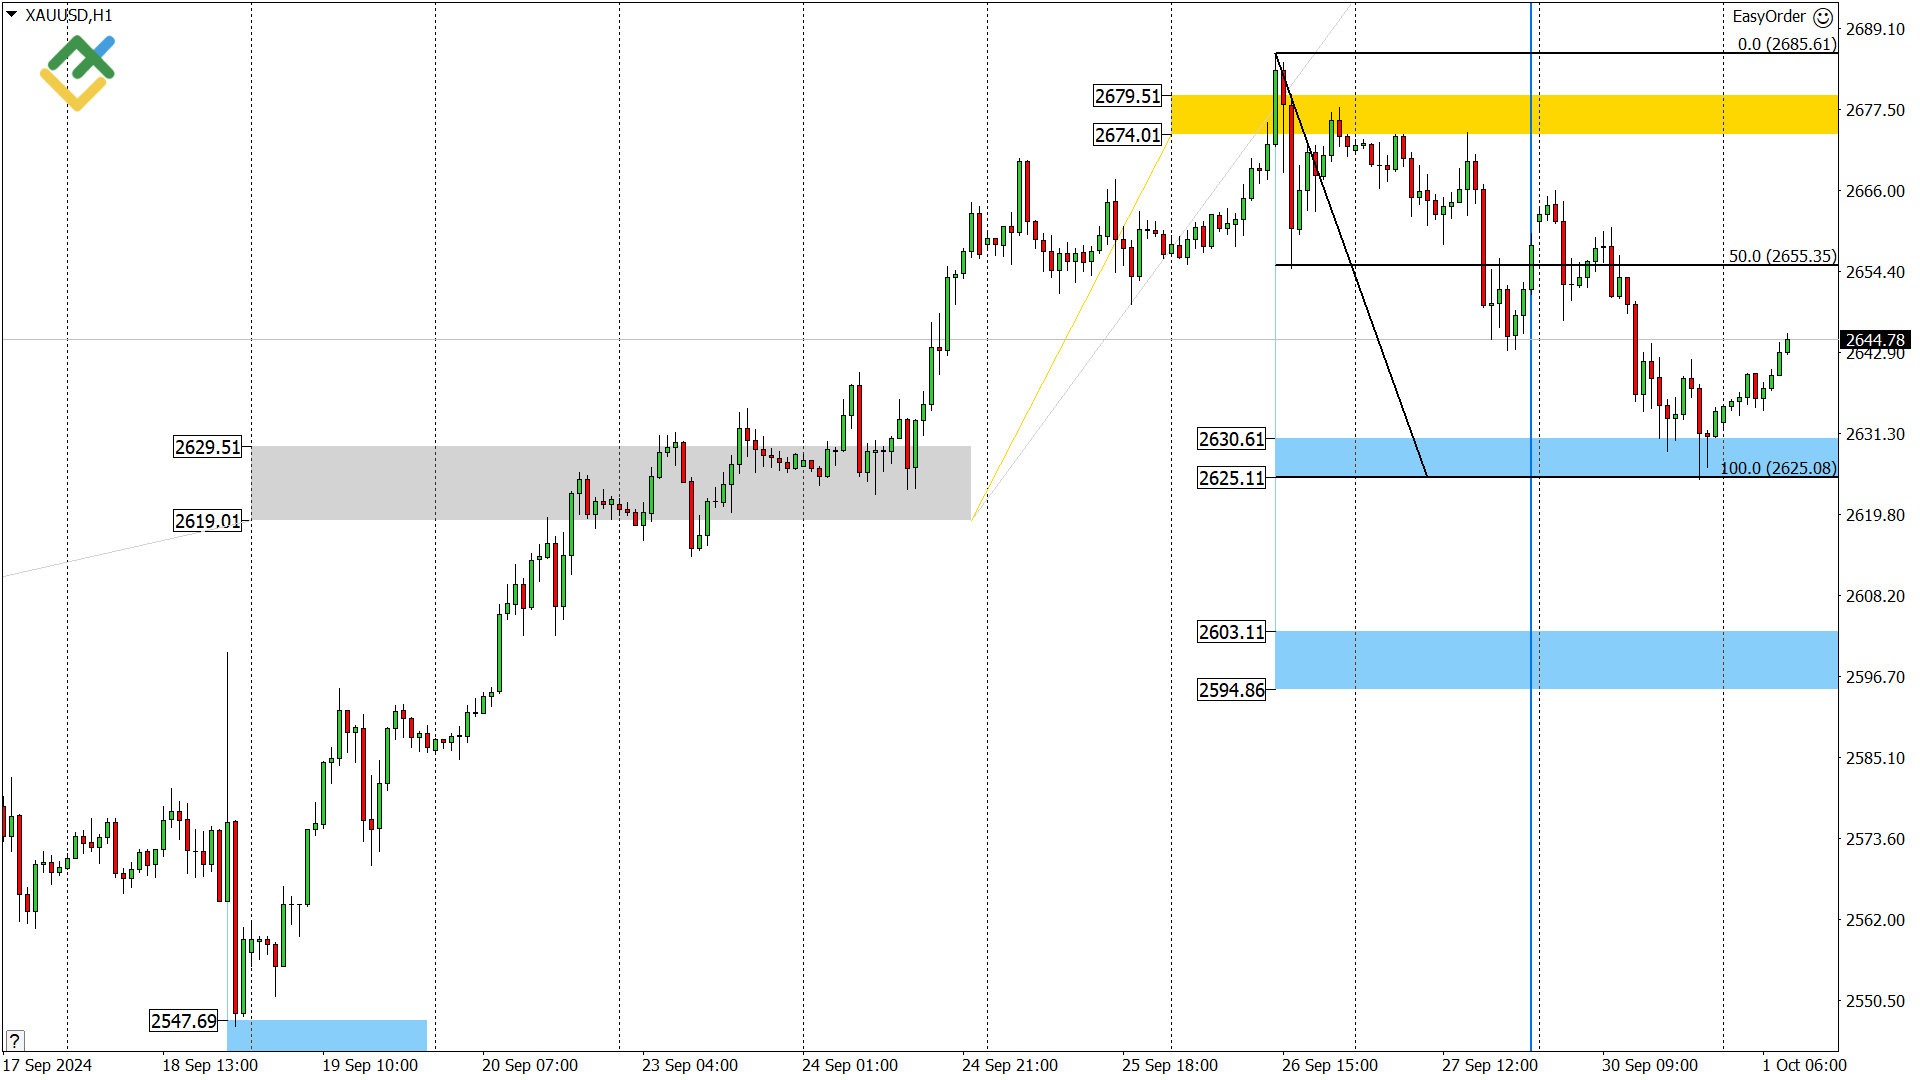
XAUUSD: gold is rising after touching the support (A) 2630 – 2625.
-
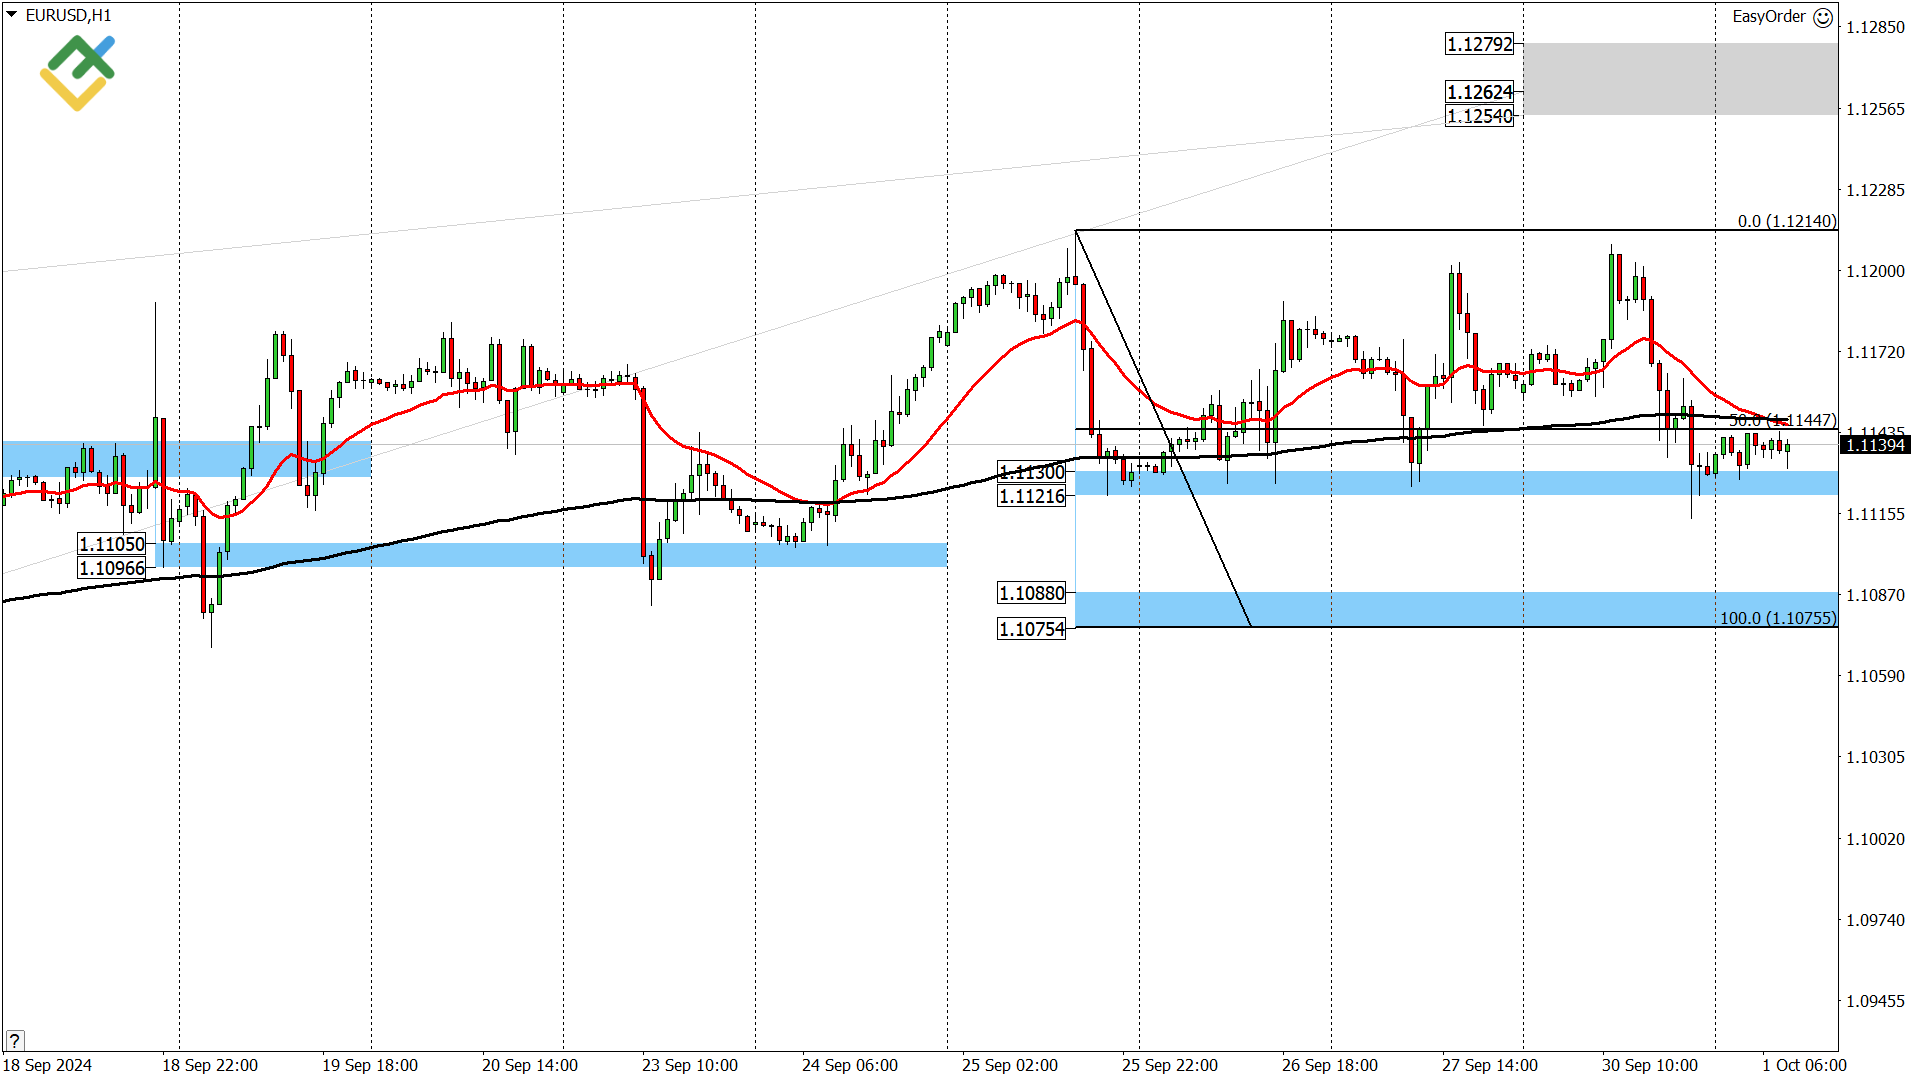
EURUSD: the euro has dropped to the support (A) 1.1130 – 1.1121 again. If the asset breaks through this zone, the correction will continue to the support (B) 1.1088 – 1.1075.
Oil price forecast for today: USCrude analysis
Oil is trying to continue the short-term uptrend with the first target near 69.75. If the price pierces this level, the next bullish target will be the September 24 high of 72.20.
If the asset breaches the support (B) 67.74 – 67.30, the short-term uptrend will reverse. In this case, consider short trades with the target in the lower Target Zone 63.29 – 62.40, starting from tomorrow.
USCrude trading ideas for today:
Hold up long trades opened at support (B) 67.74 – 67.30. TakeProfit: 69.75, 72.20. StopLoss: 66.30.
Gold forecast for today: XAUUSD analysis
Gold tested the support (A) 2630 – 2625 yesterday. Corrective sales were closed, and long trades were opened near this support. Currently, the price is rising. The first bullish target is 2655. If the price consolidates above this level, the next target will be 2685.
If the price breaches the support (A), the correction will continue to the trend’s boundary 2603 – 2594. Consider long trades near this zone with the first target of 2640 and the second one of 2685.
XAUUSD trading ideas for today:
Hold up long trades opened at support (A) 2633 – 2627. TakeProfit: 2655, 2685. StopLoss: 2616.
Euro/Dollar forecast for today: EURUSD analysis
The euro failed to exceed the September 25 high yesterday. Instead, the price has declined to the support (A) 1.1130 – 1.1121 again. If the asset pierces and consolidates below this zone, the correction will continue to the support (B) 1.1088 – 1.1075, the short-term uptrend’s boundary.
If the quotes hit the support (B), one may consider long trades. The first bullish target will be 1.1144, and the second one will be 1.1214. The price should break through and consolidate below 1.1075 to reverse the uptrend.
EURUSD trading ideas for today:
Watch the market.
P.S. Did you like my article? Share it in social networks: it will be the best “thank you” 🙂
Ask me questions and comment below. I’ll be glad to answer your questions and give necessary explanations.
Useful links:
- I recommend trying to trade with a reliable broker here. The system allows you to trade by yourself or copy successful traders from all across the globe.
- Use my promo code BLOG for getting deposit bonus 50% on LiteFinance platform. Just enter this code in the appropriate field while depositing your trading account.
- Telegram chat for traders: https://t.me/litefinancebrokerchat. We are sharing the signals and trading experience.
- Telegram channel with high-quality analytics, Forex reviews, training articles, and other useful things for traders https://t.me/litefinance
Price chart of XAUUSD in real time mode

The content of this article reflects the author’s opinion and does not necessarily reflect the official position of LiteFinance. The material published on this page is provided for informational purposes only and should not be considered as the provision of investment advice for the purposes of Directive 2004/39/EC.
{{value}} ( {{count}} {{title}} )
This post is originally published on LITEFINANCE.


