The article covers the following subjects:
Highlights and key points
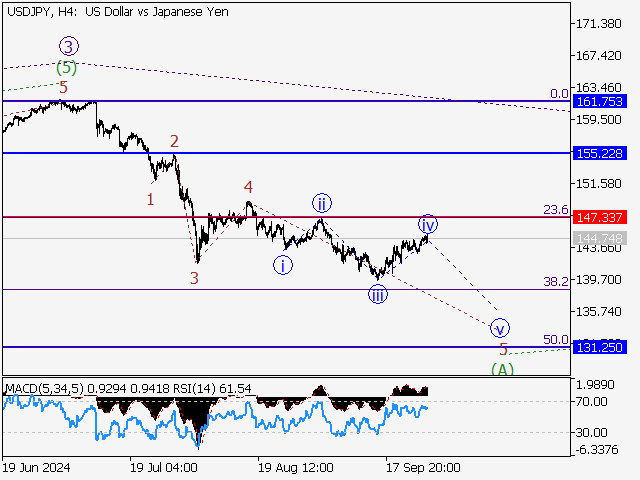
- Main scenario: consider short positions on corrections below the level of 147.33 with a bearish target of 131.25 – 123.97. A sell signal: if the price holds below 147.33. Stop Loss: above 148.50, Take Profit: 131.25 – 123.97.
- Alternative scenario: breakout and consolidation above the level of 147.33 will allow the pair to continue rising to the levels of 155.22 – 161.75. A buy signal: once the level of 147.33 is broken to the upside. Stop Loss: below 146.00, Take Profit: 155.22 – 161.75.
Main scenario
Consider short positions on corrections below the level of 147.33 with a target of 131.25 – 123.97.
Alternative scenario
Breakout and consolidation above the level of 147.33 will allow the pair to continue rising to the levels of 155.22 – 161.75.
Analysis
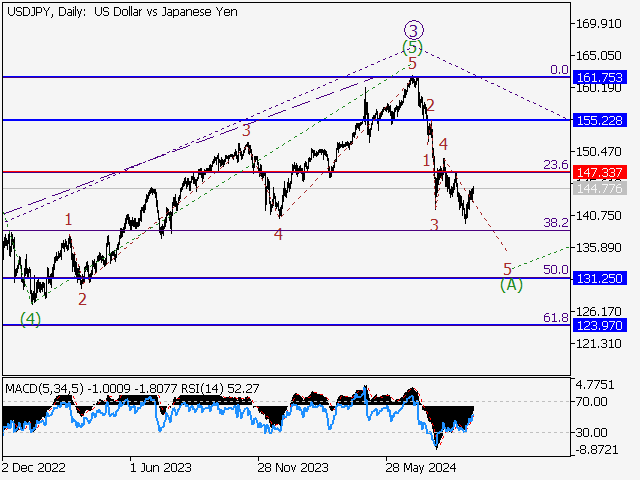
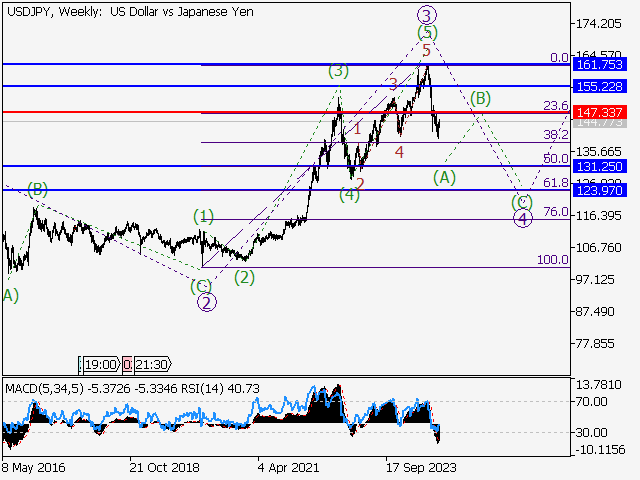
An ascending wave of larger degree 3 has presumably finished developing on the weekly chart, with wave (5) of 3 formed as its part. A bearish correction has started developing as the fourth wave of larger degree 4 on the daily chart, with wave (А) of 4 continuing to form as its part. Apparently, wave 5 of (А) is unfolding, with a local corrective wave iv of 5 coming to an end as its part on the H4 time frame. If the presumption is correct, the USDJPY pair will continue declining within wave v of 3 to the levels of 131.25 – 123.97. The level of 147.33 is critical in this scenario as a breakout will enable the pair to continue rising to the levels of 155.22 – 161.75.
Price chart of USDJPY in real time mode
The content of this article reflects the author’s opinion and does not necessarily reflect the official position of LiteFinance. The material published on this page is provided for informational purposes only and should not be considered as the provision of investment advice for the purposes of Directive 2004/39/EC.
{{value}} ( {{count}} {{title}} )
This post is originally published on LITEFINANCE.


