In the realm of technical analysis, chart patterns are essential as they assist traders in making well-informed decisions. Patterns appear in all markets, including commodities, stocks, cryptocurrency, and Forex.
Patterns indicate potential price movement. Among these patterns is a “Falling wedge” formation, which is a very effective tool in trend forecasting. This reversal pattern allows you to enhance forecast accuracy and trading efficiency. The article focuses on the characteristics of a “Falling wedge” pattern, as well as trading strategies and risk management rules.
The article covers the following subjects:
Key Takeaways
-
A “Falling wedge” is a bullish reversal and continuation pattern in technical analysis that occurs during a downtrend.
-
A “Falling wedge” is formed in a bearish trend by narrowing support and resistance lines heading downward.
-
A “Falling wedge” pattern differs from “Triangle” and “Pennant” patterns because its converging trend lines are downward-sloping, suggesting a potential reversal.
-
A “Falling wedge” occurs when bearish momentum gradually weakens as a price moves within a narrowing range.
-
The pattern can serve as an independent trend reversal signal or be combined with other technical indicators.
-
A “Falling wedge” is a pattern that signals an upward trend reversal in advance.
What is a falling wedge Pattern?
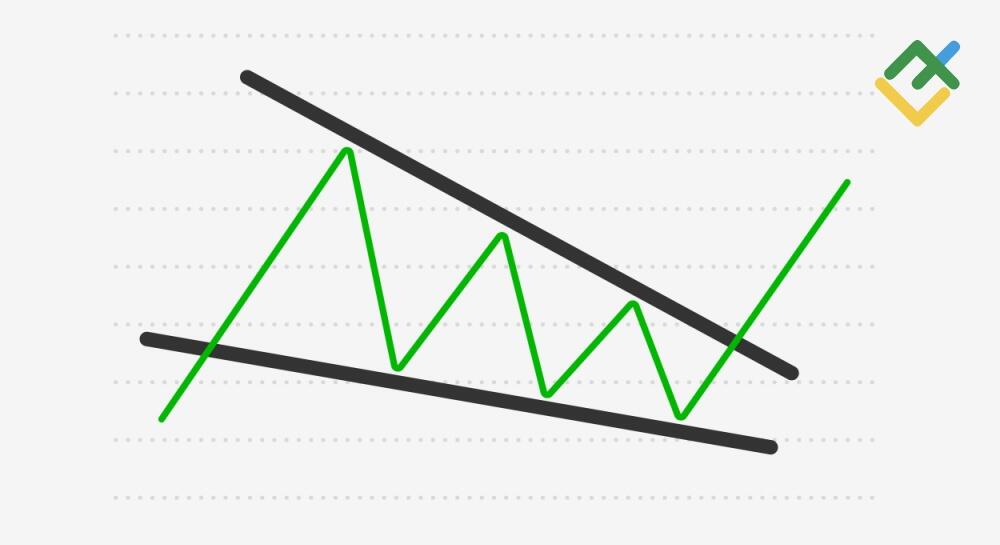
A “Falling wedge” is a technical analysis chart pattern that appears during a downtrend and indicates a potential upward price reversal.
A “Falling wedge” develops during a bearish trend when the price is confined between two converging, gradually narrowing support and resistance lines. A resistance breakout is particularly significant as it typically suggests the start of a new uptrend.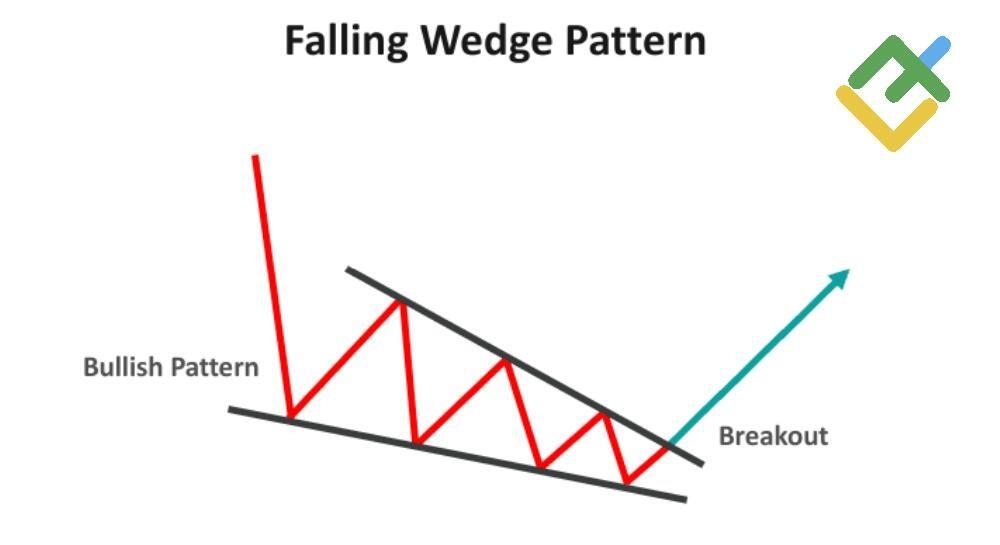
How to Identify a Falling Wedge Pattern
To spot a “Falling wedge” pattern on the chart, first, identify a bearish trend that is gradually weakening and going flat as the price moves lower. Then, draw the upper trend line by connecting the lower highs and a lower one by connecting the lower lows. Thus, two trend lines are drawn to connect the respective highs and lows. If the lines are sloping downwards and converge, a descending wedge is formed.
Keep an eye on the narrowing of the price range, as its magnitude should gradually decrease. The pattern is completed when the price breaks through the resistance line, which is a crucial aspect of its formation. Meanwhile, trading volumes are growing, signaling an upward trend reversal.
Falling Wedge Pattern Characteristics
-
Converging trend lines. An upper resistance line connects consecutive swing highs, while a lower support line connects consecutive swing lows, indicating the formation of lower highs and lower lows.
-
Price range narrowing. As the pattern is formed, the amplitude of price fluctuations gradually decreases, pointing to a drop in volatility and potential consolidation before further movement. Buyers and sellers are adopting a cautious approach, waiting to see how the situation unfolds.
-
Trading volume. It is important to consider volume when analyzing as it usually decreases as a pattern forms and then spikes sharply when the upper resistance line is breached, confirming a trend reversal and a bullish breakout.
-
Breakout. The final pattern formation phase occurs when the price action bursts through the upper resistance line, signaling the beginning of a new uptrend.
Falling wedge Pattern on Pfizer (#PFE) Stock Price Chart
Let’s analyze a “Falling wedge” pattern on the daily Pfizer stock chart from November 2023 to May 2024.
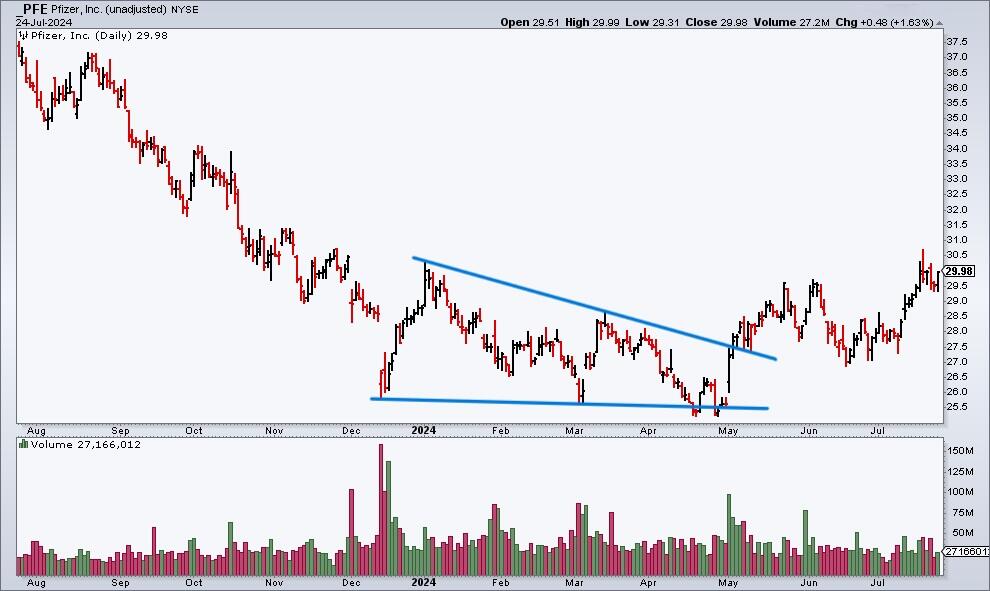
Initial Phase: Upper and Lower Trend Lines Formation, November 2023–March 2024
During this period, Pfizer‘s price traded in a downtrend. Lower highs of November 28, January 2, and March 13 have formed an upper trend line, while the lower lows of December 15 and March 4 have formed a lower trend line.
Middle Phase: Range Narrowing, December 2023–April 2024
In this period, the #PFE price continued to trade between the converging trend lines in the consolidation zone. The fluctuations’ amplitude is gradually decreasing.
Final Phase: Resistance Breakout, May 2024
In early May, the asset broke through the upper resistance line, and the “Falling wedge” was completed. The breakout was accompanied by an increase in trading volumes. Following the upside reversal, Pfizer’s price began to climb steadily, thus confirming the pattern’s effectiveness.
Confirmation of Pattern Performance, June 2024
Once the upper resistance line was pierced, the price continued to grow to new highs in the following weeks. In June 2024, the rate declined to the breakout level of $27.50 but then rebounded, exceeding the previous swing highs. This price movement confirms the signal given by the “Falling wedge” pattern.
Importance of Volumes When Analyzing a Falling Wedge Pattern
Analyzing a “Falling wedge” pattern involves considering trading volumes, which validate the signal and suggest a potential reversal. During pattern formation, trading volumes usually reduce. Thus, the downtrend weakens, and the price of an asset or security consolidates before further movement. When the upper resistance line is breached, an increase in volumes confirms the strength of the reversal.
Significant volume growth during a breakout demonstrates market participants’ conviction and a high probability of the uptrend continuation. Therefore, analyzing changes in volumes helps confirm a change in trend direction. However, this is not always the case, as price movements are more crucial than volume data. Moreover, volume growth is not always accompanied by a trend reversal.
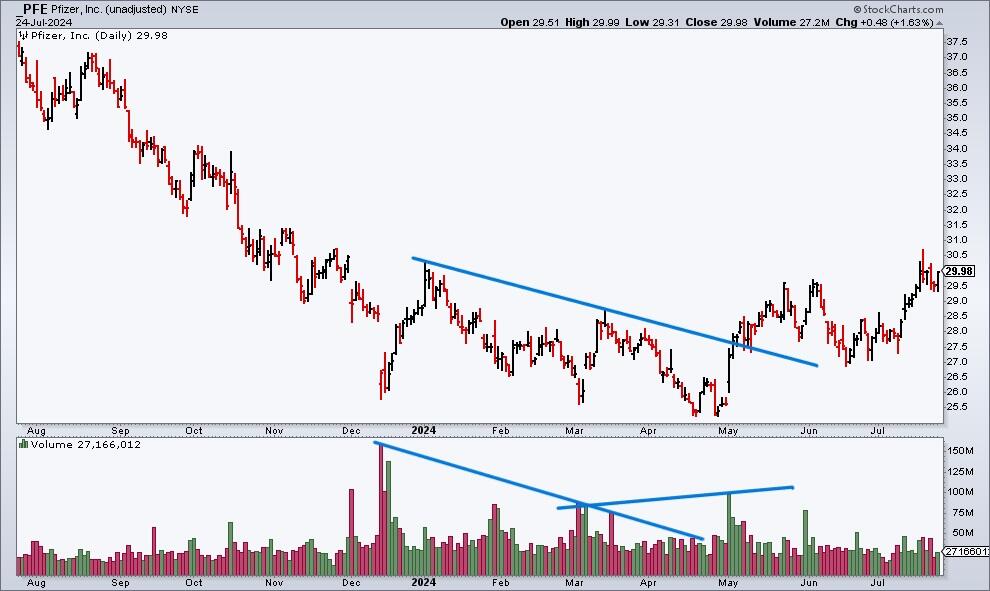
Let’s review the Pfizer stock trading volume indicators. Once the asset reached its December 2023 low, the trading volumes surged due to the price drop. Subsequently, the volumes naturally declined as the swing highs gradually decreased, as did the trading activity. Another volume hike occurred in May 2024, when the asset broke through the resistance line, which turned into support.
Notably, the trading volume helps to validate the pattern. In live markets, many false breakouts may happen, like in March and May 2024. The increase in trading volumes can cause traders to misinterpret market performance and make errors. To avoid the mistakes, it is essential to take a break for several trading periods before making any decisions.
How to Trade a Falling Wedge Pattern
The main strategy for trading the “Falling wedge” pattern involves waiting for the upper resistance line breakout. Once it occurs, you should wait a few trading periods before opening long positions, as a correction to test the newfound support level can sometimes emerge. The breakout of the wedge to the upside is confirmed by increased trading volumes.
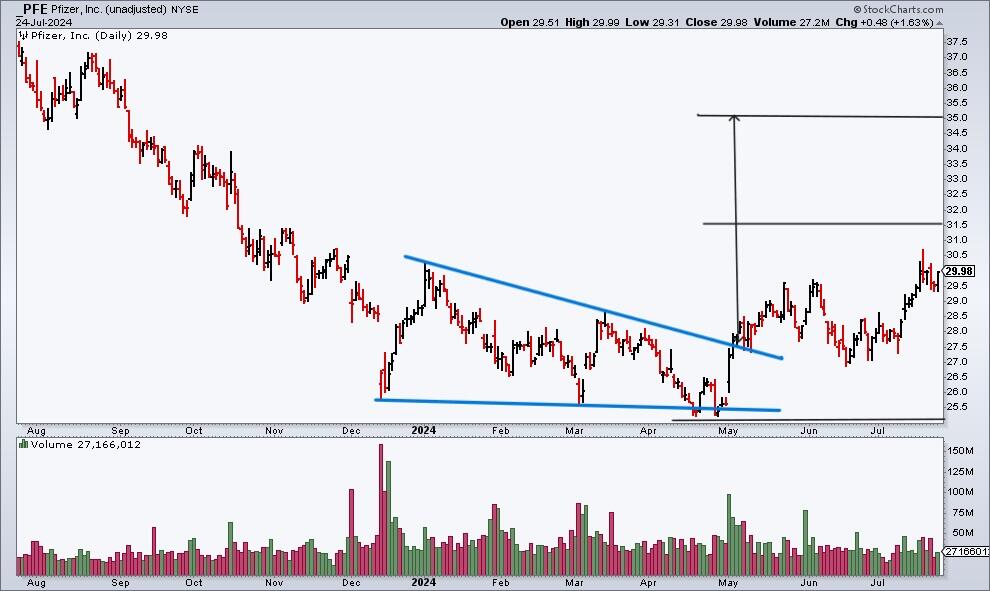
When trading this pattern, use take-profit levels to exit a position. Profit targets should be calculated by adding the size of the widest part of the wedge to the breakout point, as shown in the chart above. At the same time, you should set several bullish targets. Once the first target is reached, it is necessary to lock in half of the profits on the position. This action ensures that the trade becomes breakeven and protects the investor’s deposit in case the market conditions change.
A stop-loss order should be placed just below the previous low of the wedge to minimize losses if a false breakout happens. Doing this helps protect your capital and reduce the risks involved. Besides, one may close a position manually. However, less experienced traders should set automatic orders.
For example, a trader opens a position on Pfizer stock during the “Falling wedge’s” resistance line breakout with the first target of $31.5. Once the price hits this mark, a trader locks in half of the profits. A trader sets the second target of $34, where he also secures a part of the profits. The remaining profits can be secured a little later because, in any case, the profits will have already been received. A stop-loss order is set below the $25 level.
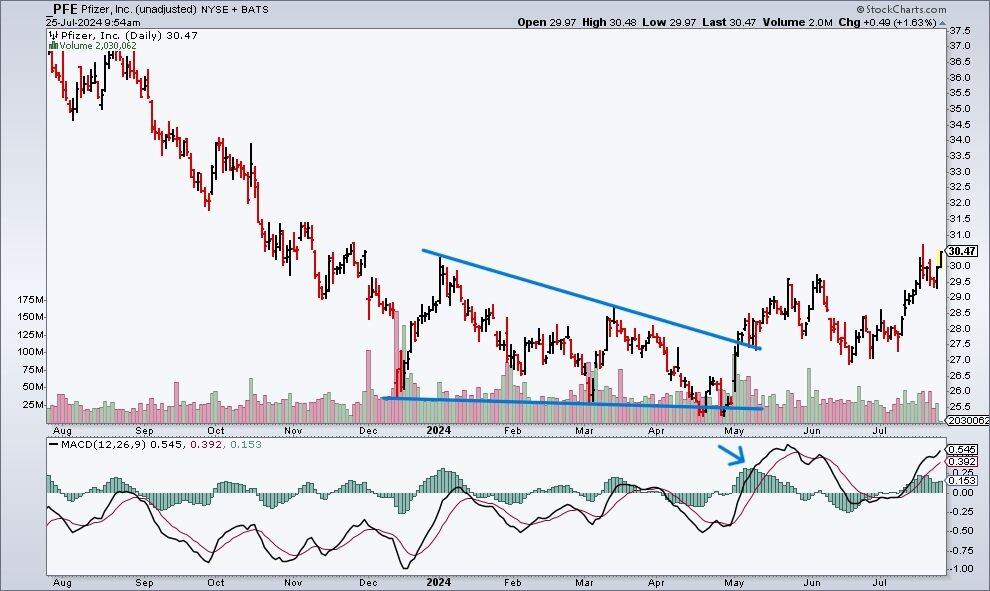
You can also use other technical indicators. For example, the MACD indicator helps to identify false breakouts. If the MACD line, its histogram, and the moving average are above 0 (as pointed out by the blue arrow on the chart above), and the price pierces the upper line of the wedge, it suggests further growth.
Therefore, combining a “Falling wedge” pattern with other technical tools and proper risk management allows you to open and close trades effectively with minimal risk.
Benefits and Limitations of Trading the Falling Wedge Pattern
|
Pros |
Cons |
|
Early reversal signal. The pattern allows traders to identify a potential upward trend reversal in advance. The upper resistance line breakout is the optimal moment to open a position. |
False breakouts. There may be false signals, resulting in losses. |
|
Risk management. Stop-loss levels are easily determined, and the orders are set below the previous low formed by the pattern. |
Ambiguity. It is difficult to identify the pattern during high volatility. In the early stages of formation, it can be mistaken for a “Triangle,” “Pennant,” or “Flag” pattern. |
|
Confirmation by volume. Increasing trading volume during a breakout amplifies the reliability of the signal. |
Dependence on other technical tools. Additional confirmation by indicators or other methods of technical analysis is required. |
|
Wide application. The pattern may occur in different markets and can be seen on different time frames. |
Time factor. Pattern formation takes considerable time and requires patience from traders and investors. |
Conclusion
A “Falling wedge” pattern is an essential technical analysis tool that improves forecast accuracy and trading efficiency. Understanding its characteristics and formation stages helps traders make informed decisions and reduce risks. The entry strategy involves breaking through the upper resistance line while trading volumes are increasing. Use orders for profit-taking. A take-profit order should be set at a level equal to the wedge size in its widest part. A stop loss can be placed below the previous swing low.
Traders can effectively use a “Falling wedge” pattern in combination with other technical tools on various financial markets. The key is to adhere to risk management principles. Regardless of how reliable a trading signal may seem, it only represents the likelihood of a favorable transaction outcome. Therefore, you should strictly follow capital management rules. The loss per trade should not exceed 1% of the deposit. Prioritizing safety is essential!
Falling Wedge Pattern FAQs
Yes, a “Falling wedge” is a bullish pattern. It is formed in a downtrend and foreshadows a potential upward price reversal once the upper resistance line is breached.
A “Falling wedge” can signify a weakening of bearish pressure and accumulation of bullish momentum, leading to an upward trend reversal once the upper resistance line is pierced.
A “Falling wedge” pattern is considered to be reliable. However, false breakouts are possible, so using technical tools is recommended. Besides, consider taking a pause before making a decision to increase the forecast accuracy.
Growing trading volumes suggest a strong bullish momentum. Thus, long trades are opened, enhancing the reliability of the signal and the probability of an upward trend reversal.
Wait for the upper resistance line breakout to trade a “Falling wedge” pattern. Take a pause for several trading periods and enter the position after trading volumes grow. Set the first take-profit order equal to the width of the wedge and a stop-loss order below the previous swing low.
The “Falling wedge” pattern strategy involves entering a trade after the upper resistance line breakout in the early stages of a trend reversal. This approach will maximize potential profits and limit losses.
A “Falling wedge” can be both a continuation and reversal pattern. Analyze the market situation. If the pattern forms during a downtrend, and the upper resistance line breakout is accompanied by increased volumes, it signals a trend reversal. However, suppose the pattern emerges during a bullish trend, and rising volumes support the upper resistance line breakout. In this scenario, a “Falling wedge” pattern indicates a continuation of the trend.
The pattern’s bullish signal is confirmed when the price breaks through the upper resistance line simultaneously with an increase in trading volumes. Nevertheless, you should wait for the close of the trading period and possibly take a pause to ensure reliability.
The content of this article reflects the author’s opinion and does not necessarily reflect the official position of LiteFinance. The material published on this page is provided for informational purposes only and should not be considered as the provision of investment advice for the purposes of Directive 2004/39/EC.
{{value}} ( {{count}} {{title}} )
This post is originally published on LITEFINANCE.