International Business Machines Corporation or IBM is a global leader in the development of hardware and software, as well as a provider of consulting and IT services. The company has a market capitalization exceeding $180 billion.
The second-quarter report revealed a notable rise in IBM’s gross profit, reaching $8.95 billion compared to the previous quarter’s $7.74 billion. As a result, the IBM stock posted significant gains. Analysts anticipate that the stock will continue to appreciate over the foreseeable future.
The article covers the following subjects:
Highlights and Key Points: IBM Stock Forecast 2024-2030
- The current price of IBM stock on 30.08.2024 is $198.85.
- According to analysts’ forecasts, the value of IBM securities may rise above $200.00 and trade in the range of $201.00-$220.00 by the end of the year. The most optimistic forecasts assume that the price of the asset may reach $244.80–$264.00. According to more conservative forecasts, the IBM share price is expected to fluctuate in the range of $164.13–$194.91.
- Analysts anticipate that the IBM rally will continue into 2025, reaching the projected price range of $258.52–$312.30. Some analysts suggest that the stock price could reach $365.89–$370.00. Moderate forecasts indicate that IBM’s stock price will stand between $196.26 and $216.00 in 2025.
- Stock market experts are optimistic about the future of IBM stock in 2026, with some projections reaching $399.11–$452.72, while others forecast a more moderate growth to $197.34–$237.40.
- Analysts give mixed forecasts for the period between 2027 and 2030. The target price for IBM shares for this period is $400.00. Some experts estimate that the stock will range between $420.00 and $454.00 by the end of 2030. Experts at Gov Capital offer the most optimistic outlook, with a price rise to a stunning $936.46 mark by August 2029. Other analysts see the share price fluctuating between $199.19 and $255.12 by 2030.
IBM Stock Price Today: A Look Ahead at the Coming Days and Week
When forecasting IBM’s stock price, focus on recent company announcements, especially regarding technological innovations, partnerships, or major contracts. Monitor industry trends affecting the tech and AI sectors, as these are critical to IBM’s operations. Analyze the impact of economic indicators on tech investments. Earnings reports and guidance from the company are also pivotal. Utilize technical analysis tools such as Moving Averages and the RSI to gauge market sentiment and determine potential price trajectory. This approach will help predict IBM’s stock trends in the coming days and weeks.
Get access to a demo account on an easy-to-use Forex platform without registration
IBM Stock Forecast 2024
Let’s take a look at expert forecasts for the IBM rate in 2024.
Trading Economics
Price range in 2024: $179.88 – $186.63 (as of August 26, 2024).
According to Trading Economics analysts’ expectations and global macro model forecasts, the value of IBM securities may decline to $186.63 by the end of the third quarter of 2024. During the year, the stock is expected to decrease to the level of $179.88.
Stock Analysis
Price range in 2024: $130.00 – $220.00 (as of August 26, 2024).
The Stock Analysis portal forecasts that IBM will have an average price target of $183.86 in 2024. The minimum price is projected to be approximately $130.00, while the maximum price is expected at $220.00 per share.
| Year | Minimum, $ | Average, $ | Maximum, $ |
|---|---|---|---|
| 2024 | 130.00 | 183.86 | 220.00 |
CoinCodex
Price range in 2024: $164.13 – $188.76 (as of August 26, 2024).
CoinCodex experts forecast that IBM’s average share price will be $164.13 at the end of 2024. Despite bullish market sentiment, analysts have predicted a 15.63% decline in price.
| Year | Average price, $ | Change,% |
|---|---|---|
| 2024 | 164.13 | -15.63% |
CoinPriceForecast
Price range in 2024: $167.00 – $201.00 (as of August 26, 2024).
Analysts at CoinPriceForecast estimate that IBM’s price could exceed $200.00 and maintain at the $201.00 level through the end of 2024.
| Year | Year-End, $ | Change,% |
|---|---|---|
| 2024 | 201.00 | 3% |
Longforecast
Price range in 2024: $180.00 – $264.00 (as of August 26, 2024).
Analysts at Longforecast predict that IBM’s stock price will range between $180.00 and $264.00 by the end of 2024. The rate is expected to peak at $264.00 in November before declining to $211.00 by the end of December.
| Month | Open, $ | Low–High, $ | Close, $ |
|---|---|---|---|
| September | 204.00 | 182.00–231.00 | 214.00 |
| October | 214.00 | 214.00–259.00 | 240.00 |
| November | 240.00 | 224.00–264.00 | 244.00 |
| December | 244.00 | 194.00–244.00 | 211.00 |
WalletInvestor
Price range in 2024: $188.67 – $194.91 (as of August 26, 2024).
Analysts at WalletInvestor offer a more conservative outlook for IBM shares. They project a decline in IBM quotes over the next two months to $188.92, with an estimated price of $194.07 by the end of the year.
| Month | Opening price, $ | Closing price, $ | Minimum price, $ | Maximum price, $ |
|---|---|---|---|---|
| September | 192.19 | 194.55 | 192.19 | 194.85 |
| October | 194.91 | 188.92 | 188.67 | 194.91 |
| November | 188.86 | 192.01 | 188.69 | 192.01 |
| December | 191.98 | 194.07 | 191.98 | 194.07 |
Gov Capital
Price range in 2024: $188.64 – $202.86 (as of August 26, 2024).
Analysts at Gov Capital estimate that the IBM average price for the next four months will range between $188.64 and $202.86. The minimum possible price is expected to settle near $160.34, while the maximum possible price is expected to approach $233.29.
| Date | Average price, $ | Least possible price, $ | Best possible price, $ |
|---|---|---|---|
| September 1, 2024 | 194.02 | 164.92 | 223.13 |
| September 30, 2024 | 188.64 | 160.34 | 216.94 |
| October 1, 2024 | 190.36 | 161.81 | 218.92 |
| October 31, 2024 | 191.61 | 162.87 | 220.35 |
| November 1, 2024 | 192.18 | 163.35 | 221.00 |
| November 30, 2024 | 197.25 | 167.66 | 226.83 |
| December 1, 2024 | 198.44 | 168.67 | 228.21 |
| December 31, 2024 | 202.86 | 172.43 | 233.29 |
30Rates
Price range in 2024: $179.70 – $260.23 (as of August 26, 2024).
The 30Rates experts suggest that the IBM price will peak at $260.23 in November 2024. After this, a decline is anticipated, with the asset value reaching $208.00 by the end of the year.
| Month | Open, $ | Low-High, $ | Close, $ |
|---|---|---|---|
| September | 202.89 | 181.43-230.17 | 211.45 |
| October | 211.45 | 211.45-256.46 | 237.46 |
| November | 237.46 | 221.67-260.23 | 240.95 |
| December | 240.95 | 192.01-240.95 | 208.71 |
Panda Forecast
Price range in 2024: $201.60 – $244.80 (as of August 26, 2024).
PandaForecast anticipates that positive market dynamics will persist throughout the rest of 2024. Consequently, experts project that the price will reach $229.20, with the highest and lowest values of $224.00 and $240.40, respectively.
| Month | Average price, $ | Minimum price, $ | Maximum price, $ |
|---|---|---|---|
| September | 207.60 | 201.60 | 214.40 |
| October | 223.20 | 214.40 | 232.00 |
| November | 229.20 | 222.40 | 244.80 |
| December | 229.20 | 224.00 | 240.40 |
IBM Stock Technical Analysis
This technical analysis uses H4, D1, W1, and MN time frames to gain a more accurate forecast and insight into the future dynamics of IBM. In addition, we will employ technical indicators such as MACD, the RSI, MA Cross, and the MFI, along with tick volume. By using these tools, we can ascertain the pivotal support and resistance levels, gauge the strength of the prevailing market trend, and monitor trading volumes and cash flow.
In addition to technical indicators, it is important to consider candlestick and chart patterns in your analysis. This will enhance the efficiency of the assessment and assist in identifying optimal entry points, as well as potential price reversal levels or pivot points.
Candlestick analysis and Price Action strategy deals with several reversal patterns, including “Hammer” and “Hanging man” candlestick patterns, “Triangle” and “Pennant” chart patterns, as well as “Doji” and “Engulfing” candlesticks.
In order to evaluate the current market situation, it is first necessary to examine the monthly chart.
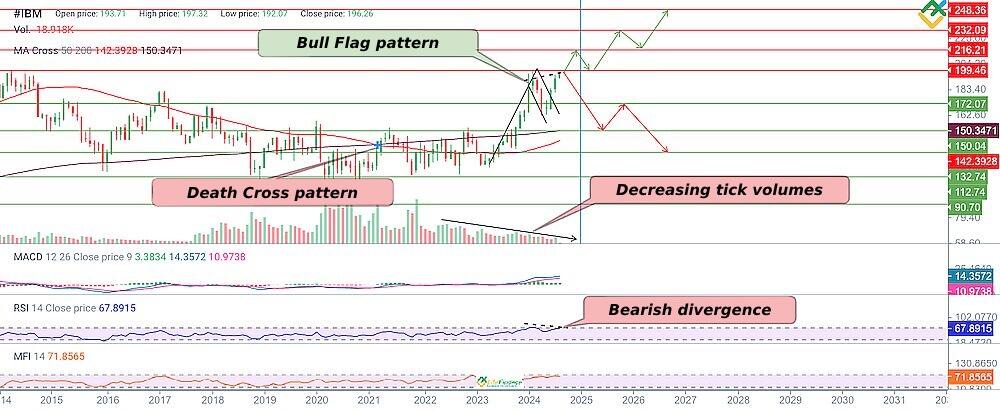
The price has formed the “Bull flag” pattern and pierced its upper boundary in June 2024. The projected price target is $248.36, according to the pattern.
Nevertheless, this pattern may remain incomplete as the MFI shows increased market volume, while tick volume has decreased, pointing to a lack of interest among market participants in purchasing IBM shares, i.e., subdued demand.
The RSI indicator has formed a bearish divergence, signaling an impending downward reversal or potential correction. MACD values are declining in the positive zone, approaching the zero boundary.
The MA Cross indicator is still displaying a “Death cross” pattern. The MA50 is located below the MA200, which demonstrates the weakness of the bullish trend in the market.
The preliminary analysis of IBM shares has revealed that the stock may continue to rise. Although growth will unlikely be as strong as initially anticipated. In addition, the price will likely start a downward correction in the near term.
blog
Promo code
#IBM Stock Analysis For Next Three Months
Let’s conduct a technical analysis using the H4 and D1 charts to determine the likely trajectory of IBM stock prices in the coming months.
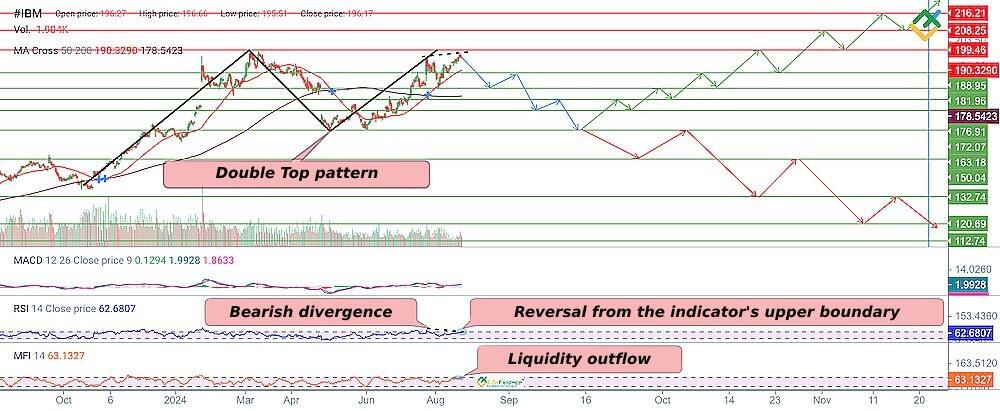
On the 4-hour chart, the asset is developing a large “Double top” pattern.
The MFI indicator shows an outflow of funds from the asset as the indicator values rebounded from the upper boundary. MACD is hovering near zero, which indicates a waning uptrend.
The RSI is forming a bearish divergence, and its values reverse near the upper boundary to the downside, signaling a potential trend reversal.
Nevertheless, the price is trading above the MA50 and MA200. These MAs offer strong support levels.
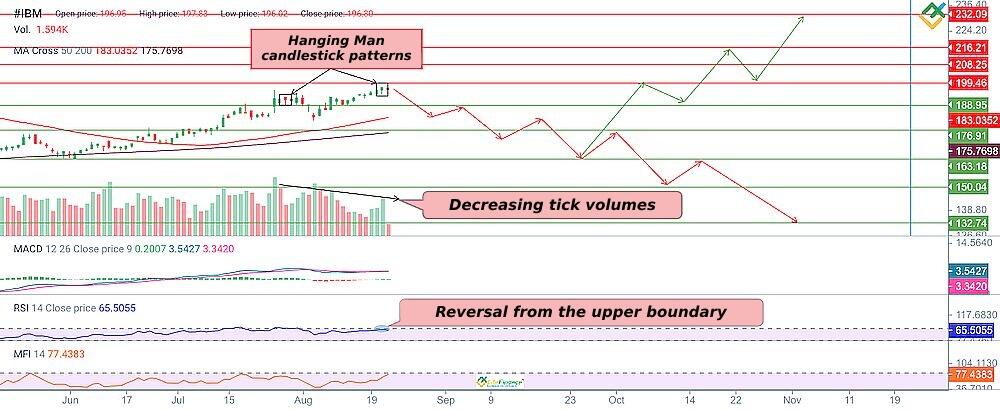
On the daily chart, the price continues to move within a global uptrend above $196.08. Notably, there are several “Hanging man” candlestick patterns in the range of $188.95–$199.46. These patterns assume that the price has reached its highs, and a potential downward trend reversal may be imminent.
In addition, trading volumes are declining. The growth in the MFI values suggests an inflow of funds into the trading instrument. However, this may be a short-term increase before the prices decline.
The RSI has rebounded from the upper boundary, indicating that bears may have attempted to reverse the uptrend. The MACD indicator hints at the possibility of a weakening in the bullish trend.
The indicator values are in the positive zone, but there are no clear buy signals near the zero boundary. The analysis projects that a trend reversal or correction is possible in the next three months. If IBM’s price breaks through the key support at $188.95, it will likely continue to decline to $176.91–$132.74.
An alternative scenario suggests that bulls gain a foothold above $199.46, which would allow them to open more long positions with targets in the area of $208.25–$232.09.
Long-Term IBM Shares Technical Analysis for 2024
Let’s analyze the weekly chart to determine IBM’s stock price performance through the end of 2024.
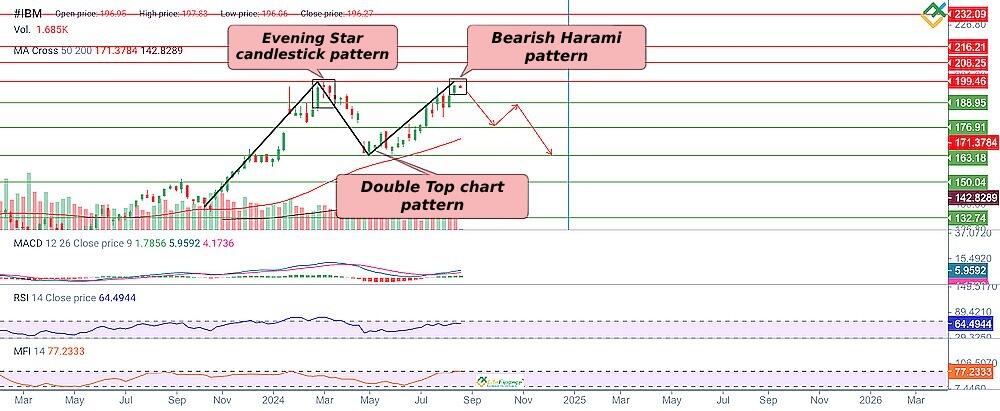
On the weekly chart, the asset formed a “Double top” pattern with “Evening star” and “Bearish harami” bearish patterns at its tops. The combination of these patterns indicates that bulls encountered significant bearish pressure at the level of $199.46. As a result, IBM shares faced a sell-off.
Nevertheless, the MACD indicator values are steadily increasing in the positive zone, suggesting that the uptrend is moderately strong. The RSI is nearing the upper boundary at 64, implying a potential for further growth.
Since the end of July, market volumes on the MFI indicator have remained high, although there has been a decline in tick volume. This suggests a lack of demand for the asset.
IBM is projected to decline to $163.18 by the end of 2024. The fall will likely intensify if the asset breaches the $188.95 level.
On the contrary, if the price consolidates above $199.46 on increased volumes, the quotes may soar to $208.25–$248.36.
| Month | #IBM Projected Values | |
|---|---|---|
| Minimum, $ | Maximum, $ | |
| September | 186.77 | 198.22 |
| October | 177.54 | 187.88 |
| November | 174.22 | 188.62 |
| December | 164.99 | 174.96 |
Long-Term Trading Plan for IBM Corporation (#IBM)
The outlook for IBM Corporation shares remains vulnerable to a potential downward trend reversal or correction through the end of 2024.
The conducted technical analysis allowed us to determine key support and resistance levels, providing valuable insights for the development of a robust trading strategy.
Trading strategy for 3 months
- On the daily chart, the formation of “Hanging man” candlestick patterns in the area of $188.95–$199.46 signals that the asset has reached its peak values and points to a potential downward trend reversal.
- If the price pierces the key support of $188.95, consider short trades with targets in the area of $176.91–$132.74.
- Conversely, the price may settle above $199.46 and grow to the area of $208.25–$232.09.
- Key support levels: $188.95, $183.03, $176.91, $175.76, $163.18, $150.04, $132.74.
- Key resistance levels: $199.46, $208.25, $216.21, $232.09.
Trading strategy for 2024
- The large “Double top” pattern may be formed on the weekly chart. After that, the price may drop to $132.74.
- If the quotes consolidate below $188.95, the uptrend will reverse. The asset will continue to plunge to the area of $176.91–$132.74.
- Key support levels: $188.95, $176.91, $171.37, $163.18, $150.04, $142.82, $132.74.
- Key resistance levels: $199.46, $208.25, $216.21, $232.09.
IBM Stock Forecast 2025
Most analysts remain optimistic about IBM stock in 2025. Some experts anticipate growth to the level of $370.00.
CoinCodex
Price range in 2025: $188.76 – $196.26 (as of August 26, 2024).
CoinCodex analysts predict that IBM’s price will range between $188.76–$196.26, hitting $196.26 by the end of the year.
| Year | Average price, $ |
|---|---|
| 2025 | 196.26 |
LongForecast
Price range in 2025: $196.00 – $370.00 (as of August 26, 2024).
For the first half of 2025, experts at LongForecast expect IBM stock to trade in the range of $196.00–$309.00. In the second half of the year, the rally is expected to continue up to $343.00 by the end of the year.
| Month | Open, $ | Low–High, $ | Close, $ |
|---|---|---|---|
| January | 211.00 | 196.00–230.00 | 213.00 |
| February | 213.00 | 197.00–231.00 | 214.00 |
| March | 214.00 | 214.00–265.00 | 245.00 |
| April | 245.00 | 230.00–270.00 | 250.00 |
| May | 250.00 | 250.00–298.00 | 276.00 |
| June | 276.00 | 263.00–309.00 | 286.00 |
| July | 286.00 | 267.00–313.00 | 290.00 |
| August | 290.00 | 275.00–323.00 | 299.00 |
| September | 299.00 | 294.00–346.00 | 320.00 |
| October | 320.00 | 304.00–356.00 | 330.00 |
| November | 330.00 | 313.00–367.00 | 340.00 |
| December | 340.00 | 316.00–370.00 | 343.00 |
Coin Price Forecast
Price range in 2025: $213.00 – $216.00 (as of August 26, 2024).
Coin Price Forecast estimates that IBM securities could rise to $213.00 by mid-2025. By the end of the year, the price may surge to $216.00.
| Year | Mid-Year, $ | Year-End, $ |
|---|---|---|
| 2025 | 213.00 | 216.00 |
WalletInvestor
Price range in 2025: $194.12 – $208.66 (as of August 26, 2024).
According to WalletInvestor‘s expert forecasts, IBM’s value will range between $194.12 and $208.66 during 2025. By the end of the first half of the year, quotes may reach the level of $202.87. The IBM rate will rise to $208.57 until the end of July and start to decline, hitting a low of $200.49 in October.
| Month | Opening price, $ | Closing price, $ | Minimum price, $ | Maximum price, $ |
|---|---|---|---|---|
| January | 194.12 | 199.01 | 194.12 | 199.01 |
| February | 199.01 | 200.09 | 199.01 | 200.23 |
| March | 199.74 | 203.29 | 199.74 | 203.29 |
| April | 203.83 | 203.34 | 203.04 | 204.36 |
| May | 203.34 | 203.43 | 202.56 | 203.43 |
| June | 203.43 | 202.87 | 202.87 | 204.54 |
| July | 203.26 | 208.57 | 203.26 | 208.66 |
| August | 208.42 | 204.15 | 204.01 | 208.42 |
| September | 203.81 | 206.59 | 203.81 | 206.59 |
| October | 206.52 | 200.49 | 200.42 | 206.52 |
| November | 200.24 | 203.52 | 200.24 | 203.52 |
| December | 203.49 | 205.66 | 203.49 | 205.66 |
30 Rates
Price range in 2025: $193.68 – $365.89 (as of August 26, 2024).
Analysts at 30Rates give a more optimistic outlook on IBM stock for 2025. The price will continue to rise and reach $338.79 by the end of the year, touching a yearly high of $365.89.
| Month | Open, $ | Low–High, $ | Close, $ |
|---|---|---|---|
| January | 208.71 | 193.68–227.36 | 210.52 |
| February | 210.52 | 195.02–228.94 | 211.98 |
| March | 211.98 | 211.98–261.62 | 242.24 |
| April | 242.24 | 227.03–266.51 | 246.77 |
| May | 246.77 | 246.77–294.28 | 272.48 |
| June | 272.48 | 259.79–304.97 | 282.38 |
| July | 282.38 | 263.15–308.91 | 286.03 |
| August | 286.03 | 271.61–318.85 | 295.23 |
| September | 295.23 | 290.93–341.53 | 316.23 |
| October | 316.23 | 299.87–352.03 | 325.95 |
| November | 325.95 | 308.74–362.44 | 335.59 |
| December | 335.59 | 311.69–365.89 | 338.79 |
Gov Capital
Price range in 2025: $169.56 – $359.14 (as of August 26, 2024).
Analysts at Gov Capital estimate that IBM’s average price target for the first half of 2025 will range from $199.48–$208.45.
In the second half of the year, the value of the asset will skyrocket to $312.30 by the year-end.
| Date | Average price, $ | Least possible price, $ | Best possible price, $ |
|---|---|---|---|
| January 1, 2025 | 202.69 | 172.28 | 233.09 |
| January 31, 2025 | 207.86 | 176.68 | 239.03 |
| February 1, 2025 | 208.45 | 177.18 | 239.72 |
| February 28, 2025 | 202.69 | 172.29 | 233.09 |
| March 1, 2025 | 202.99 | 172.54 | 233.44 |
| March 31, 2025 | 207.94 | 176.75 | 239.13 |
| April 1, 2025 | 207.33 | 176.23 | 238.42 |
| April 30, 2025 | 200.00 | 170.00 | 230.00 |
| May 1, 2025 | 199.48 | 169.56 | 229.41 |
| May 31, 2025 | 202.44 | 172.08 | 232.81 |
| June 1, 2025 | 202.84 | 172.42 | 233.27 |
| June 30, 2025 | 207.38 | 176.27 | 238.49 |
| July 1, 2025 | 208.45 | 177.18 | 239.71 |
| July 31, 2025 | 214.57 | 182.38 | 246.75 |
| August 1, 2025 | 213.84 | 181.76 | 245.91 |
| August 31, 2025 | 298.75 | 253.93 | 343.56 |
| September 1, 2025 | 298.28 | 253.53 | 343.02 |
| September 30, 2025 | 292.16 | 248.33 | 335.98 |
| October 1, 2025 | 292.90 | 248.96 | 336.83 |
| October 31, 2025 | 300.32 | 255.27 | 345.36 |
| November 1, 2025 | 301.10 | 255.93 | 346.26 |
| November 30, 2025 | 310.37 | 263.81 | 356.93 |
| December 1, 2025 | 311.36 | 264.66 | 358.07 |
| December 31, 2025 | 312.30 | 265.45 | 359.14 |
Panda Forecast
Price range in 2025: $186.54 – $258.52 (as of August 26, 2024).
PandaForecast analysts are positive about the future of IBM stock in 2025. Thus, the quotes will vary in the range of $186.54–$258.52.
In the first half of the year, the growth will continue to the $240.48 mark, the annual maximum will be $258.52. However, the rate will decline and settle at $211.94 by the end of 2025.
| Month | Average price, $ | Minimum price, $ | Maximum price, $ |
|---|---|---|---|
| January | 238.82 | 229.63 | 258.52 |
| February | 244.86 | 225.20 | 250.52 |
| March | 232.47 | 214.06 | 251.14 |
| April | 226.34 | 206.42 | 239.28 |
| May | 231.57 | 215.01 | 246.34 |
| June | 240.48 | 225.93 | 247.62 |
| July | 232.02 | 214.66 | 237.38 |
| August | 211.34 | 195.30 | 229.94 |
| September | 199.95 | 186.54 | 211.61 |
| October | 209.63 | 201.33 | 222.08 |
| November | 210.78 | 194.09 | 223.07 |
| December | 211.94 | 201.92 | 229.66 |
IBM Stock Forecast 2026
Analysts are forecasting a continuation of the IBM bull market rally into 2026. Various estimates indicate that the stock price could ascend to levels between $287.00 and $452.72.
WalletInvestor
Price range in 2026: $205.75 – $220.27 (as of August 26, 2024).
Analysts at WalletInvestor anticipate that IBM’s valuation could reach $210.49 per share in early 2026, increasing to $217.29 by December, with projected peaks at $220.27 in July.
| Month | Opening price, $ | Closing price, $ | Minimum price, $ | Maximum price, $ |
|---|---|---|---|---|
| 2026 | ||||
| January | 205.75 | 210.49 | 205.75 | 210.49 |
| February | 210.52 | 211.75 | 210.52 | 211.87 |
| March | 211.39 | 215.28 | 211.39 | 215.28 |
| April | 215.39 | 215.00 | 214.72 | 215.99 |
| May | 214.91 | 214.95 | 214.20 | 214.95 |
| June | 214.93 | 214.90 | 214.54 | 216.15 |
| July | 214.86 | 220.15 | 214.86 | 220.27 |
| August | 219.53 | 215.44 | 215.44 | 219.77 |
| September | 215.83 | 218.19 | 215.64 | 218.22 |
| October | 218.19 | 212.16 | 212.16 | 218.19 |
| November | 211.82 | 215.01 | 211.82 | 215.03 |
| December | 215.50 | 217.29 | 215.50 | 217.29 |
Gov Capital
Price range in 2026: $261.92 – $520.63 (as of August 26, 2024).
Gov Capital experts give positive forecasts on IBM shares. The average price in the middle of the year will stand at $316.58 and climb $452.72 by December.
| Date | Average price, $ | Least possible price, $ | Best possible price, $ |
|---|---|---|---|
| January 1, 2026 | 311.88 | 265.10 | 358.66 |
| January 31, 2026 | 319.47 | 271.55 | 367.39 |
| February 1, 2026 | 319.72 | 271.76 | 367.68 |
| February 28, 2026 | 316.24 | 268.81 | 363.68 |
| March 1, 2026 | 316.76 | 269.24 | 364.27 |
| March 31, 2026 | 320.68 | 272.58 | 368.79 |
| April 1, 2026 | 319.98 | 271.99 | 367.98 |
| April 30, 2026 | 308.60 | 262.31 | 354.89 |
| May 1, 2026 | 308.14 | 261.92 | 354.37 |
| May 31, 2026 | 310.14 | 263.62 | 356.66 |
| June 1, 2026 | 310.08 | 263.57 | 356.60 |
| June 30, 2026 | 316.58 | 269.09 | 364.06 |
| July 1, 2026 | 317.77 | 270.11 | 365.44 |
| July 31, 2026 | 329.27 | 279.88 | 378.66 |
| August 1, 2026 | 327.84 | 278.66 | 377.02 |
| August 31, 2026 | 441.31 | 375.11 | 507.51 |
| September 1, 2026 | 441.85 | 375.57 | 508.12 |
| September 30, 2026 | 436.04 | 370.63 | 501.44 |
| October 1, 2026 | 436.83 | 371.30 | 502.35 |
| October 31, 2026 | 441.16 | 374.99 | 507.33 |
| November 1, 2026 | 442.12 | 375.80 | 508.44 |
| November 30, 2026 | 450.81 | 383.19 | 518.43 |
| December 1, 2026 | 452.72 | 384.81 | 520.63 |
| December 31, 2026 | 452.72 | 384.81 | 520.63 |
30Rates
Price range in 2026: $273.92 – $399.11 (as of August 26, 2024).
30Rates forecasts that the rate of IBM securities will reach the level of $297.74 at the end of April. However, experts predict that the downtrend may reverse, and the price will likely grow to $369.55 by the end of June. By the end of the year, the quotes will settle at $332.53.
| Month | Open, $ | Low–High, $ | Close, $ |
| 2026 | |||
| January | 338.79 | 318.73–374.17 | 346.45 |
| February | 346.45 | 302.45–355.05 | 328.75 |
| March | 328.75 | 290.00–340.44 | 315.22 |
| April | 315.22 | 273.92–321.56 | 297.74 |
| May | 297.74 | 295.64–347.06 | 321.35 |
| June | 321.35 | 321.35–399.11 | 369.55 |
| July | 369.55 | 311.54–369.55 | 338.63 |
| August | 338.63 | 305.93–359.13 | 332.53 |
Panda Forecast
Price range in 2026: $156.72 – $237.40 (as of August 26, 2024).
PandaForecast expects IBM stock to start a downtrend in 2026. At the beginning of the year, the average price will be $200.52. It is expected to decline to $196.77 in February and rapidly grow to $218.20 in March, followed by a trend reversal. By the end of the year, the rate will hit the $173.66 mark.
| Month | Average price, $ | Minimum price, $ | Maximum price, $ |
|---|---|---|---|
| 2026 | |||
| January | 200.52 | 190.15 | 216.40 |
| February | 196.77 | 189.19 | 211.49 |
| March | 218.20 | 200.92 | 237.40 |
| April | 196.59 | 179.51 | 212.60 |
| May | 189.03 | 178.01 | 195.68 |
| June | 185.28 | 174.48 | 200.16 |
| July | 179.37 | 173.65 | 190.82 |
| August | 171.28 | 165.44 | 183.15 |
| September | 170.72 | 160.95 | 175.98 |
| October | 161.70 | 156.72 | 165.62 |
| November | 173.09 | 158.24 | 182.61 |
| December | 173.66 | 166.78 | 186.84 |
CoinCodex
Price range in 2026: $196.75 – $197.34 (as of August 26, 2024).
According to CoinCodex experts, the average IBM stock price in 2026 is projected to range between $196.75–$197.34.
| Year | Average price, $ |
|---|---|
| 2026 | 196.84 |
LongForecast
Price range in 2026: $247.00 – $404.00 (as of August 26, 2024).
LongForecast estimates that IBM will trade in the range of $293.00-$379.00 in the first quarter of 2026. Mixed dynamics are expected, with a maximum price of $404.00 and a minimum price of $247.00.
| Month | Open, $ | Low–High, $ | Close, $ |
|---|---|---|---|
| 2026 | |||
| January | 343.00 | 323.00–379.00 | 351.00 |
| February | 351.00 | 306.00–360.00 | 333.00 |
| March | 333.00 | 293.00–345.00 | 319.00 |
| April | 319.00 | 277.00–325.00 | 301.00 |
| May | 301.00 | 299.00–351.00 | 325.00 |
| June | 325.00 | 325.00–404.00 | 374.00 |
| July | 374.00 | 316.00–374.00 | 343.00 |
| August | 343.00 | 310.00–364.00 | 337.00 |
| September | 337.00 | 290.00–340.00 | 315.00 |
| October | 315.00 | 247.00–315.00 | 268.00 |
| November | 268.00 | 268.00–325.00 | 301.00 |
| December | 301.00 | 281.00–329.00 | 305.00 |
Coin Price Forecast
Price range in 2026: $251.00 – $287.00 (as of August 26, 2024).
Analysts at CoinPriceForecast anticipates the IBM price to increase to $251.00 by the middle of 2026. By the end of the year, the value will grow to $287.00.
| Year | Mid-Year, $ | Year-End, $ |
|---|---|---|
| 2026 | 251.00 | 287.00 |
How Has the Price of IBM Stock Changed Over Time?
IBM, a dominant force in the American and global computer market, has undergone significant transformations since its inception in 1911. Originally the Computing-Tabulating-Recording Company, it became International Business Machines Corporation in 1924. Known for its pioneering role in punch-card tabulating systems, IBM expanded into electric typewriters in 1933 and later played a crucial role in developing electromechanical calculators, precursors to electronic computers.
Under Thomas Watson Jr.’s leadership in the 1950s, IBM aggressively entered the electronic data-processing market, quickly dominating the American computer industry. By the 1960s, IBM produced 70% of the world’s computers. However, the rise of semiconductor technologies and smaller competitors in the 1980s and 1990s challenged IBM’s dominance, leading to a strategic shift away from manufacturing personal computers.
In the 2000s, IBM made significant divestitures, selling its magnetic hard drive business to Hitachi in 2002 and its PC division to Lenovo in 2005. These moves marked a strategic pivot towards computer services, software, supercomputing, and scientific research.
Long-Term IBM Stock Price Prediction 2027–2030
Most analysts offer optimistic projections for IBM stock over the 2027–2030 period.
LongForecast
According to LongForecast, IBM stock is expected to range between $243.00–$431.00 and close the year at $399.00.
In the first half of 2028, the stock will trade at $311.00–$424.00 and reach $385.00 by the end of September.
| Month | Open, $ | Low–High, $ | Close, $ |
|---|---|---|---|
| 2027 | |||
| January | 305.00 | 243.00–305.00 | 264.00 |
| February | 264.00 | 245.00–287.00 | 266.00 |
| March | 266.00 | 247.00–289.00 | 268.00 |
| April | 268.00 | 268.00–330.00 | 306.00 |
| May | 306.00 | 287.00–337.00 | 312.00 |
| June | 312.00 | 312.00–373.00 | 345.00 |
| July | 345.00 | 329.00–387.00 | 358.00 |
| August | 358.00 | 313.00–367.00 | 340.00 |
| September | 340.00 | 323.00–379.00 | 351.00 |
| October | 351.00 | 346.00–406.00 | 376.00 |
| November | 376.00 | 357.00–419.00 | 388.00 |
| December | 388.00 | 367.00–431.00 | 399.00 |
| 2028 | |||
| January | 399.00 | 353.00–415.00 | 384.00 |
| February | 384.00 | 362.00–424.00 | 393.00 |
| March | 393.00 | 343.00–403.00 | 373.00 |
| April | 373.00 | 329.00–387.00 | 358.00 |
| May | 358.00 | 311.00–365.00 | 338.00 |
| June | 338.00 | 336.00–394.00 | 365.00 |
| July | 365.00 | 365.00–454.00 | 420.00 |
| August | 420.00 | 354.00–420.00 | 385.00 |
| September | 385.00 | 348.00–408.00 | 378.00 |
Coin Price Forecast
According to Coin Price Forecast, the value of the asset is predicted to reach $290.00 by mid-2027 and $320.00 by the end of the year.
In 2030, the upward trajectory will persist, with quotes reaching $400.00. Over the long term, IBM’s stock price is projected to ascend to $528.00 by 2036.
| Year | Mid-Year, $ | Year-End, $ |
|---|---|---|
| 2027 | 290.00 | 320.00 |
| 2028 | 322.00 | 327.00 |
| 2029 | 342.00 | 370.00 |
| 2030 | 389.00 | 400.00 |
| 2031 | 408.00 | 417.00 |
| 2032 | 426.00 | 435.00 |
| 2033 | 445.00 | 455.00 |
| 2034 | 466.00 | 477.00 |
| 2035 | 489.00 | 501.00 |
| 2036 | 514.00 | 528.00 |
WalletInvestor
WalletInvestor estimates that the IBM price will continue to rise, reaching $252.27 by August 2029.
| Month | Opening price, $ | Closing price, $ | Minimum price, $ | Maximum price, $ |
|---|---|---|---|---|
| 2027 | ||||
| January | 217.30 | 221.96 | 217.26 | 221.96 |
| February | 222.02 | 223.40 | 222.02 | 223.51 |
| March | 223.04 | 226.84 | 223.04 | 226.84 |
| April | 227.01 | 226.58 | 226.41 | 227.61 |
| May | 226.19 | 226.43 | 225.85 | 226.56 |
| June | 226.93 | 226.51 | 226.23 | 227.79 |
| July | 226.52 | 231.84 | 226.36 | 231.91 |
| August | 231.32 | 227.47 | 227.09 | 231.59 |
| September | 227.43 | 229.85 | 227.20 | 229.85 |
| October | 229.77 | 223.86 | 223.86 | 229.77 |
| November | 223.44 | 227.01 | 223.44 | 227.01 |
| December | 227.07 | 228.85 | 227.07 | 228.85 |
| 2028 | ||||
| January | 228.77 | 233.50 | 228.77 | 233.50 |
| February | 234.02 | 235.07 | 234.02 | 235.15 |
| March | 235.02 | 238.55 | 234.65 | 238.55 |
| April | 238.60 | 238.25 | 238.11 | 239.24 |
| May | 237.85 | 238.50 | 237.50 | 238.50 |
| June | 238.63 | 238.09 | 237.96 | 239.45 |
| July | 237.88 | 243.07 | 237.88 | 243.51 |
| August | 243.37 | 239.09 | 238.75 | 243.37 |
| September | 239.03 | 241.42 | 238.78 | 241.47 |
| October | 240.99 | 235.47 | 235.09 | 241.30 |
| November | 235.44 | 238.71 | 235.41 | 238.71 |
| December | 238.74 | 240.41 | 238.70 | 240.42 |
| 2029 | ||||
| January | 240.29 | 245.59 | 240.29 | 245.59 |
| February | 245.72 | 246.67 | 245.72 | 246.78 |
| March | 246.68 | 249.99 | 246.27 | 249.99 |
| April | 250.10 | 249.52 | 249.52 | 250.90 |
| May | 249.88 | 250.13 | 249.11 | 250.13 |
| June | 250.17 | 249.74 | 249.71 | 251.09 |
| July | 249.44 | 255.12 | 249.44 | 255.12 |
| August | 255.00 | 252.27 | 252.27 | 255.00 |
CoinCodex
CoinCodex analysts give neutral forecasts for IBM stock until 2030. Thus, the average price will remain unchanged in 2027–2030, ranging between $197.43 and $199.19.
| Year | Average price, $ |
|---|---|
| 2027 | 197.43 |
| 2028 | 198.01 |
| 2029 | 198.60 |
| 2030 | 199.19 |
Gov Capital
Gov Capital provides extremely optimistic forecasts on the rate of IBM until 2029. By the end of 2027, the share price will grow to $455.75, and by August 2029, the average price will be $936.46. At the same time, experts do not rule out further growth up to $1,076.93.
| Date | Average price, $ | Least possible price, $ | Best possible price, $ |
|---|---|---|---|
| January 1, 2027 | 455.75 | 387.39 | 524.12 |
| December 31, 2027 | 455.75 | 387.39 | 524.12 |
| January 1, 2028 | 639.94 | 543.94 | 735.93 |
| December 31, 2028 | 789.95 | 671.46 | 908.45 |
| January 1, 2029 | 788.96 | 670.62 | 907.30 |
| August 23, 2029 | 936.46 | 795.99 | 1,076.93 |
Factors that Can Affect the IBM Stock Price

Market and Economic Factors
- Global Economic Conditions: Fluctuations in the global economy, including interest rates and inflation, can impact IBM’s business clients and, consequently, its revenue and stock price.
- Technology Sector Dynamics: Rapid changes in technology and competition from other tech giants will influence IBM’s market position and ability to maintain or increase its market share.
Stock Price Predictions and Investment Sentiment
- Analyst Predictions: Analyst sentiment, often reflected in stock price forecasts and recommendations (buy, sell, hold), can significantly influence short-term stock movements.
- Investor Confidence: IBM’s ability to meet or exceed Wall Street expectations regarding earnings growth and strategic goals will affect investor confidence and stock performance.
Technical Analysis and Market Trends:
- Price Targets and Technical Indicators: Technical analysis, including historical price, support, resistance levels, etc., can provide insights into potential future stock price movements.
- Market Trends: Broader market trends will impact IBM’s stock, especially in technology. For instance, a bullish market in tech stocks could see IBM’s stock rise, while a bearish trend might lead to declines.
What is the IBM Stock Future? Are IBM Stocks a Good Investment?
IBM has a proven track record of stability and an adaptable business model. The company’s products have enjoyed high demand throughout its long history. This has continuously captured the interest of investors.
In the digital age, IBM is a market leader in cloud computing. The company focuses on artificial intelligence and software technologies, which ensures IBM’s future growth. However, IBM faces intense competition from numerous new IT projects.
One of IBM’s key advantages is its established history. The company’s stability and consistent growth have gained the approval of numerous stock experts, who view IBM’s shares as a lucrative investment.
Is IBM a good investment? Indeed, the stock looks like a profitable and promising investment. In addition, IBM securities have attracted significant investor interest due to their high dividend yield.
Conclusion
The majority of analysts and independent experts project a favorable outlook for IBM’s future trajectory. The average price is predicted to reach $201.00–$220.00 by the end of 2024. Looking ahead to 2025–2030, analysts expect the stock to showcase a gradual appreciation in value to reach $400.00 by 2030. Some experts anticipate an increase to the $420.00–$454.00 range.
Given the current market uncertainty and high volatility in the technology sector, analysts are offering a moderate outlook, which they are characterizing as “cautious optimism.” IBM shares represent an attractive investment opportunity with significant growth potential and a high dividend yield. However, it is important to consider the potential risks.
It is essential to analyze IBM’s economic indicators and other fundamental factors that may affect the share price before making investment decisions.
FAQs on IBM Stock Price Prediction
The current price that #IBM is trading at is around $198.85 per share as of today 30.08.2024.
Analysts project that IBM will have an average price target of $183.86 in 2024. The minimum price is anticipated to hover near $130.00, with the maximum price at $220.00. However, some experts project a rise in the stock value to $244.80–$264.00.
According to analysts’ forecasts, IBM quotes will range between $258.52 and $312.30 in 2025. Some experts do not exclude strong growth to $365.89–$370.00. According to more conservative forecasts, IBM shares will trade in the area of $196.26–$216.00.
Experts give a mixed outlook for IBM stock over the next five years. Most analysts estimate that the price will exceed $400.00, ranging between $420.00 and $454.00. The most optimistic predictions suggest that the price will hit the $936.46 mark.
According to various estimates, IBM’s value could exceed $400.00 and reach $408.00 per share in 2030.
A review of analyst recommendations for IBM reveals that 14 stock experts have offered a “buy” recommendation, while three have opted for an “aggressive buy” and six have advised a “hold” stance. One analyst has recommended selling, while two have suggested an “aggressive sell.” Given IBM’s current valuation and outlook, the stock can be considered a promising long-term investment.
Price chart of IBM in real time mode

The content of this article reflects the author’s opinion and does not necessarily reflect the official position of LiteFinance. The material published on this page is provided for informational purposes only and should not be considered as the provision of investment advice for the purposes of Directive 2004/39/EC.
{{value}} ( {{count}} {{title}} )
This post is originally published on LITEFINANCE.