The EURUSD is one of the major and most traded currency pairs in the Forex market. Traders analyze its future price not only for trading purposes but also to gauge the economic conditions of the EU and the US, along with the global market sentiment.
Since the pair is widely traded, predicting its exchange rate from a long-term investment perspective can be challenging. The EURUSD exchange rate movement is influenced by interest rate differentials, inflation, unemployment rates, trade, and capital flows. At the same time, much of the pricing is related to unforeseen event risks and market sentiment changes. Let’s analyze the EURUSD exchange rate.
The article covers the following subjects:
Highlights and Key Points
-
The EURUSD is expected to continue trading flat with the boundaries of 1.0981–1.0601 in the short term.
-
In the medium term, the pair will reach the lower boundary of the flat near 1.0601. If the asset breaches this boundary, the price will trade in a new downtrend with the main target at the October 2023 low of 1.0448.
-
In the second half of 2024, the EURUSD quotes will depend on the US Fed’s interest rate decision in September and further market response. The US presidential election in November 2024 may also influence the rate significantly. The election outcome and its impact on the pair is hard to predict.
-
Analysts’ predictions for 2025 are mixed. While some experts anticipate the euro will trade more or less in the same ranges as in 2024, others suggest that the pair may grow to 1.2100 and higher.
-
Long-term forecasts suggest both negative and positive scenarios. A negative scenario assumes the pair may fall below 1.0000 and reach 0.9960 by the end of 2027.
-
A positive scenario implies steady EURUSD growth with smooth corrections over the next few years. At the end of 2027, the pair’s value may hit 1.3862 if circumstances are favorable.
-
General tendencies suggest that the currency pair decreases during market instability and tense geopolitical climate. However, its high liquidity makes the EURUSD pair a perfect tool for speculation.
EURUSD Characteristic Features
The EURUSD is a major currency pair on Forex, known for its high liquidity. This is not a surprise as it includes the world’s two major reserve currencies. Most Forex trades are made in EURUSD, comprising about 20% of the total volume.
The EURUSD rate serves as an indicator that compares the US and EU economies. If the US economy steadily grows and the EU faces problems, the EURUSD rate may drop. Conversely, if America’s growth rate declines and the eurozone thrives, the EURUSD will increase.
EURUSD key features:
-
Trading hours on Forex. The EURUSD pair is traded around the clock from Monday to Friday, with the highest activity occurring during the European and American sessions when trading volumes and rate movements are the most significant.
-
Volatility. The EURUSD pair is characterized by medium volatility. The asset can move by 100 pips and more during important news releases. The exchange rate performance analysis shows that the average daily EURUSD volatility is about 80 pips.
-
Spread is one of the main advantages of the EURUSD pair. Due to the highest liquidity, the EURUSD spread is the lowest. Typically, it does not exceed one pip on popular ECN accounts.
The US Dollar in 2024: Growth Attempts Ahead of the US Election
The early 2024 was favorable for the US currency. The Fed’s high interest rate of 5.50% attracted investments from major banks and hedge funds. A stable domestic political situation and oil prices above $70 per barrel contributed to a 1.4% US GDP growth in Q1 2024, exceeding analysts’ forecast of 1.3%.
The country has recovered from the COVID-19 pandemic thanks to the economic stimulus measures implemented by Joe Biden. Consumer spending remained steady, which bolstered economic growth. People continued spending money on goods and services, contributing to the economic recovery. The unemployment rate fell to 3.7% as of January 2024, positively impacting the economy. The job recovery continued and helped support consumer spending.
Inflation remained under control, allowing the US Fed to ease monetary policy slightly, although interest rates remained high. Government support programs introduced during the pandemic, like support for small businesses and direct payments to citizens, continued to positively impact the economy.
However, by summer 2024, unemployment began to rise and reached 4.1%, a 0.4% increase from the beginning of the year. The US national debt exceeded the $35 trillion mark.
Bloomberg Economics has conducted a million simulations on the US debt outlook. 88% of them show that borrowing is on an unsustainable path. The Congressional Budget Office warns in its predictions that US public debt will rise from last year’s 97% of GDP to 116% by 2034. The actual prospects are likely to be even worse. The foreign debt problem will be a major issue for the new US president.
The US dollar depreciation was observed from May to June 2024, mainly due to the unexpected withdrawal of incumbent President Joe Biden from the election race. Kamala Harris will represent the Democratic Party in the election instead. She will face former President Donald Trump in upcoming debates and elections in the fall of 2024. Markets are still processing this information, and the US dollar is trading in a narrow range.
Generally, two main forecasts for the US currency can be made depending on the outcome of the US presidential election. One scenario assumes the victory of the Democratic Party candidate and the other the victory of the Republican representative.
If the Democratic Party candidate wins, the US dollar will likely continue to strengthen. The global trend of the US dollar appreciation started in 2021, and now the asset is trading in an upward cycle. The current economic and fiscal policy will likely continue, and the US Fed will ease monetary policy.
If the Republican candidate wins, the US dollar may experience short-term volatility due to the uncertainty related to economic policy change. Depending on the new president’s policies, the US dollar may either strengthen or weaken.
Economists’ opinions on the possible victory of Donald Trump in the election in 2024 are mixed. Capital Economics believes that Trump’s victory may negatively affect the economy and the stock market. The company warns that Trump’s policies on tariffs and immigration could lead to slower economic growth and higher inflation. The Economist calls Trump’s possible victory one of the biggest threats to the global economy in 2024. It notes that his policies could create significant uncertainty and instability. However, UBS economists predict that some industries could benefit from a Republican victory.
Thus, the future of the US currency at the end of 2024 is uncertain. According to technical analysis, the US dollar is trading in a global uptrend. However, this trend may reverse if an opposition candidate wins the election.
The Euro in 2024: Continued Downward Trend
2024 began with the euro’s losses against the US dollar. Two distinct waves of EURUSD decline can be observed on the price chart in January and from March to April.
The euro depreciation was caused by slow economic development in late 2023 and early 2024 due to the ECB’s high interest rate and inflation. In January 2024, the rate was at 4.50%, which is too high for the bloc’s economy to grow.
The EU bloc’s economy is comprised of multiple member economies. The German economy is one of the most important in the EU. Due to the slow recovery from COVID-19, worsening geopolitical problems in 2022, and the energy crisis, the German economy registered a negative GDP in Q1 2024. Germany’s GDP for this period amounted to -0.2%. At the same time, some countries, such as Ireland and France, showed higher GDP growth, which affected the eurozone GDP. Eurozone GDP for Q1 amounted to 0.4%.
In Q2 2024, German GDP (preliminary data) was again negative and amounted to -0.1% against the forecast of 0.0%. Thus, some countries cannot reach solid growth, negatively affecting the eurozone GDP and the exchange rate of the single European currency.
High inflation is another problem for the ECB. According to official sources, in June 2024 (preliminary data), inflation in the EU reached 2.5% year-over-year, exceeding the Central Bank’s target of 2.0%.
Therefore, the ECB is balancing between two extremes: high inflation and low economic growth. The ECB cannot keep the interest rate at a high level because, in this case, economic growth will slow down. At the same time, the rate cannot be cut sharply. Otherwise, there will be a new spike in inflation. In addition to these problems, there is a high unemployment rate of 6.4% compared to 4.1% in the US.
From an economic perspective, the US dollar is more attractive for purchases than the euro. Europe still suffers from low GDP growth rates, high inflation, and problems in the labor sector. At the same time, the US is facing uncontrolled growth of foreign debt and upcoming presidential elections.
If the EU government manages to overcome the current economic problems and find a path to economic development without much damage to the labor sector, the euro will have a chance to strengthen. Meanwhile, if the current situation persists and economic problems worsen, the global downtrend started in 2021 will likely continue, and the euro will hit new lows.
EURUSD Current Rate
The current EURUSD exchange rate is $1.11757.
Euro/dollar weekly price forecast as of 19.08.2024
The euro continued its medium-term uptrend last week. As a result, the price has reached above the early August high and consolidated above the Target Zone 2, 1.0953 – 1.0937. The next bullish target is the Target Zone 3, 1.1121 – 1.1105.
Consider long trades on a correction at the support (A) 1.0882 – 1.0865 and support (B) 1.0798 – 1.0773. If the asset exceeds this week’s high in the course of trading, the support zones should be shifted.

EURUSD trading ideas for the week:
- Buy according to the pattern at support (A) 1.0882 – 1.0865. TakeProfit: 1.1045. StopLoss: at the breakeven.
- Buy according to the pattern at support (B) 1.0798 – 1.0773. TakeProfit: 1.1045. StopLoss: according to the pattern rules.
Technical analysis based on margin zones methodology is presented by an independent analyst, Alex Rodionov.
EURUSD Rate Forecast for 2024 – Experts Predictions
Forecasts for 2024 are mixed. Some analysts expect EURUSD to trade sideways until the end of the year, while others predict an increas
Long Forecast
Price range in 2024: $1.0550 – $1.1180 (as of July 31, 2024).
Long Forecast predicts that the pair will trade sideways for the remainder of 2024. No sharp volatility spikes are expected. The trading environment is expected to remain stable, with the asset’s value reaching the higher boundary of the 1.0940–1.1010 range between August and October, followed by a decline to 1.0890–1.0880 in November and December.
|
Month |
Opening, $ |
Low–High, $ |
Closing, $ |
Change, % |
|
August |
1.082 |
1.055–1.110 |
1.094 |
1.9% |
|
September |
1.094 |
1.067–1.113 |
1.083 |
0.8% |
|
October |
1.083 |
1.083–1.118 |
1.101 |
2.5% |
|
November |
1.101 |
1.073–1.105 |
1.089 |
1.4% |
|
December |
1.089 |
1.072–1.104 |
1.088 |
1.3% |
PandaForecast
Price range in 2024: $1.0698 – $1.1500 (as of July 31, 2024).
According to PandaForecast.com, the euro exchange rate will grow against the US dollar until the end of the year. Analysts expect a sharp strengthening of the EURUSD pair with the target of 1.1181 in August. The forecast then expects a decline to 1.0946 in September. At the end of the year, the asset will trade at 1.1147.
Besides, experts anticipate high volatility in 2024. A pessimistic forecast suggests that the price may reach 1.0698, while an optimistic forecast predicts the 1.1500 level. This is probably due to the accumulation of positions by large players, reflected by the current flat market structure. When the asset breaches one of the channel’s boundaries, the price usually shows sharp and robust movements.
|
Month |
Average price, $ |
Minimum, $ |
Maximum, $ |
Volatility, % |
|
August |
1.1181 |
1.0894 |
1.1500 |
5.27 % |
|
September |
1.0946 |
1.0698 |
1.1047 |
3.16 % |
|
October |
1.1102 |
1.0883 |
1.1359 |
4.19 % |
|
November |
1.1000 |
1.0769 |
1.1235 |
4.15 % |
|
December |
1.1147 |
1.0862 |
1.1438 |
5.04 % |
EURUSD Technical Analysis
Let’s review the daily EURUSD chart to analyze the historical movement of the quotes.
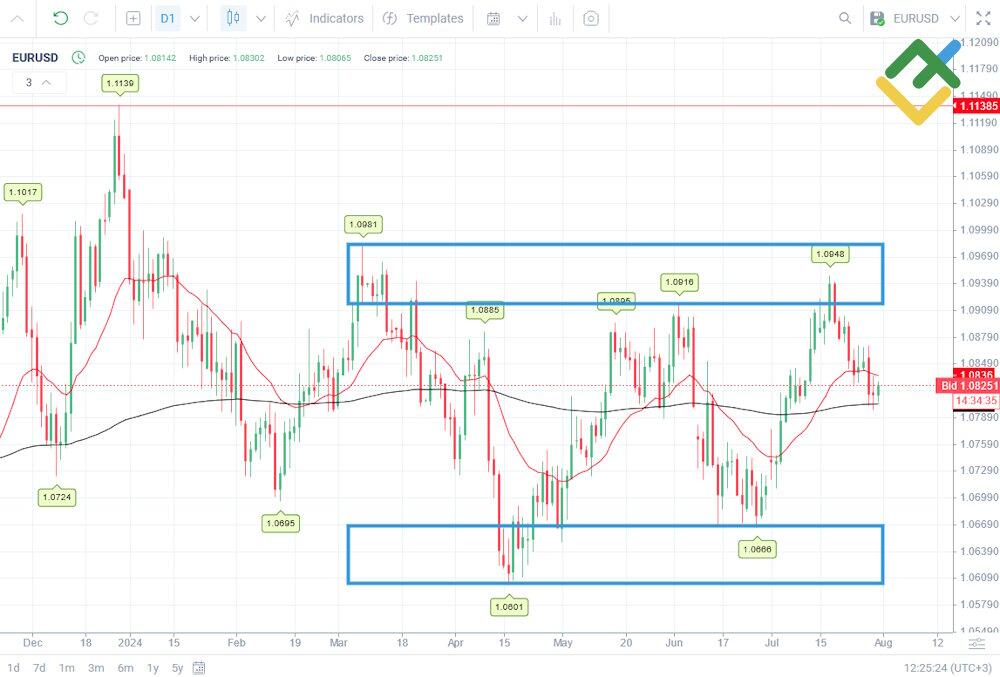
The daily chart shows that EURUSD has been trading flat since March 2024. The instrument cannot breach the channel’s upper boundary of 1.0985 and the lower one of 1.0603. For the next month, consider long trades at the upper boundary and short trades at the lower boundary of the flat.
Once the price breaches the upper boundary, the pair will form an uptrend and reach the December 2023 high near 1.1138. If the pair breaches the lower boundary from above, a downtrend will emerge, and the price will hit the October 2023 low of 1.0446.
The moving averages EMA21 and EMA190 do not show any distinct direction and indicate the absence of any trend at the moment, confirming the flat structure of the market.
Besides, the RSI also helps determine the current situation in the market.
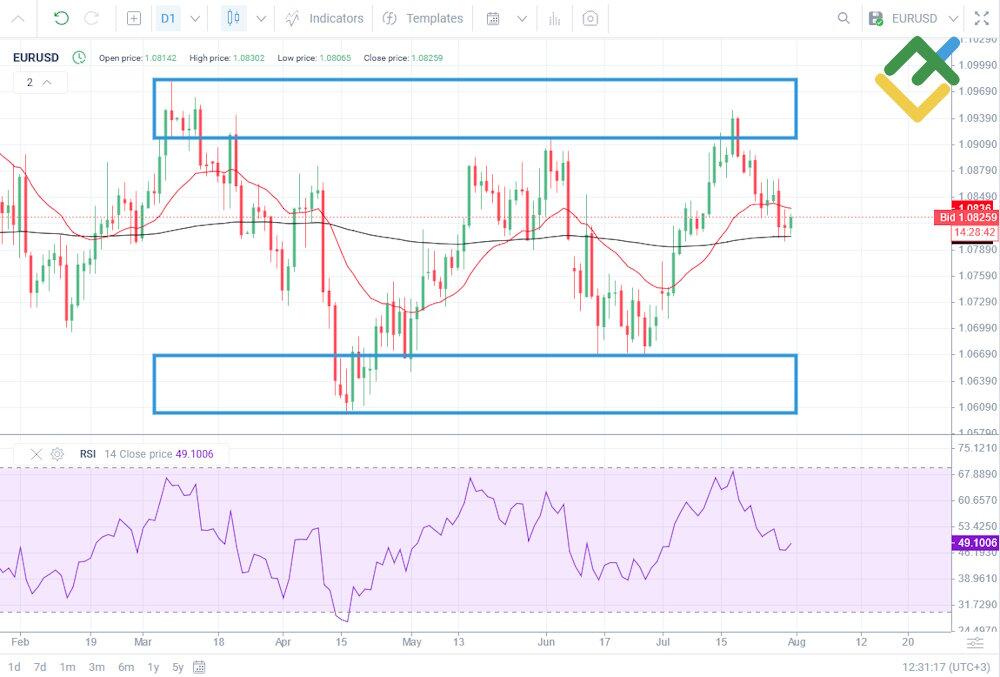
Once the indicator reached an overbought zone in mid-July, the EURUSD price declined. The bearish target is likely the lower boundary in the range of 1.0668–1.0603.
The RSI is in the neutral zone and does not indicate selling or buying opportunities.
If the lower boundary of the channel is reached, and the RSI enters the oversold zone, one may consider long trades. In this case, the bullish target will be the upper boundary in the range of 1.0983–1.0917.
Get access to a demo account on an easy-to-use Forex platform without registration
EURUSD Analysis For Next Three Months
Let’s use a daily chart with the Ichimoku indicator to forecast the EURUSD exchange rate for three months. This will allow you to identify various trends and potential pivot points.

Notably, the Ichimoku cloud changes its color frequently, which is typical for trading in a sideways trend. Thus, there is no general global trend at the moment.
The red Kijun line has no clear direction and is horizontal, meaning there is no medium-term trend. The blue Tenkan line is moving downward, indicating a short-term downtrend. The downtrend is confirmed by the fact that the price tested the trading channel’s upper boundary of 1.0983–1.0917 but failed to breach it and declined.
Therefore, the EURUSD pair will trade in a downtrend with a target at the lower boundary of 1.0668–1.0603 in the next three months. Consider short trades within the short-term downtrend at the Tenkan line, which equals 1.0850 as of writing this article. A stop-loss order should be placed above the Tenkan line, and a take-profit order should be set at the Kijun line. If the price breaches the Kijun line from above, one may consider short trades with the target in the Ichimoku cloud below the current price.
The downward scenario will be canceled if the asset breaks through and consolidates above the 1.0983 level. In this case, consider long trades with the target at the December 2023 high of 1.1138.
Long-Term EURUSD Technical Analysis for 2024
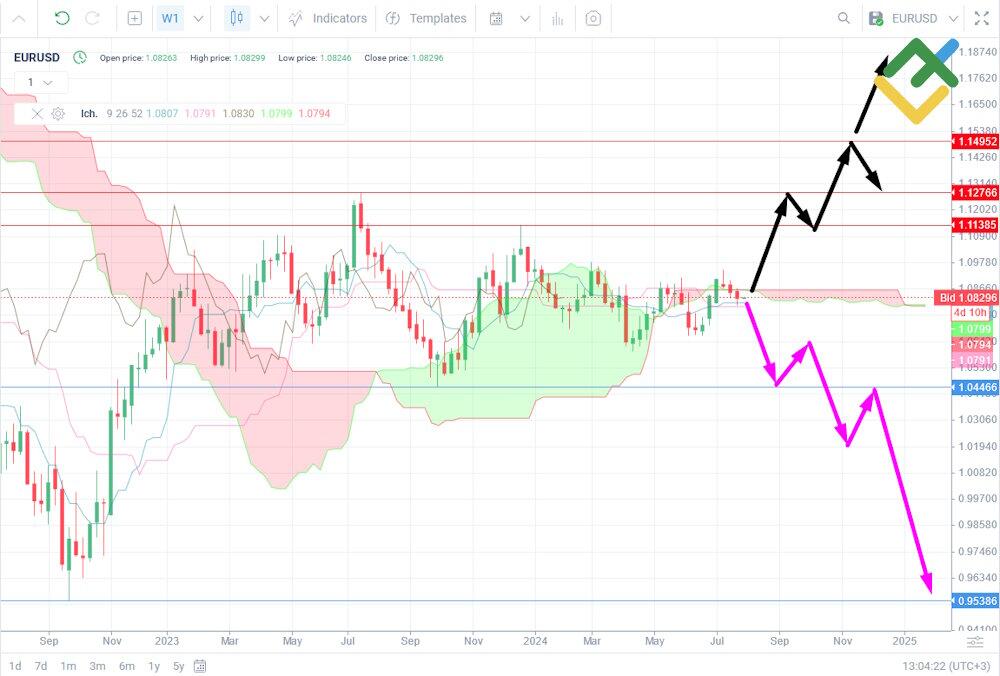
Let’s use the weekly time frame, mark key levels by significant highs and lows, and add the Ichimoku indicator to conduct long-term analysis.
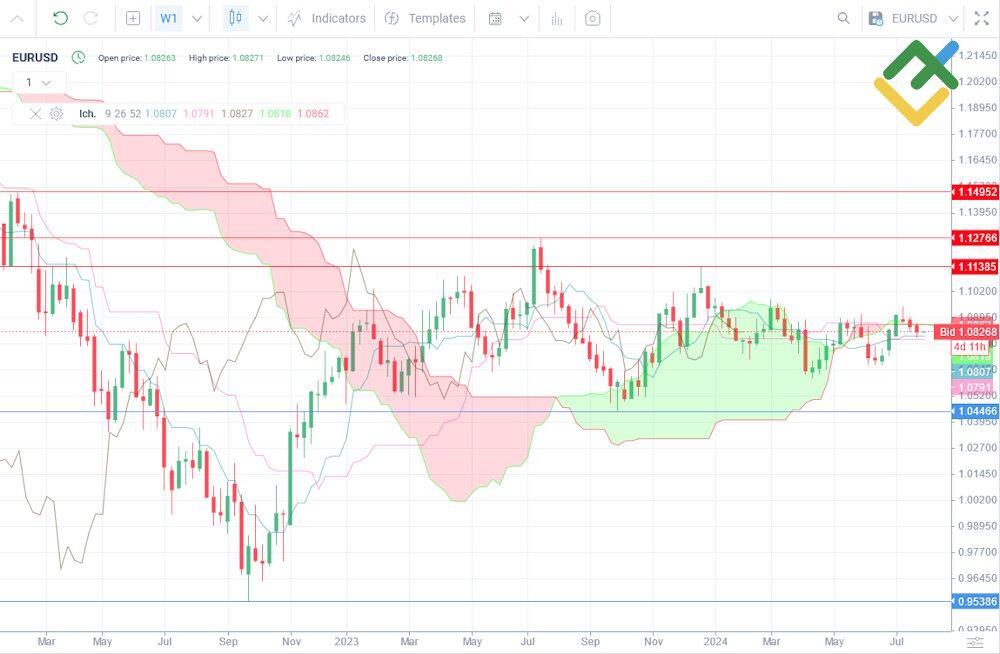
The chart shows that the EURUSD pair has been trading in a small range between 1.1276 and 1.0446 during 2023. At the moment, the prices correspond to the February 2023 prices. Consequently, there have been no significant changes in the EURUSD price over the last year, indicating the absence of a global trend.
The pair should break through the 2023 high of 1.1276 to form a new uptrend. In this case, the nearest bullish target will be the February 2022 high of 1.1495.
To form a new downtrend, the asset should break through the 2023 low of 1.0446. After that, one may consider short trades with the target at the 2022 low near 0.9538.
Let’s analyze the Ichimoku indicator readings.
Substantial price declines in 2021 and 2022 marked the global downtrend. The trend ended in April 2023, when the price breached the red cloud from below. After that, the indicator formed a green cloud, signaling bullish sentiment at the end of 2023.
At the moment, the cloud is turning red again. If the decrease continues, the red Ichimoku cloud will expand, confirming the new emerging downtrend. In this case, the quotes will likely fall and reach the 1.0446 level at the end of the year. If the price breaks through 1.0446, the asset may fall to 0.9538.
The Tenkan and Kijun lines have no direction, indicating the absence of short- and medium-term trends on the weekly chart. Therefore, it is reasonable to consider short trades as the global downtrend may emerge. As soon as the Tenkan and Kijun lines descend, consider short trades with smaller targets and shorter time intervals for holding positions.
If the price breaks through the 1.1138 level, a new global uptrend will unfold. In this case, consider long trades with targets of 1.1276 and 1.1495 for the end of 2024.
|
Month |
EURUSD Price Forecast |
|
|
Min, $ |
Max, $ |
|
|
August |
1.0670 |
1.0985 |
|
September |
1.0550 |
1.0680 |
|
October |
1.0445 |
1.0670 |
|
November |
1.0390 |
1.0580 |
|
December |
1.0160 |
1.0490 |
Long-Term Trading Plan for EURUSD
Let’s make a long-term trading plan for the EURUSD pair based on the conducted analysis:
-
The EURUSD pair will likely trade flat between 1.0983 and 1.0603 during the month. The asset will likely decline to the lower boundary of the range, as the price reached the upper boundary in July.
-
In the next three months, the price may hit the lower boundary of the 1.0668–1.0603 range. Consider short trades at the Tenkan line of the Ichimoku indicator. If a strong downward impulse occurs, the Kijun line reverses downward, short trades can be considered on a rebound from the line.
-
When the price breaks through one of the channel’s boundaries, a new long-term uptrend or downtrend will start. In case of an uptrend formation, the bullish target for 2024 will be the 1.1275 and 1.1495 levels. If a downtrend occurs, the main bearish target will be the 2022 low of 0.9538.
-
Currently, the EURUSD pair is trading in a sideways trend according to the daily and weekly charts, so you should trade cautiously and with small targets.
-
Once the future long-term trend is clearly outlined, trades with a longer holding period can be planned.
Long-term forecasts are indicative and may change due to external factors such as the US Federal Reserve rate, ECB rate, US presidential elections, and others. Traders should stick to money management and use stop-loss orders to avoid large losses.
EURUSD Rate Forecast for 2025 – Experts Predictions
Predictions for 2025 are mixed. Some analysts believe that the EURUSD pair will continue to trade in a sideways trend in 2025. Other experts anticipate growth of the quotes to 1.2500 in the fall.
Long Forecast
Price range in 2025: $1.0490 – $1.1290 (as of July 31, 2024).
According to Long Forecast, in 2025, the EURUSD pair will trade in approximately the same ranges as in 2024. The high is expected at 1.1290 and the low at 1.0490.
Experts believe the euro exchange rate has reached an equilibrium price near the current levels for several years. However, such forecasts do not take into account extraordinary events such as changes in political course and other force majeure circumstances.
|
Month |
Opening, $ |
Low–High, $ |
Closing, $ |
Change, % |
|
January |
1.088 |
1.071–1.103 |
1.087 |
1.2% |
|
February |
1.087 |
1.049–1.087 |
1.065 |
-0.8% |
|
March |
1.065 |
1.063–1.095 |
1.079 |
0.5% |
|
April |
1.079 |
1.079–1.128 |
1.111 |
3.4% |
|
May |
1.111 |
1.095–1.129 |
1.112 |
3.5% |
|
June |
1.112 |
1.068–1.112 |
1.084 |
0.9% |
|
July |
1.084 |
1.053–1.085 |
1.069 |
-0.5% |
|
August |
1.069 |
1.062–1.094 |
1.078 |
0.4% |
|
September |
1.078 |
1.078–1.117 |
1.100 |
2.4% |
|
October |
1.100 |
1.051–1.100 |
1.067 |
-0.7% |
|
November |
1.067 |
1.067–1.100 |
1.084 |
0.9% |
|
December |
1.084 |
1.084–1.128 |
1.111 |
3.4% |
PandaForecast
Price range in 2025: $1.0670 – $1.2783 (as of July 31, 2024).
Panda Forecast analysts predict that the EURUSD exchange rate will grow in 2025. At the beginning of the year, the price will reach 1.0998, and at the end of the year, the quotes will hit the 1.2109 level, implying a growth of 11.6% from the current prices. The asset will experience moderate volatility, typical for a steady upward trend in currency markets.
|
Month |
Average price, $ |
Minimum, $ |
Maximum, $ |
Volatility, % |
|
January |
1.0998 |
1.0670 |
1.1289 |
5.48% |
|
February |
1.1293 |
1.1151 |
1.1454 |
2.65% |
|
March |
1.1440 |
1.1272 |
1.1570 |
2.57% |
|
April |
1.1359 |
1.1120 |
1.1640 |
4.47% |
|
May |
1.1797 |
1.1634 |
1.2179 |
4.48% |
|
June |
1.1961 |
1.1815 |
1.2313 |
4.04% |
|
July |
1.1956 |
1.1635 |
1.2091 |
3.78% |
|
August |
1.2197 |
1.2069 |
1.2340 |
2.20% |
|
September |
1.2509 |
1.2184 |
1.2783 |
4.69% |
|
October |
1.2341 |
1.2108 |
1.2471 |
2.91% |
|
November |
1.2253 |
1.1965 |
1.2366 |
3.25% |
|
December |
1.2109 |
1.1931 |
1.2323 |
3.18% |
Long-term EURUSD Predictions 2026–2027
The EURUSD forecasts for 2026–2027 differ drastically. Some experts believe that the pair will decline and reach the 0.9960 level by the end of 2027. Other forecasts assume active price growth and closing near the 1.3862 level in 2027. Long-term forecasting is the least accurate as market conditions change constantly. You should be cautious about these predictions and make your own trading decisions.
Long Forecast
Long Forecast offers a pessimistic prediction for the EURUSD pair. The euro will gradually decline from 1.1110 in January 2026 to 0.9960 at the end of 2027. The asset may experience increased volatility, with potential monthly price fluctuations of 10%–11%.
|
Month |
Opening, $ |
Low–High, $ |
Closing, $ |
Change,% |
|
2026 |
||||
|
January |
1.111 |
1.066–1.111 |
1.082 |
0.7% |
|
February |
1.082 |
1.081–1.113 |
1.097 |
2.1% |
|
March |
1.097 |
1.097–1.145 |
1.128 |
5.0% |
|
April |
1.128 |
1.128–1.179 |
1.162 |
8.2% |
|
May |
1.162 |
1.154–1.190 |
1.172 |
9.1% |
|
June |
1.172 |
1.125–1.172 |
1.142 |
6.3% |
|
July |
1.142 |
1.106–1.142 |
1.123 |
4.6% |
|
August |
1.123 |
1.079–1.123 |
1.095 |
2.0% |
|
September |
1.095 |
1.053–1.095 |
1.069 |
-0.5% |
|
October |
1.069 |
1.069–1.104 |
1.088 |
1.3% |
|
November |
1.088 |
1.039–1.088 |
1.055 |
-1.8% |
|
December |
1.055 |
1.025–1.057 |
1.041 |
-3.1% |
|
2027 |
||||
|
January |
1.041 |
1.024–1.056 |
1.040 |
-3.2% |
|
February |
1.040 |
1.012–1.042 |
1.027 |
-4.4% |
|
March |
1.027 |
1.017–1.047 |
1.032 |
-3.9% |
|
April |
1.032 |
0.995–1.032 |
1.010 |
-6.0% |
|
May |
1.010 |
0.993–1.023 |
1.008 |
-6.1% |
|
June |
1.008 |
0.974–1.008 |
0.989 |
-7.9% |
|
July |
0.989 |
0.969–0.999 |
0.984 |
-8.4% |
|
August |
0.984 |
0.970–1.000 |
0.985 |
-8.3% |
|
September |
0.985 |
0.941–0.985 |
0.955 |
-11.1% |
|
October |
0.955 |
0.955–0.987 |
0.972 |
-9.5% |
|
November |
0.972 |
0.972–1.011 |
0.996 |
-7.3% |
|
December |
0.996 |
0.952–0.996 |
0.967 |
-10.0% |
PandaForecast
According to PandaForecast, the EURUSD pair will rise from 2026 to 2027. The 2027 is expected to open at 1.2826 and close near 1.3862, representing a 27.9% surge from the current prices. The price will experience moderate volatility, with monthly fluctuations not exceeding 6%. Below is the table with forecasted values for 2027.
|
Month |
Average price, $ |
Minimum, $ |
Maximum, $ |
Volatility,% |
|
January |
1.2826 |
1.2632 |
1.2934 |
2.33% |
|
February |
1.2681 |
1.2356 |
1.3069 |
5.46% |
|
March |
1.3202 |
1.3086 |
1.3441 |
2.64% |
|
April |
1.3280 |
1.2901 |
1.3632 |
5.36% |
|
May |
1.3291 |
1.2923 |
1.3598 |
4.97% |
|
June |
1.3079 |
1.2706 |
1.3282 |
4.34% |
|
July |
1.3508 |
1.3076 |
1.3905 |
5.96% |
|
August |
1.3462 |
1.3129 |
1.3762 |
4.60% |
|
September |
1.3553 |
1.3302 |
1.3803 |
3.63% |
|
October |
1.3735 |
1.3360 |
1.4029 |
4.77% |
|
November |
1.3879 |
1.3675 |
1.4217 |
3.81% |
|
December |
1.3862 |
1.3710 |
1.4071 |
2.56% |
Factors That Can Affect the EURUSD rate
The EURUSD exchange rate is the ratio of the EU and US currencies, the two largest economies in the world. Therefore, significant economic and political news from the EU and the US directly affect the EURUSD exchange rate. These factors of influence are called fundamental. Additionally, there are technical factors. Let’s examine both types in more detail.
Fundamental Factors
There are several important economic indicators for the US and EU. The most significant factors affecting the price of the pair include the following:
-
The ECB’s and the Fed’s interest rate changes, GDP growth rates, and Inflation indexes (CPI, PPI);
-
Unemployment rate, US job data, nonfarm payroll employment;
-
Industrial production (industrial production index);
-
Retail sales, balance of trade, consumer confidence index, indexes of business sentiment (ISM, IFO);
-
Speeches by top officials: press conferences with the ECB and Fed heads, and speeches and commentaries from leading EU and US politicians;
-
Political events: various government reshuffles, elections, public unrest, internal political instability (e.g., Brexit);
-
Force majeure: emergencies, natural disasters, man-made disasters, terrorist attacks, epidemics.
Technical Factors
The most significant technical factors influencing the EURUSD rate are the following:
-
Current trend is an essential technical factor. In an uptrend, purchases are preferable; in a downtrend, sales are recommended. In a sideways trend (range), trading in both directions from the boundaries of the price range is appropriate.
-
Historical highs and lows, as well as significant support and resistance levels on the price chart, are the key markers for analyzing and forecasting the future movement of the EURUSD pair.
-
Various continuation or reversal patterns from classical technical analysis, candlestick patterns, and Price Action patterns.
The EURUSD Pair History
The euro was introduced in 1999 to replace the national currencies of EU countries, such as the German mark, the French franc, and the Italian lira. Therefore, the euro is affected by macroeconomic statistics of the eurozone and individual EU countries’ performance.
The euro officially entered non-cash circulation on January 1, 1999, and banknotes and coins were brought into use on January 1, 2002. In terms of international settlements, only the US dollar surpasses the European monetary unit, making it the second most popular world reserve currency. When trading started, the exchange rate stood at 1.1800. The pair’s ticker on the currency market is EURUSD.
Since 1999, the EURUSD pair has undergone significant changes. In the first two years, the euro prospects were vague, as the exchange rate fell to the lowest value of 0.8200. After that, it increased over seven years to a record high of 1.6039 in 2008. In the following years, the pair corrected significantly due to the banking crisis and various problems in the eurozone. The asset traded in a bearish trend until April 2015, when it began to recover.
In terms of market sentiment, 2020 was a very representative year. When the first wave of the coronavirus hit in March, the market reacted strongly to the pandemic’s scale and impact. As a result, investors switched to the US dollar as a protective asset, leading to its strengthening. However, the situation changed when Pfizer announced promising vaccine news in early November. Consequently, the need for a safe asset diminished, causing the US dollar to depreciate.
In both cases, the market reaction was obvious, but this is not always the case. When the European Central Bank announced financial support packages in 2022 to combat the effects of the coronavirus, the market reacted positively. Investors believed that the ECB’s efforts to prevent business collapses and job losses were substantial, resulting in a strengthening of the euro.
The EURUSD’s growth in October 2022 was driven by a number of economic and political factors that affected the US dollar and the euro. The Fed has been aggressively raising interest rates in 2022 in an attempt to curb inflation. However, in the fall of 2022, the market began to expect the pace of rate hikes to slow for the first time as there were signs that inflation might be slowing. These expectations weakened the US dollar as investors suggested that the Fed may end the rate hike cycle sooner than previously anticipated.
Some US macroeconomic data released in 2022 were weaker than expected. For example, employment and GDP data indicated a slowdown in economic growth. This weakened confidence in the US dollar and led to its depreciation against the euro.
The ECB also began raising interest rates to combat high inflation in the eurozone. In 2022, the ECB implemented a series of measures that strengthened the euro. Expectations of further rate hikes in Europe supported the euro’s growth against the US dollar.
Equity and other risk asset markets witnessed moderate optimism in 2022. The improvement in market sentiment has contributed to increased demand for riskier assets such as the euro and reduced demand for safe havens such as the US dollar.
The ECB’s economic measures aimed at supporting the economy and curbing inflation strengthened the single European currency. This appreciation continued until mid-2023, when the asset reached a high of 1.1255.
Despite investors’ hope that the Fed’s interest rate hike cycle would end as early as 2022, the first half of 2023 saw a rate hike to 5.50%. Higher interest rates make the US dollar more attractive to investors as they can get higher yields on their investments in US assets. This led to a strengthened US dollar and, consequently, a decrease in the euro price in the summer of 2023.
The economic performance in the eurozone in 2023 fell short of expectations. Sluggish economic growth, poor inflation control, and low rates of manufacturing activity led to a decline in investor confidence in the euro. For example, declining industrial production and slowing GDP growth indicated weakness in the eurozone economy.
The US economy demonstrated more robust growth compared to the eurozone economy. Strong US macroeconomic indicators, such as high employment and consumption growth, supported the US dollar while the eurozone struggled. This difference in economic outlook contributed to the depreciation of the euro against the US dollar.
Nevertheless, in 2023, the euro exchange rate did not weaken much but went into a downward correction, reaching 1.0460.
The first half of 2024 was marked by low EURUSD volatility. On the one hand, the euro was supported by the measures taken earlier by the ECB and the government to boost the economy. On the other hand, the US economy continued to show solid growth. US GDP for Q2 amounted to 2.8% (preliminary data). The Fed interest rate remained high, attracting investments in the US dollar.
These events led to the formation of a sideways trend in which the asset is still trading. New economic data, as well as the US presidential election in November 2024, will likely determine the direction of the EURUSD pair in the long term.
Looking back, it is clear that the movement of the EURUSD pair follows specific patterns. It is important for investors to be able to recognize trends in the main economic indicators of the eurozone and the United States and to understand the impact of interest rates and the actions of central banks. This will help to identify the long-term direction of the asset movement, which can be followed when trading in financial markets.
Is EURUSD Still a Good Investment?
At the moment, investors should avoid opening long-term positions on the EURUSD pair, as the asset is trading in a flat with the boundaries of 1.0976–1.0613, a rather narrow range for this instrument. Therefore, traders can open short-term positions near the channel’s boundaries and close them at the opposite one.
The release of fresh data on the US and Eurozone economies is required to end sideways movement and form a new long-term trend, allowing traders to invest in the EURUSD pair. In September 2024, investors expect the US Federal Reserve to cut the interest rate by 25 bp. If so, investors will have to watch the market’s response. If the reaction is clear, a new trend will form, showing if investing in the EURUSD pair could be profitable.
Additionally, the 60th US presidential election is expected to take place in the fall. The recent withdrawal of incumbent President Joe Biden from the presidential race has brought uncertainty to the markets. The US Democratic Party has already presented its new candidate, and the vote itself should be held in November. Its result will have a direct impact on the US dollar exchange rate and, as a consequence, on the EURUSD pair.
Before trading with this asset in the live market, you should choose a suitable trading method and practice it on your demo account.
EURUSD Price Prediction FAQ
The current EURUSD exchange rate as of 23.08.2024 is 1.11757
Currently, the EURUSD pair is trading in a range between 1.0981 and 1.0601. The pair has been trading in this range since January 2024, indicating the absence of any trend.
The EURUSD exchange rate depends on various factors, such as the state of the EU and US economies, the Fed and ECB interest rates, the political environment, and geopolitical risks. Historically, the pair declines if the EU economy experiences slow growth and high inflation.
At the moment, the euro is valued higher than the US dollar, but in 2022, the pair broke through the parity level and fell to 0.9536. The overall trend for the pair is downward, so similar events may cause the European currency to depreciate further in the future.
Forecasts for the EURUSD exchange rate vary greatly and depend on the US Fed’s future interest rate, as well as the US presidential election in 2024. At the moment, it is impossible to provide an accurate forecast for this asset.
Long Forecast experts predict, in 2025, the EURUSD price will trade in approximately the same ranges of 1.0490–1.1290 as in 2024. Panda Forecast analysts assume that the EURUSD rate will rise in 2025 and reach the 1.2109 level at the end of the year.
It is not a good time to purchase the EURUSD pair. Analysts suggest waiting for the fall and the results of the US presidential election, after which a stable trend for several years ahead can be formed, allowing to make balanced investment decisions.
Experts’ opinions on the future EURUSD trend differ dramatically. Some analysts expect the exchange rate to fall below 1.0000 again, while others believe the price will rise to 1.3862. If the global downtrend that started in 2021 continues, the pair will likely decline.
The EURUSD exchange rate is the ratio between the currencies of the European Union and the United States of America, the two largest economies in the world. Thus, significant economic and political news from the EU and the US directly affect the EURUSD exchange rate. Both fundamental and technical factors influence the EURUSD pair.
Price chart of EURUSD in real time mode

The content of this article reflects the author’s opinion and does not necessarily reflect the official position of LiteFinance. The material published on this page is provided for informational purposes only and should not be considered as the provision of investment advice for the purposes of Directive 2004/39/EC.
{{value}} ( {{count}} {{title}} )
This post is originally published on LITEFINANCE.


