
I welcome my fellow traders! I have made a price forecast for the USCrude, XAUUSD, and EURUSD using a combination of margin zones methodology and technical analysis. Based on the market analysis, I suggest entry signals for intraday traders.
The euro is trading in a short-term uptrend.
The article covers the following subjects:
Highlights and key points
-
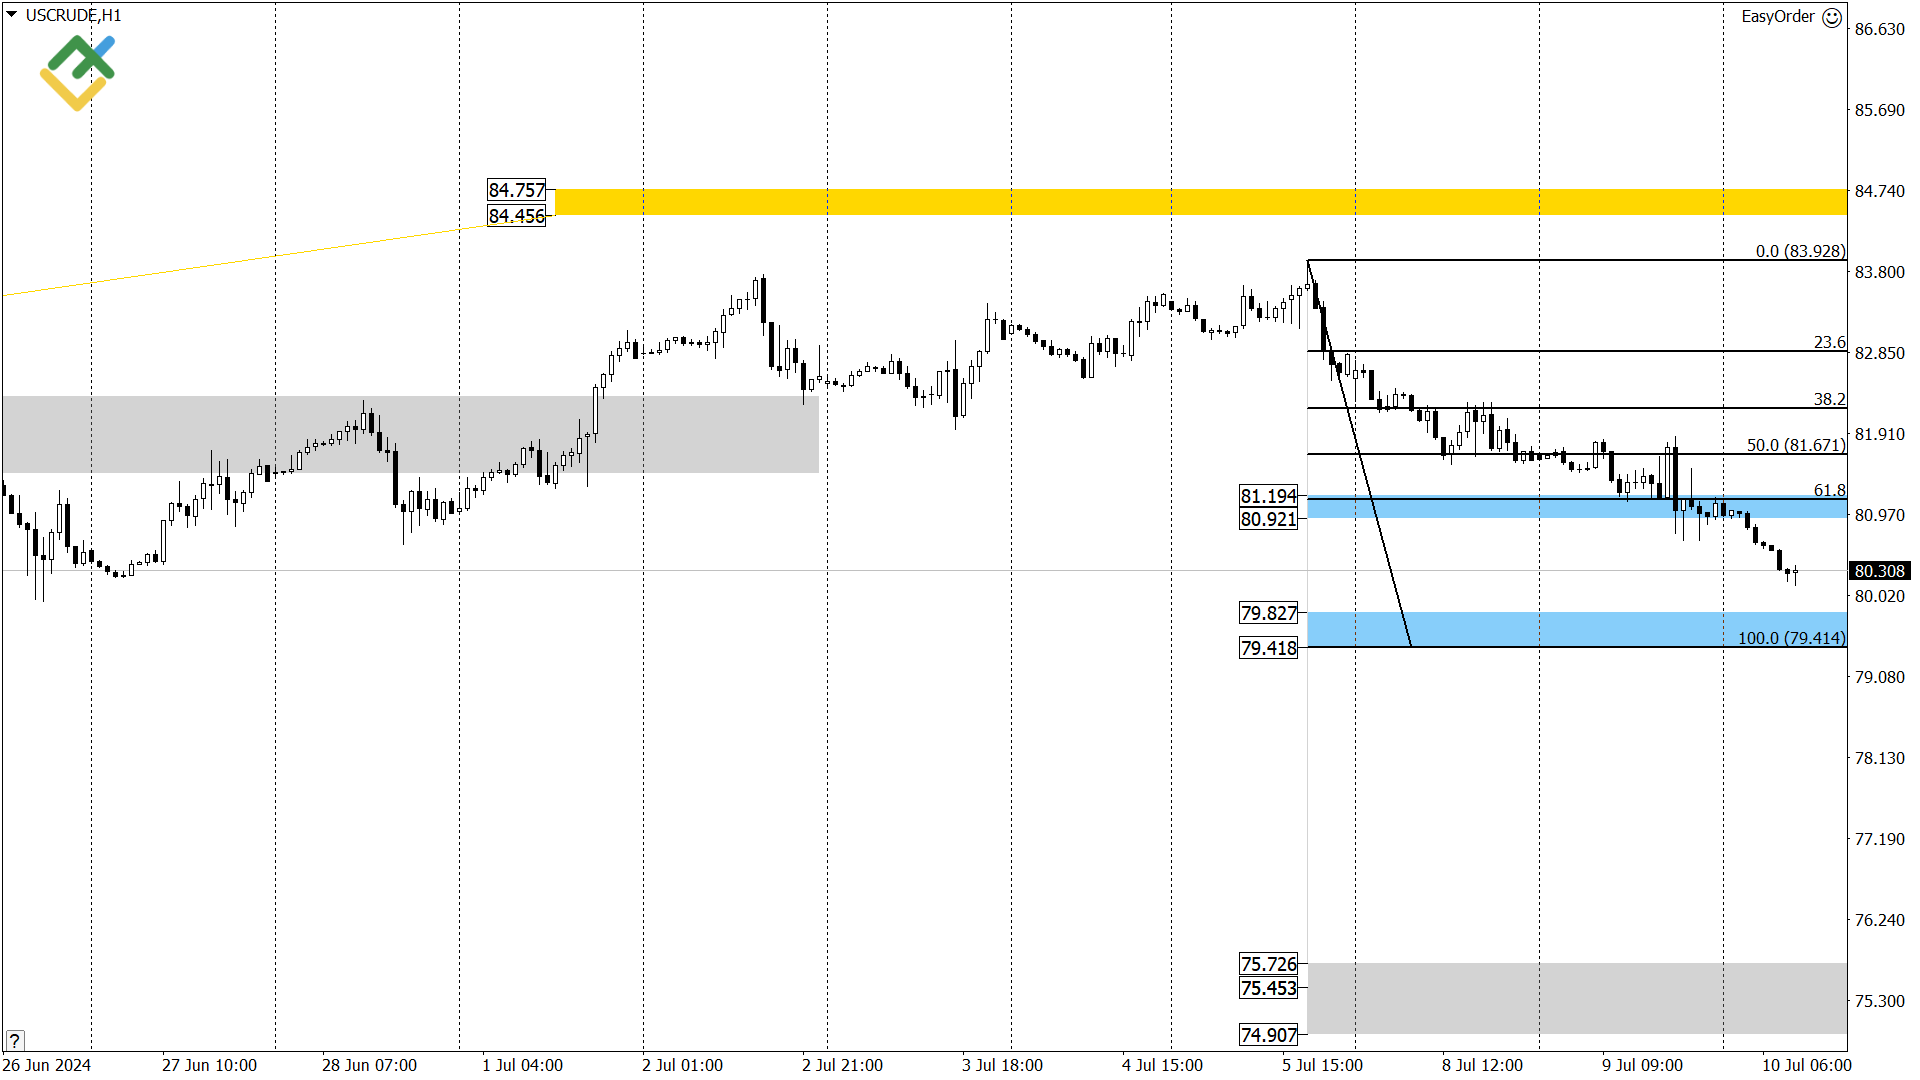
USCrude: Oil is trading in a correction with the target near 79.82 – 79.41. After the price tests this area, consider long trades with the first target at 81.67.
-
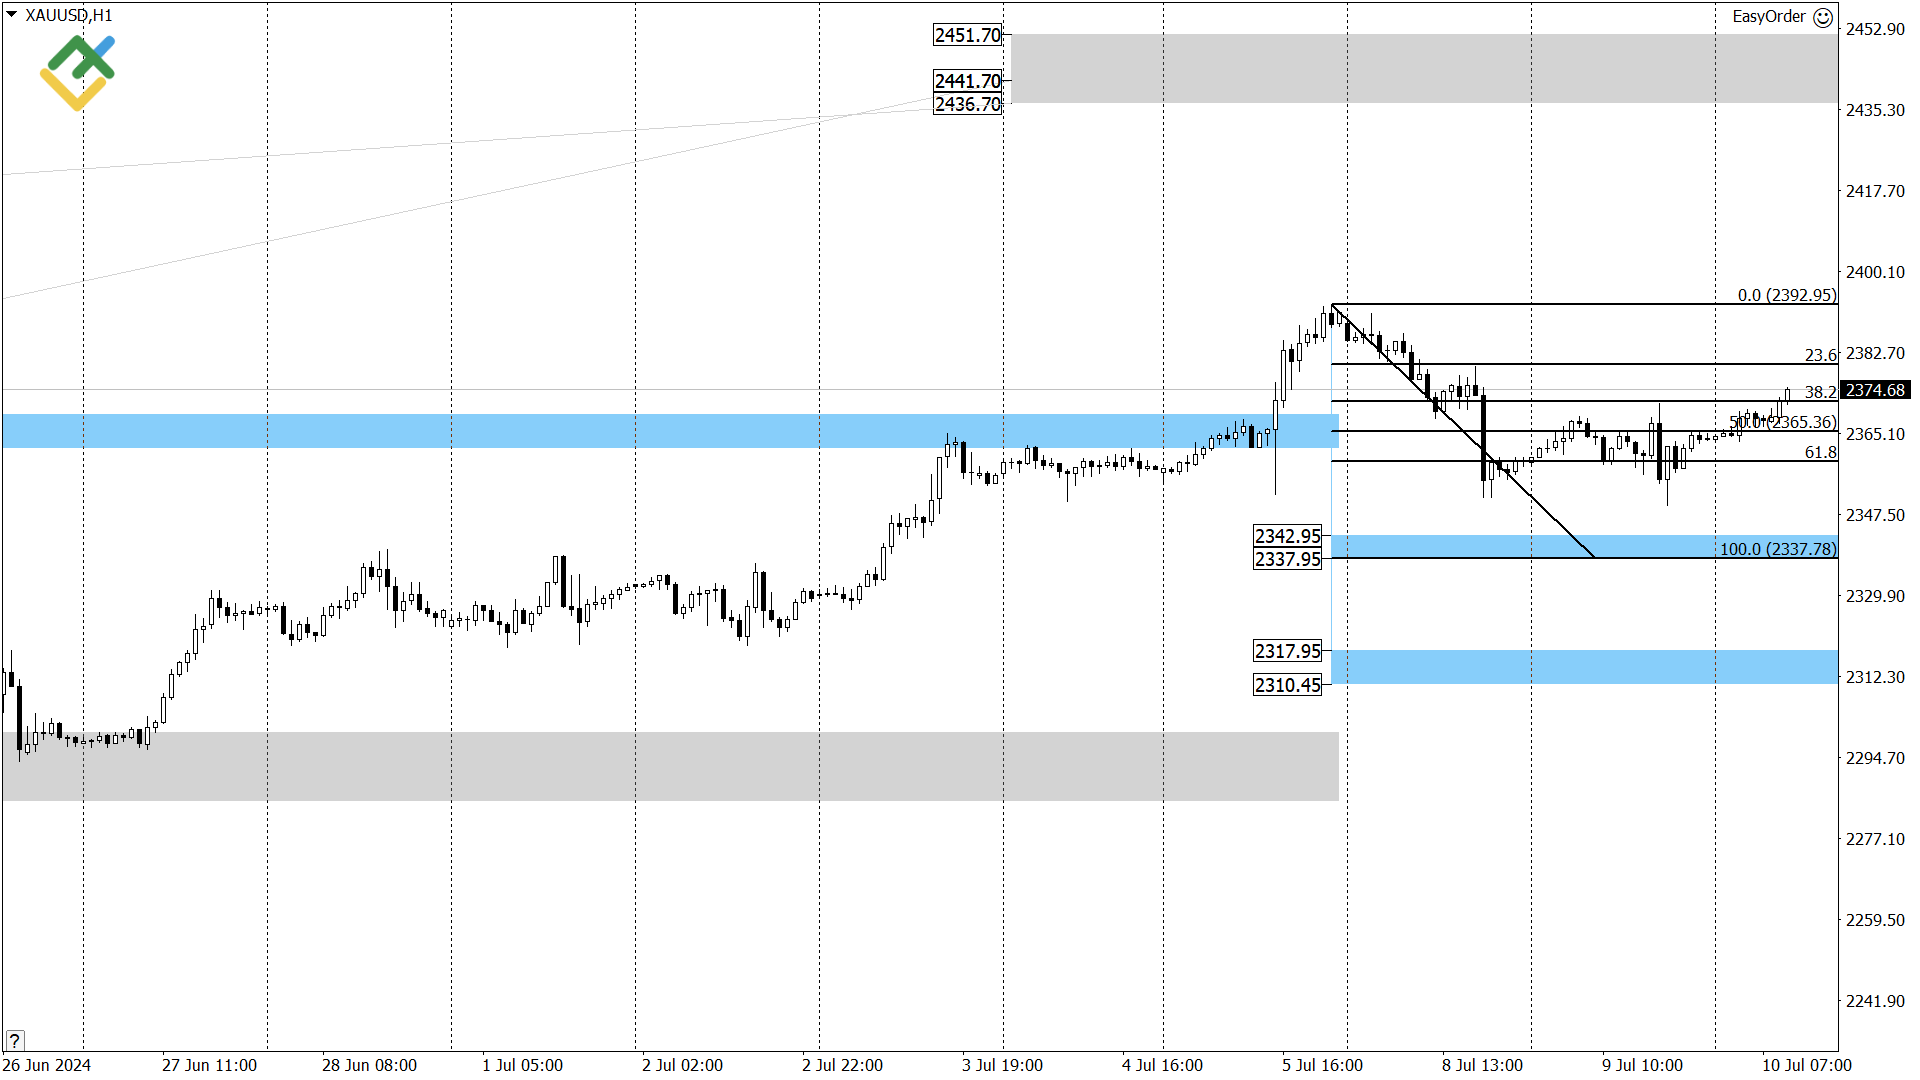
XAUUSD: Gold is trading in a correction. If the price tests the support (A) during the correction, consider long trades with the first target at 2365.
-
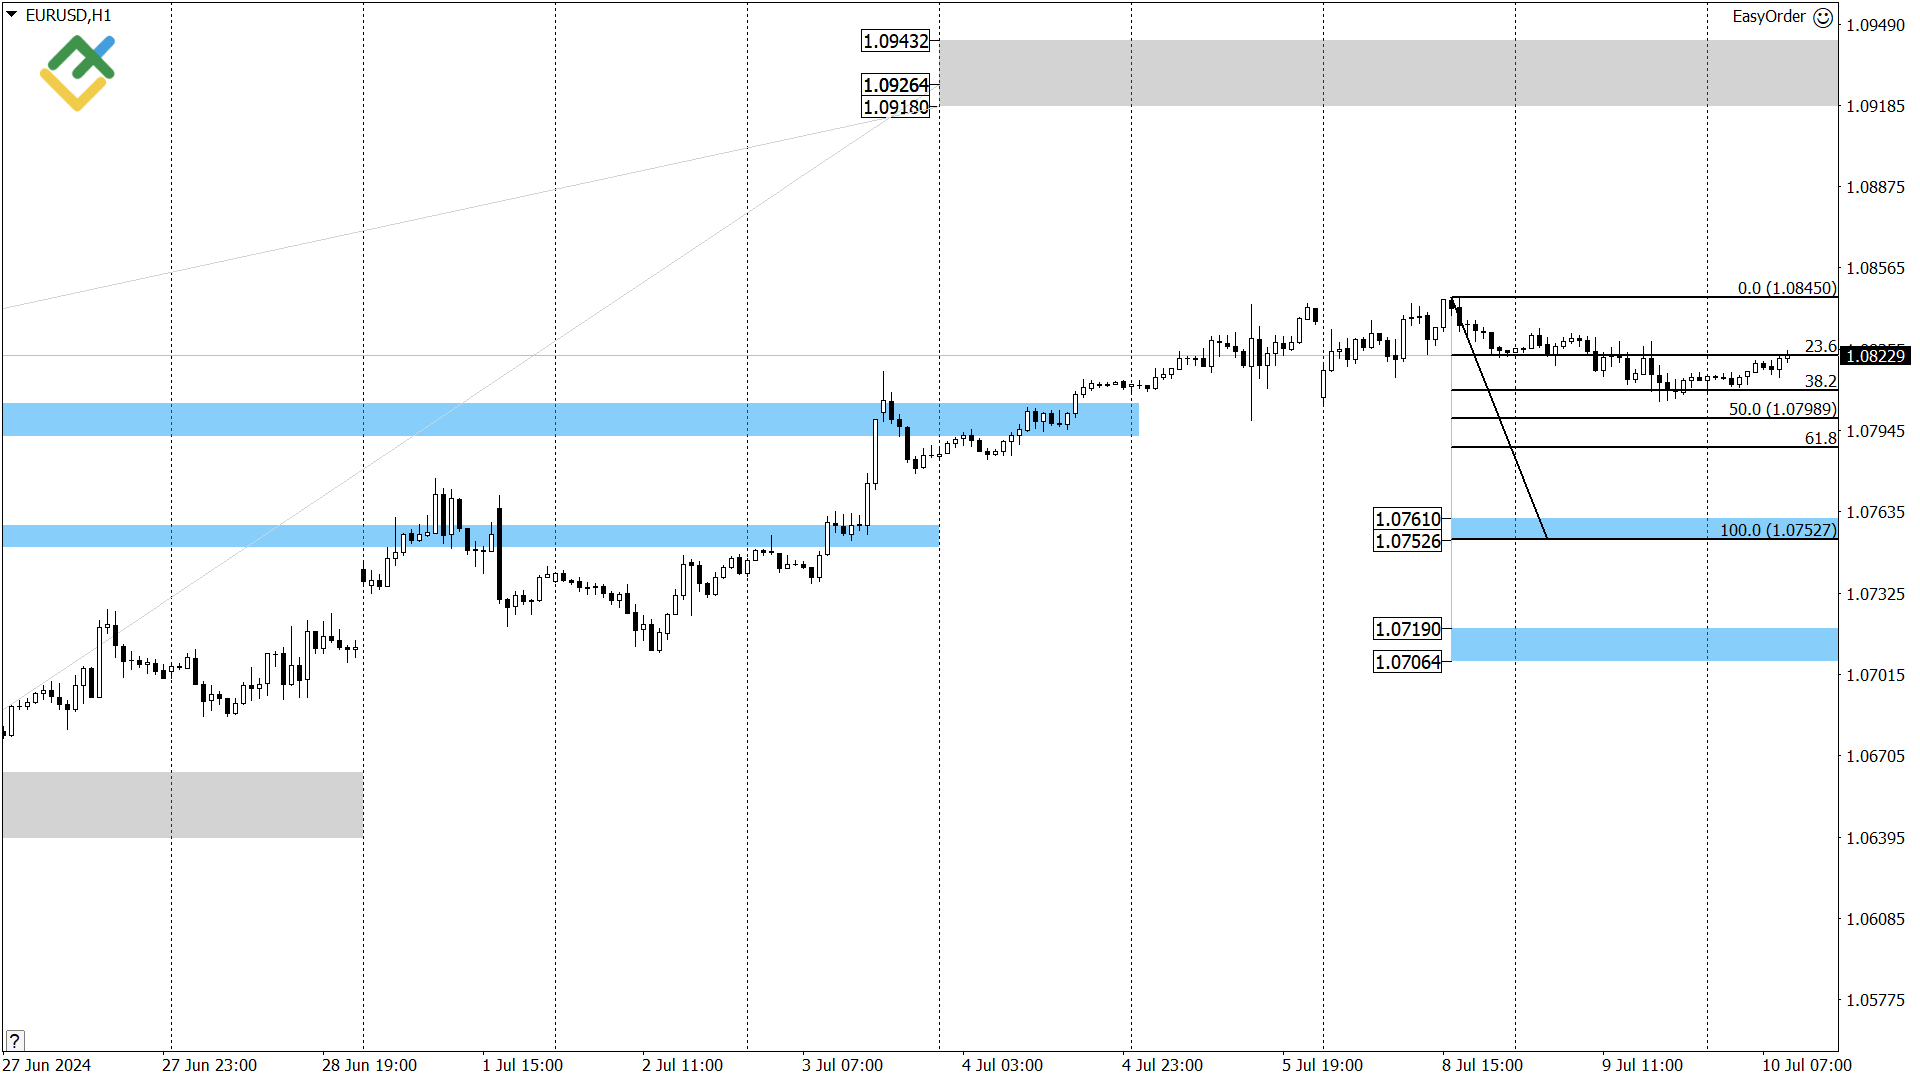
EURUSD: The euro is trading in a correction. Once the asset tests the support (A) during the correction, consider long trades with the target at 1.0799.
Oil price forecast for today: USCrude analysis
Oil is trading in a downward correction and falling to the short-term uptrend boundary of 79.82 – 79.41. After the price tests this area, consider long trades according to the pattern, with the first target near 81.67 and the second one near 83.92.
The asset should break through the 79.41 level to allow traders to open short trades. If successful, the short-term uptrend will reverse. After that, consider short trades with the target at the lower Target Zone 75.72 – 74.90.
USCrude trading ideas for today:
Buy according to the pattern at support (B) 79.82 – 79.41. TakeProfit: 81.67, 83.92. StopLoss: according to the pattern rules.
Gold forecast for today: XAUUSD analysis
Gold maintains a short-term uptrend. After a small correction, the price is rising with the target at the July 5 high. If the price consolidates above this level, the next bullish target will be the upper Target Zone 2451 – 2436.
Consider long trades at the strong support (A) 2342 – 2337 or support (B) 2317 – 2310. The first target may be the 2365 level.
XAUUSD trading ideas for today:
-
Buy according to the pattern at support (A) 2342 – 2337. TakeProfit: 2365, 2392. StopLoss: according to the pattern rules.
-
Buy according to the pattern at support (B) 2317 – 2310. TakeProfit: 2392. StopLoss: according to the pattern rules.
Euro/Dollar forecast for today: EURUSD analysis
The euro is trading in a short-term uptrend. The bullish target is the upper Target Zone 1.0943 – 1.0918. Consider long trades on a correction at the strong support (A) 1.0761 – 1.0752 and support (B) 1.0719 – 1.0706. Traders should wait for the unfolding of a reversal pattern to open long positions. The first bullish target will be the 1.0799 level.
The asset should breach and consolidate above the 1.0706 level to allow traders to sell the instrument. In this case, the short-term uptrend will reverse.
EURUSD trading ideas for today:
-
Buy according to the pattern at support (A) 1.0761 – 1.0752. TakeProfit: 1.0799, 1.0844. StopLoss: according to the pattern rules.
-
Buy according to the pattern at support (B) 1.0719 – 1.0706. TakeProfit: 1.0844. StopLoss: according to the pattern rules.
P.S. Did you like my article? Share it in social networks: it will be the best “thank you” 
Ask me questions and comment below. I’ll be glad to answer your questions and give necessary explanations.
Useful links:
- I recommend trying to trade with a reliable broker here. The system allows you to trade by yourself or copy successful traders from all across the globe.
- Use my promo code BLOG for getting deposit bonus 50% on LiteFinance platform. Just enter this code in the appropriate field while depositing your trading account.
- Telegram chat for traders: https://t.me/litefinancebrokerchat. We are sharing the signals and trading experience.
- Telegram channel with high-quality analytics, Forex reviews, training articles, and other useful things for traders https://t.me/litefinance
Price chart of EURUSD in real time mode

The content of this article reflects the author’s opinion and does not necessarily reflect the official position of LiteFinance. The material published on this page is provided for informational purposes only and should not be considered as the provision of investment advice for the purposes of Directive 2004/39/EC.
{{value}} ( {{count}} {{title}} )
This post is originally published on LITEFINANCE.