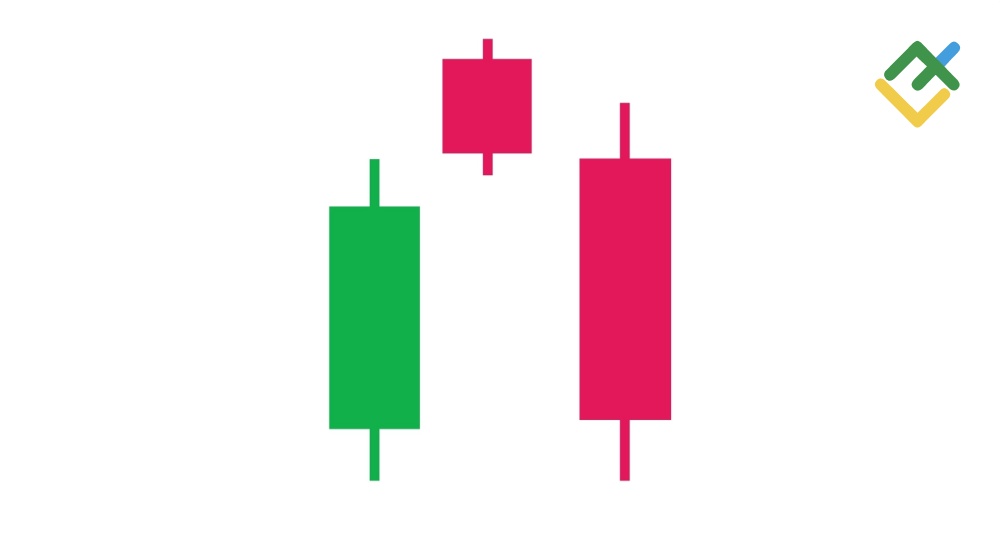
The Evening star pattern is the opposite of the Morning star candlestick pattern. The Japanese “Evening star” pattern signals that a bullish market cycle nears its end, and an uptrend will reverse.
When trading in financial markets, you must have seen a combination of three candlesticks at local or new price maximums: a long bullish candle, a small red or green candle, and a large red candle. That’s the Evening Star candlestick pattern.
Have you ever wondered why a trading asset’s price reverses and starts falling once the Evening Star pattern has formed? What was happening in the market at that moment? What does the pattern signal to traders and investors?
The Japanese candlestick pattern conveys lots of important information that you should consider while trading. This article will examine what the evening star candlestick pattern indicates in the price chart.
The article covers the following subjects:
Key takeaways
|
Main questions |
Conclusions and key takeaways |
|
What is the Evening Star pattern? |
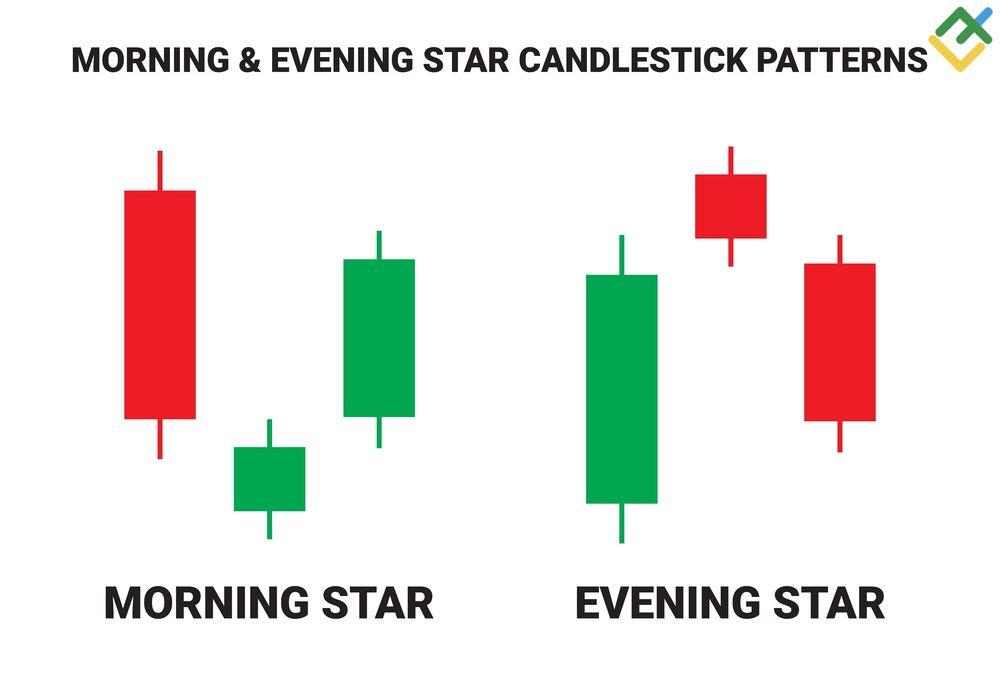
An Evening Star is a Japanese technical analysis candlestick pattern made of three candles: the first long bull candle, the second short-body candle (bearish or bullish), and the third long bearish candle. |
|
How does this pattern affect the market? |
The pattern forms at the end of an uptrend on the top, signaling a bearish reversal. The Evening Star pattern has a negative impact on the market as it leads to an increase in sales. |
|
How do you trade the Evening Star pattern? |
Trading the Evening Star pattern suggests going short once the pattern has formed on the top. Before taking a short position, it’s important to have additional confirmations using technical indicators and other candlestick analysis patterns. |
|
How to identify the pattern in the price chart? |
The pattern usually forms on a local top or a new all-time high of a trading asset’s price. An evening star is an eye-catching combination of three candles that is easy to identify in the price chart, even for a beginner trader. |
|
The key features of the Evening Star candlestick pattern |
The features of the evening star candlestick pattern include the following:
|
|
Why does the pattern form in a chart? |
This chart pattern warns market participants of the buyer’s weakening potential and the seller’s growing pressure. Practically, this pattern shows an increase in market supply amid weakening demand. This, in turn, allows traders and investors to profit from the decline. Other reasons for the pattern’s formation include negative fundamental factors that affect an asset’s price. |
|
How do I use this pattern in trading? |
Various strategies are suitable for trading the evening star pattern, including scalping, day trading, and swing trading. Once the pattern has formed, you must ensure that quotes will likely decline, open a short position in the instrument, and set a stop loss and a take profit. |
|
Advantages and disadvantages of the Evening Star pattern. |
An Evening Star can be easily identified on a chart. This bearish reversal pattern allows you to calculate potential downward reversal levels early. Moreover, in contrast to the Shooting Star pattern, which signals short-term corrections, the Evening Star pattern mainly indicates a forthcoming trend reversal to the downside. At the same time, the pattern can produce false signals on smaller time frames, leading to potential losses. Also, an evening star requires additional confirmation from other analytical instruments, so a short position may be opened at a less attractive price. |
|
On what time frames is this candlestick pattern formed? |
The evening star pattern can be found on all possible time frames featured on the trading platform, from M1 to the monthly chart. But it’s best used on M30-H1 time frames and older. |
|
Stop loss levels for the evening star pattern |
The evening star pattern forms on the top, indicating a strong resistance level. So, a stop loss must be placed above the “star” and above the resistance level. |
What Is an Evening Star?
An evening star is a candlestick analysis pattern consisting of three bars, signaling a change from an uptrend to a downtrend. As a rule, this candlestick pattern forms on local or new all-time price highs following a long bullish trend.
The emergence of the evening star indicates buyers’ rapid weakening and shows a shortage of long positions in an asset. When the third bearish candle forms, market supply begins to engulf the weakening demand. This leads to an acute decline in prices and a series of liquidations by speculators, which fuel a further decline in quotes.
The appearance of this pattern on an asset’s chart allows traders and investors to capitalize on a decline by opening short positions in derivatives or short selling in the stock market.
The evening star candlestick pattern can most often be found in the following financial markets:
-
Forex;
-
stock market;
-
cryptocurrency market;
-
commodities
Therefore, the pattern is used on various time frames and can be applied in many trading strategies, from scalping to long-term trading.
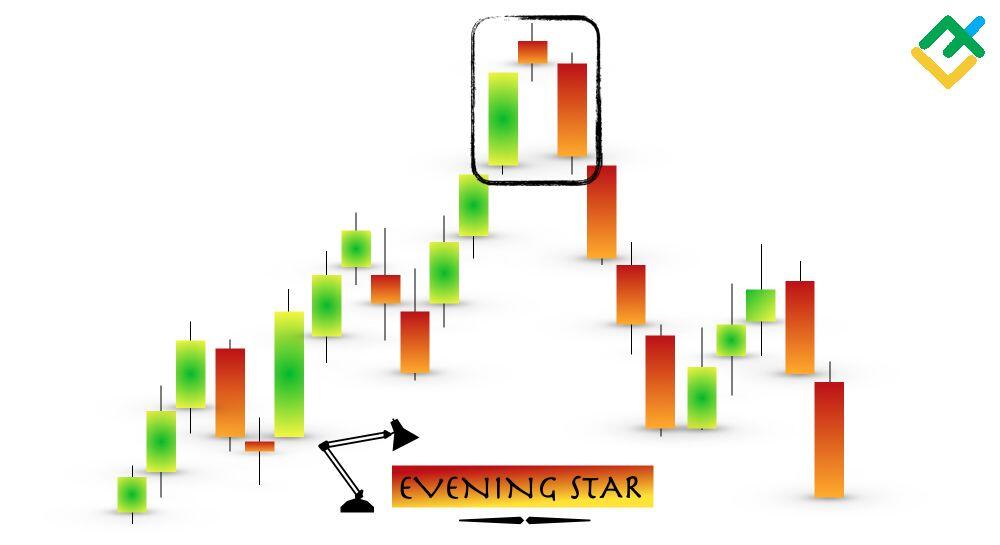
Evening Star Pattern Formation
The Evening star pattern forms in three stages:
-
First, a large bullish candle forms, indicating that the asset is under the buyer’s control and that a bullish rally is expected to continue.
-
The next candle opens with a small gap up, but the activity sharply falls throughout the whole period. That means the second candle has a small body, forming as a shooting star or a hanging man. Sometimes, the second candle can have no body and close as a doji. That strengthens a signal for a market reversal amid bullish indecision and rising bearish pressure.
-
A third candle also opens with a small gap down, but not always. There’s usually no gap, but its appearance strengthens a bearish reversal signal. The third candle is a large bearish candle, pointing out that the market is ready to decline. Sellers take control over the price and start actively selling. An important condition is that the third candle must be at least half the first. If it completely engulfs the first candle, a sharp decline can be expected, with other large bearish candles forming.
It’s worth noting that the Evening Star candlestick pattern can also be formed during consolidation near a strong resistance level, signaling bull weakness.
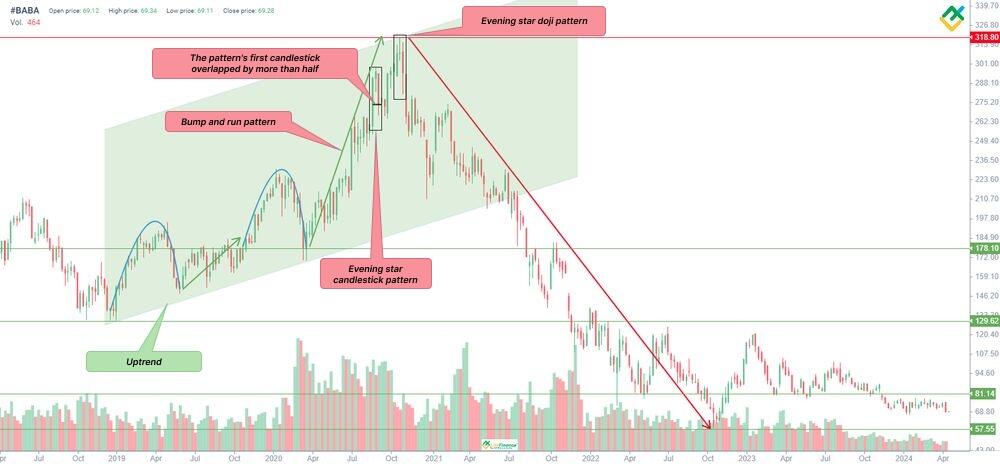
The weekly chart of #BABA stock shows the Bump and Run chart pattern that suggests drastic price growth with a subsequent reversal to the downside and an acute fall. The Evening Star and Evening Star Doji patterns predicted a price reversal level more accurately, especially the “Doji” candle. Thus, after the Evening Star Doji appeared on the chart, the shares of one of the largest Chinese companies declined by 82% in two years.
How to Identify an Evening Star
Even beginner traders will easily identify the Evening Star candlestick pattern in the chart after getting to know the signs of its formation.
This candlestick pattern allows you to identify a trend reversal to the downside at an early stage. When this pattern appears, it is best to close a long position. Once the pattern is confirmed, you can consider going short.
Factors for identifying the Evening star pattern on the chart:
-
This Japanese pattern forms at the end of an upward trend, signaling a trend reversal;
-
The pattern is built at the resistance level, so it is important to determine in advance the key support and resistance zones for a trading instrument;
-
If a gap forms between the first and the second, and between the second and the third candles, that’s a clear indication of an evening star;
-
If the bearish candle is much larger than the first bullish candle, that’s a strong signal for an impulse downward movement after the formation of the “evening star” pattern;
-
It is important to monitor the tick volume. If the volume is low in the first candle and increases sharply in the third candle, this confirms the pattern. In addition, it is necessary to keep an eye on money flows in the asset, as volume drives market demand/supply.
Evening Star Example
The formation of the evening star candlestick pattern varies from one asset to another.
Let’s examine some examples on a few time frames.
1. Crypto market, ETHUSD, M30 chart
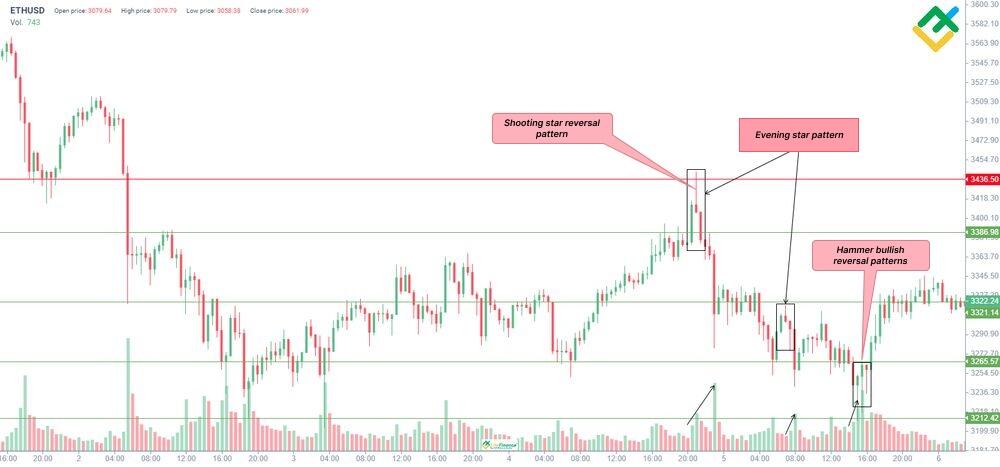
The price chart of Ethereum, the second-biggest cryptocurrency by market cap, shows the formation of the evening star pattern at the local top of 3,436.50, which includes another bearish reversal pattern—a shooting star. That signaled a price reversal and made it possible to open short trades in the asset.
Another evening star pattern formed at 3321.14 in the middle of the short-term trend (during consolidation) after the bulls failed to break through that resistance level. Besides, tick volumes were growing in each pattern, confirming bearish pressure.
A series of reversal bullish hammer patterns at 3,212.42 marked the end of the downtrend.
2. Forex market, AUDUSD, H1 chart
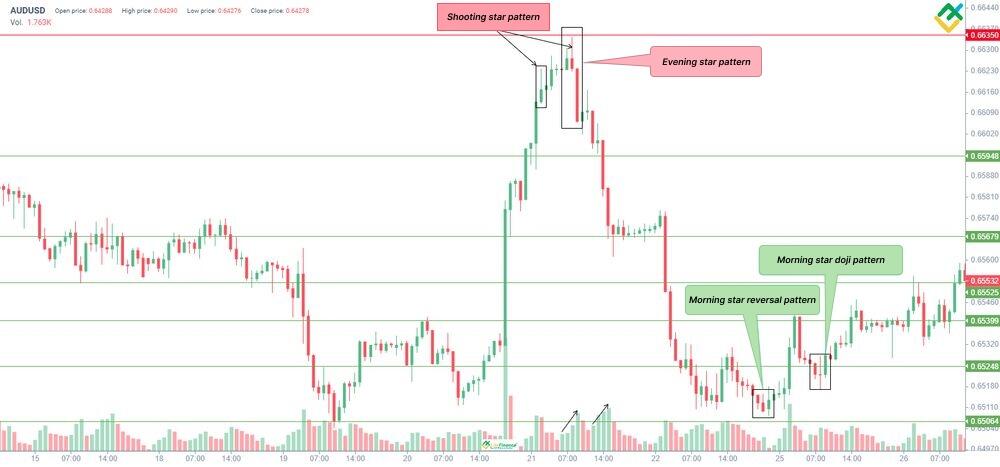
On the AUDUSD currency pair chart, we can identify the first shooting star pattern, which signaled the end of the uptrend. Next, we can observe the formation of the evening star pattern, which includes another shooting star pattern, thus strengthening the main pattern. It is also necessary to note that trading volumes in the instrument were growing while the “evening star” pattern was forming, confirming the reversal of quotes downward.
Once the price reached the key support level of 0.6506, the chart showed patterns opposite to the evening star—a morning star and a morning star doji. This became a signal for the bears to close short positions.
3. Stock market, #NIKE, H4 chart
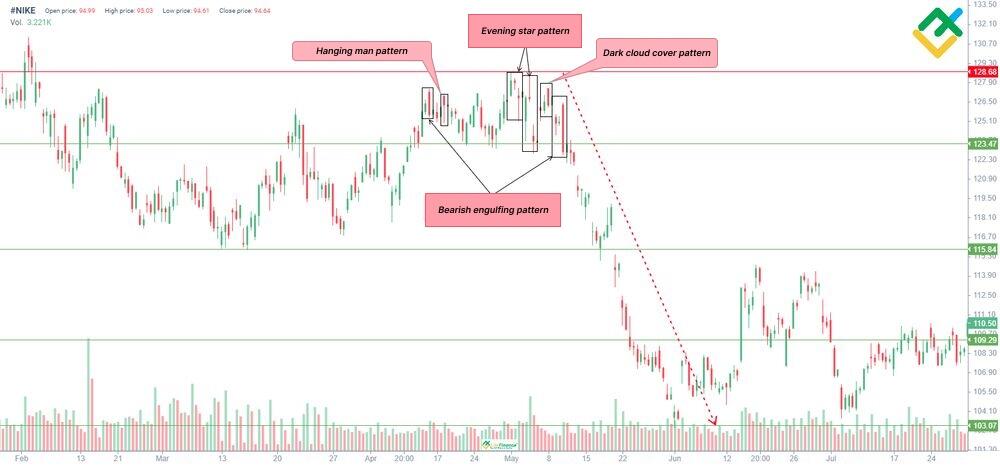
Candlestick patterns are more effective and distinctly formed on stock charts. For example, the chart above shows the asset’s consolidation between 128.68 and 123.47. The exit from this consolidation can be up or down. However, a breakout to the downside should be expected in this situation as we’re dealing with a local price maximum at which many reversal bearish patterns have formed.
The bearish engulfing pattern was the first to warn of a downward reversal. Then, another “hanging man” reversal pattern has formed, warning traders that the asset reached the area of high prices.
Further, we can see an unusual evening star pattern example. However, gaps after the second candle speak for themselves. In this case, we can see strong selling pressure.
The dark cloud pattern and another bearish engulfing pattern confirmed the evening stars. They became the final signals, after which the price rushed down.
4. Futures on S&P500 index, D1 chart.
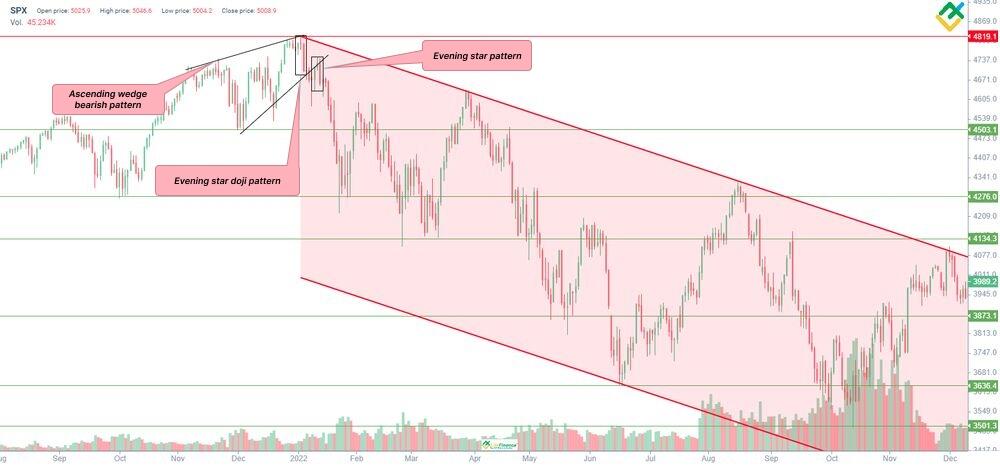
The beginning of 2022 was marked by significant challenges for the global economy: skyrocketing inflation, tightening of central-bank monetary policies, geopolitical military conflicts worldwide, etc. As a result, the key US index, the S&P 500, has fallen to record lows in the last 15 years.
The decline and the market’s transition into a bearish phase were accompanied by the formation of evening stars at historical price peaks. In addition, those candlestick patterns confirmed a larger Ascending wedge chart pattern. This combination was a strong signal to close long positions.
How to Trade Evening Star
The Evening Star candlestick pattern is widely used in trading as it is efficient and easy to spot. It is also easy to incorporate into your trading strategy to increase the likelihood of profitable outcomes. Let’s look at a few effective trading strategies using the Evening Star pattern.
1. Trading with resistance levels
This strategy suggests opening a short trade after the pattern has formed on the top near the key resistance.
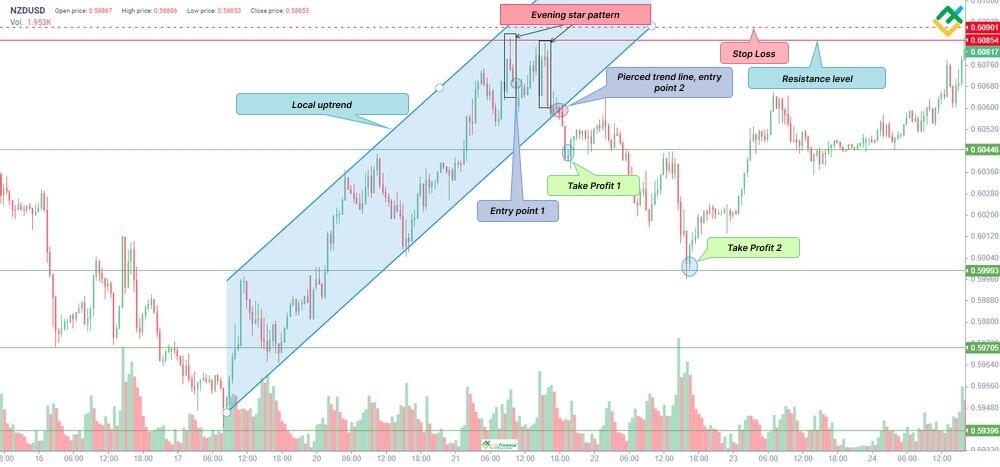
The NZDUSD‘s M30 chart shows an evening star formed below 0.6085. Afterward, the quotes slightly declined and turned upwards to retest the resistance level. However, the attempt failed, as indicated by the second evening star pattern and the trendline breakout to the downside.
In this case, a short position could have been opened after the first or the second pattern formed. The only difference is that opening a position following the first pattern formation would have been more profit-yielding because the first evening star was higher. A Stop Loss should have been placed above the resistance at 0.6090. Profits could have been locked in parts, with a Take profit set at support at 0.6044-0.5999.
2. Trading the Evening Star with other candlestick formations
This trading strategy suggests confirming the pattern using other candlestick formations.
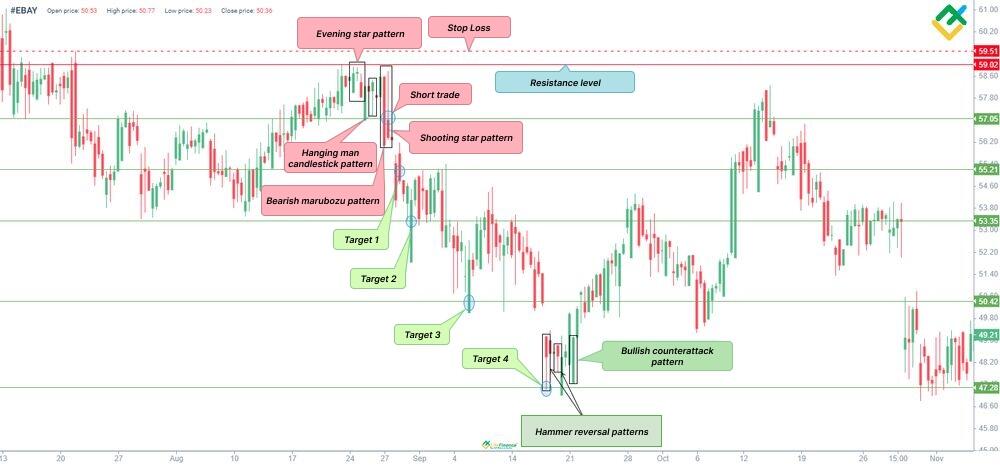
The above 4-hour chart of #EBAY stock shows the evening star pattern formed at the resistance of 59.02; then, the quotes turned downwards.
Following the evening star, a hanging man, a bearish marubozu, and a shooting star with a long upward shadow formed. The combination of these patterns confirmed bullish weakness and active asset sales.
In this case, a short position could have been opened at around 57.05 after other bearish figures formed. Similarly to the previous strategy, a Stop Loss could have been set above the resistance level at 59.51. The targets were 55.21, 53.35, 50.42, and 47.28.
The formation of Hammer and Bullish counterattack reversal patterns was a bearish signal for closing positions. Upon their formation, the quotes turned upward, helping bulls rebound to 57.05.
3. Trading the Evening Star with technical indicators
This hybrid strategy of trading the evening star pattern involves using candlestick analysis and technical indicators simultaneously.
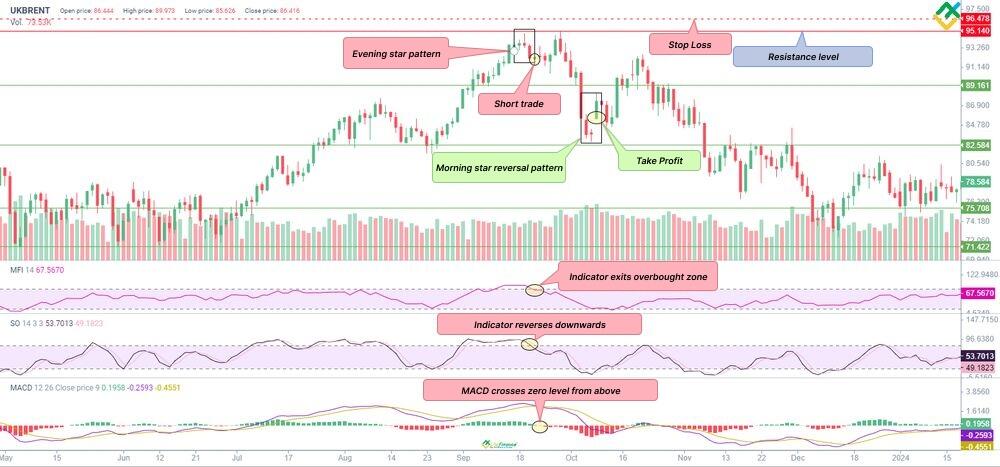
For example, let’s take the UKBRENT‘s daily chart and the following technical indicators:
-
MFI, a volume indicator that shows cash flows in an asset;
-
Stochastic, a stochastic oscillator that compares the current price to a certain price period in the past. It is used to determine oversold and overbought levels for an asset;
-
MACD, a technical indicator that helps market participants diagnose the strength and direction of the trend and identify more profitable market entry points.
The chart above shows MFI and Stochastic exit the overbought zone downwards during the formation of the evening star pattern. This indicates an outflow of money from the asset, signaling a price reversal.
Moreover, the MACD indicator values crossed the zero boundary from above and began to grow in the negative zone while the evening star was forming. This also confirmed the change of direction and emphasized strong selling pressure.
After identifying these signals, a short position could have been opened at around 92.00. A Stop Loss should have been set at 96.47. The profit target was at 82.58, a strong support level for the bulls. The morning star pattern and the gap between its second and third candles were a signal to close short positions.
Evening vs. Morning Star Patterns differences
The Evening star pattern is a bearish version of the Morning star candlestick pattern.
The table below presents the differences between the two patterns in detail.
|
Evening Star |
Morning Star |
|
The Evening Star signals a downward reversal of the asset. |
The Morning Star indicates a downtrend is ending and signals an upward price reversal. |
|
It is formed at the end of an uptrend at local or new historical price highs. |
The Morning Star pattern is formed at the end of a downtrend at the market bottom. |
|
The pattern consists of three candles: the first bullish candle, the second green or red candle, and the third bearish candle. |
The pattern also consists of three candles: the first red candle, the second bullish or bearish candle, and the third bullish candle. |
|
When the pattern is formed, we should open a short position and place a stop loss above resistance. |
When this pattern is formed, we should open a long position and place a stop loss below support. |
Pros and Cons of Using Evening Star Pattern
Like any other candlestick pattern, an Evening Star has pros and cons. The advantages of this candlestick pattern are as follows:
-
This chart pattern allows traders and investors to predict the level of a downward price reversal and enter the market at a more attractive price.
-
The pattern can be found on charts of almost any financial asset and used on various time frames. This allows you to successfully apply it to various trading strategies and make trading decisions more effectively;
-
The pattern is easy to identify on a price chart;
-
This candlestick pattern has clear rules for opening a short position and placing a stop loss and a take profit.
The following factors can be seen as the disadvantages of the Evening Star pattern:
-
It is best used on charts starting from M30. The older the time frame that the pattern is formed on, the stronger its signal for a trend reversal. On charts under M30, there is a risk of false signals as the market noise level is higher;
-
When trading this pattern, it is necessary to get additional confirmations from other technical indicators and reversal candlestick patterns.
Conclusion
To sum up, we should emphasize that an evening star is a reliable candlestick pattern that helps traders determine price reversal levels in advance. This, in turn, allows us to open a short trade at more attractive prices, maximizing profit in case the pattern works out successfully.
The Evening Star candlestick pattern has a simple three-candlestick structure that is easy to spot at the top. It is recommended that the pattern be combined with technical indicators and other chart and candlestick patterns.
The pattern will help you strengthen a trading strategy and increase its effectiveness. To successfully implement the Evening Star pattern into your trading system, you can use a free demo account at LiteFinance. This online trading platform provides an extensive array of assets and technical analysis tools.
Evening Star pattern FAQs
The shooting star pattern consists of one candle with a short body and a long upper shadow, while the evening star pattern consists of three candles and is a stronger signal for a downward price reversal. A shooting star is also a reversal pattern, but it gives a false signal more often, and the price resumes growth after a slight correction.
The evening star is an effective reversal chart pattern that warns of a trend change in advance. However, just like any other candlestick pattern, it requires confirmation by other patterns and technical indicators.
With older time frames, a reversal occurs in 80-90% of cases. This strong pattern warns market participants of a forthcoming sell-off of a trading asset and allows them to close long positions at a more attractive price.
First, identify the evening star pattern on the chart and determine the support and resistance levels for the asset. Then, wait for confirmation from technical indicators and other candlestick patterns. Once you are completely certain about your forecast, open a short position and place a Stop Loss above the pattern and the resistance level. Place a Take Profit at the nearest support levels or before bullish reversal patterns have formed in the chart.

The content of this article reflects the author’s opinion and does not necessarily reflect the official position of LiteFinance. The material published on this page is provided for informational purposes only and should not be considered as the provision of investment advice for the purposes of Directive 2004/39/EC.
{{value}} ( {{count}} {{title}} )
This post is originally published on LITEFINANCE.