Plug Power Inc., a leader in hydrogen fuel cell technology, has been redefining energy consumption since its inception in the 1990s. As a key player in the renewable energy sector, the company’s focus on sustainable fuel cell solutions for electric vehicles and power applications is pivotal. Its NASDAQ-listed stock, PLUG, is a barometer for both the company’s success and the acceptance of hydrogen technology in the market.
Investors and industry experts closely watch PLUG, as it reflects the complexities of the energy innovation sector. Understanding the various factors influencing Plug Power’s stock is crucial, especially in a world transitioning to sustainable energy. This article will delve into the intricacies and potential future of Plug Power, highlighting the challenges and opportunities in this evolving energy landscape.
The article covers the following subjects:
Highlights and Key Points: Plug Power Stock Forecast 2024-2029
- Today, on 03.07.2024, Plug Power stock is around $2.39.
- Forecasts for 2024 vary from $1.67 to $3.55, reflecting differing views on the development prospects for hydrogen fuel, competition, and regulatory changes, according to CoinPriceForecast, WalletInvestor, and PandaForecast.
- Long-term estimates for 2026-2030 range from near-zero levels to a high of $9.62 based on market presence and potential risks, according to CoinPriceForecast, WalletInvestor, and PandaForecast.
Plug Power Stock Price Today, Coming Days and Week
When forecasting Plug Power’s stock price in the near term, consider several key factors. Analyze quarterly earnings reports for insights into revenue growth, profit margins, and future guidance. Pay attention to developments in the hydrogen and fuel cell industry, as advancements and adoption rates can significantly impact Plug Power’s market position. Monitor regulatory and policy changes, particularly those related to clean energy and environmental initiatives, which can affect demand for Plug Power’s products. Keep an eye on partnerships and contracts with major companies, as these can drive growth and investor confidence. Additionally, track overall market sentiment towards renewable energy stocks and broader economic indicators that influence market conditions.
Analysts’ Plug Power Stock Projections for 2024
Let’s take a look at expert forecasts for the PLUG rate in 2024.
CoinPriceForecast
Price range for 2024: $2.28 – $2.86 (as of July 3, 2024)
CoinPriceForecast expects a modest rise in Plug Power’s stock price in 2024. The price is projected to reach $2.28 mid-year and rise to $2.86 by year-end.
| Year | Mid-Year, $ | Year-end, $ |
|---|---|---|
| 2024 | 2.28 | 2.86 |
PandaForecast
Price range for 2024: $2.08 – $3.11 (as of July 3, 2024).
Analysts at PandaForecast project a volatile year for Plug Power’s stock. In July, the average price is expected to rise to $2.93. A correction to $2.26 is expected in August, but a slight recovery to $2.32 is expected in September. A decline to $2.26 is projected in October, with the price rising to $2.40 in November. December will see moderate drop to $2.38.
| Month | Average price, $ | Low, $ | High, $ |
|---|---|---|---|
| July | 2.93 | 2.80 | 3.11 |
| August | 2.26 | 2.14 | 2.51 |
| September | 2.32 | 2.19 | 2.57 |
| October | 2.26 | 2.08 | 2.37 |
| November | 2.40 | 2.26 | 2.60 |
| December | 2.38 | 2.15 | 2.64 |
LongForecast
Price range for 2024: $1.04 – $2.41 (as of July 3, 2024).
According to LongForecast, Plug Power’s stock will drop significantly, sliding to $1.61 in July, $1.37 in August and $1.16 in September. A short-term increase to $1.33 is forecasted in October, followed by a drastic decrease to 1.13 in November. The price will slightly to $1.16 by year-end.
| Month | Opening, $ | Min.-Max.,$ | Closing, $ |
|---|---|---|---|
| July | 2.28 | 1.43-2.41 | 1.61 |
| August | 1.61 | 1.26-1.81 | 1.37 |
| September | 1.37 | 1.07-1.37 | 1.16 |
| October | 1.16 | 1.16-1.44 | 1.33 |
| November | 1.33 | 1.04-1.33 | 1.13 |
| December | 1.13 | 1.07-1.25 | 1.16 |
Plug Power Stock Technical Analysis
When conducting a technical analysis of Plug Power’s (#PLUG) stock, it’s important to use several time frames to estimate various aspects of price movements and predict trends. Daily, weekly, and monthly time frames are generally used.
Technical analysts also apply a wide array of tools:
- Candlestick charts help visualize price data, opening/closing levels, and highs/lows over a certain period.
- Indicators such as moving averages (SMA or EMA), Stochastic Oscillators, and the Relative Strength Index (RSI) help identify overbought/oversold levels and momentum change.
- Chart patterns such as Double Top, Double Bottom, or Flags help spot key support and resistance and predict possible price directions.
Combining these tools provides a more comprehensive picture of Plug Power stock’s technical structure and current performance. For example, daily and weekly charts help investors and traders evaluate both near-term and long-term trends, while indicators and patterns provide signals for making buy or sell decisions based on technical analysis.
Get access to a demo account on an easy-to-use Forex platform without registration
#PLUG Stock Forecast for Next Three Months
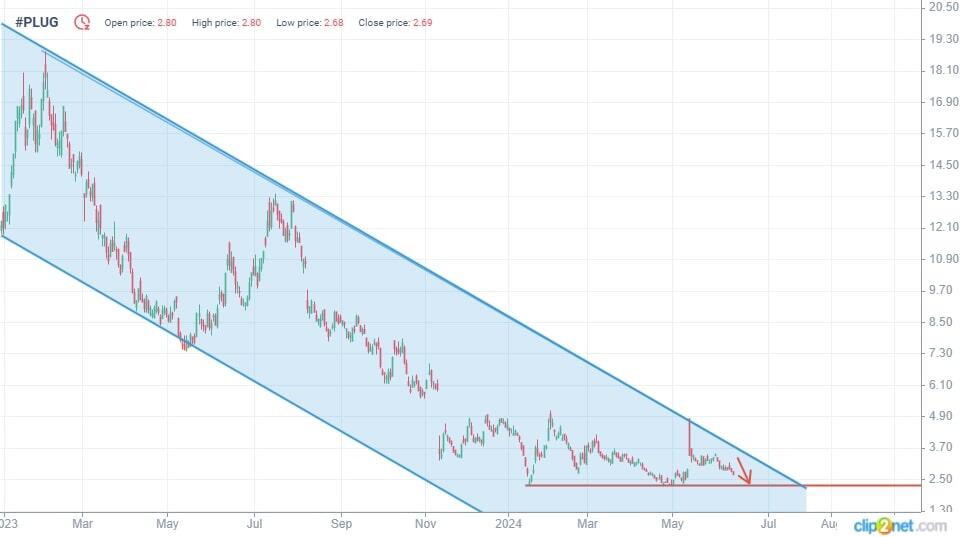
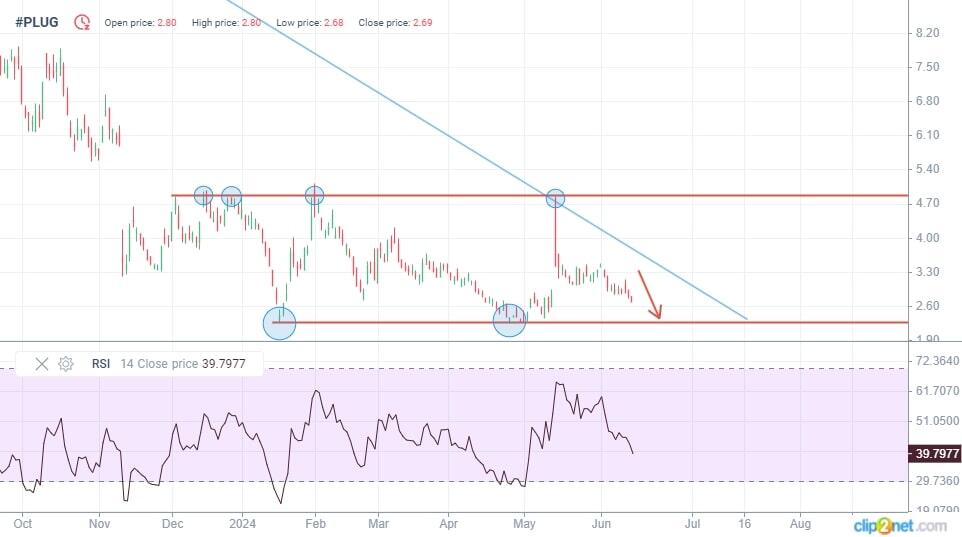
The daily time frame analysis has shown that Plug Power (#PLUG) stock has been trading in a downward range for 1.5 years. The resistance at 2.30 is important as the price has repeatedly approached it without breaking above.
The current RSI reading of 39 indicates the stock is moderately oversold, meaning that an upward movement may develop if the resistance is broken or indicator signals of a further price move are confirmed. Traders should continue with technical analysis to map out a strategy for entering or exiting positions in line with the current picture.
Long-Term Plug Power Shares Technical Analysis for 2024
The current figures and weekly time frame analysis suggest mixed signals for the company’s stock. On the one hand, the company’s profits have been declining over the previous reporting period.
On the other hand, technical indicators point to potential stability and possible growth. For instance, the RSI reading of 39 indicates that the company’s shares are relatively oversold, signaling potential consolidation or correction. The MACD lines are moving in a parallel upward-sloping channel, backing the signal for a new uptrend or continued upward movement.
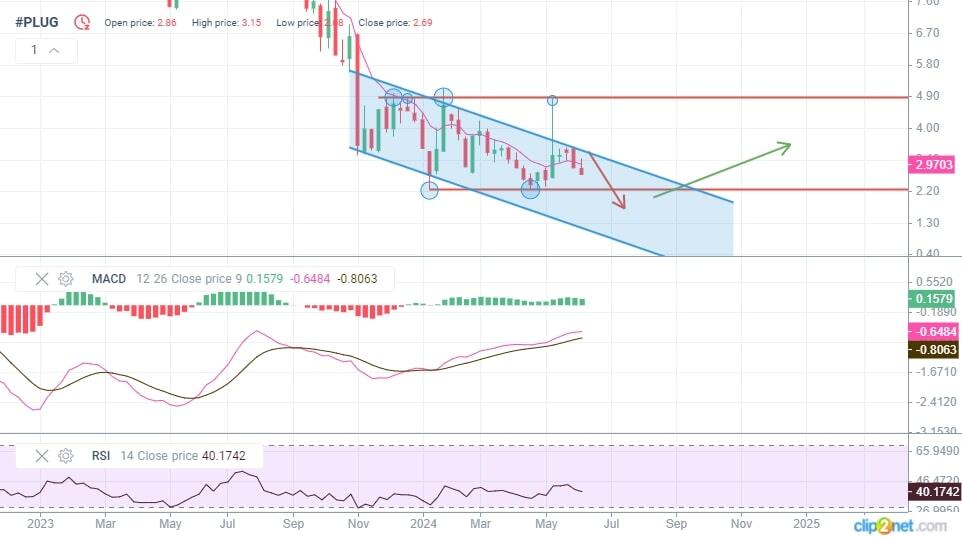
The EMA line is above the current price on the weekly time frame, additionally confirming the potential for the uptrend. These technical signals give reasons for an optimistic outlook for Plug Power’s shares despite financial challenges. However, investors should consider the risks associated with unprofitable shares and eventual market volatility.
| Month | Plug Power Inc. (#PLUG) projected price values | |
|---|---|---|
| Minimum | Maximum | |
| July 2024 | 1.77 | 2.66 |
| August 2024 | 1.92 | 2.39 |
| September 2024 | 1.73 | 2.21 |
| October 2024 | 1.56 | 1.88 |
| November 2024 | 1.57 | 1.86 |
| December 2024 | 1.66 | 1.93 |
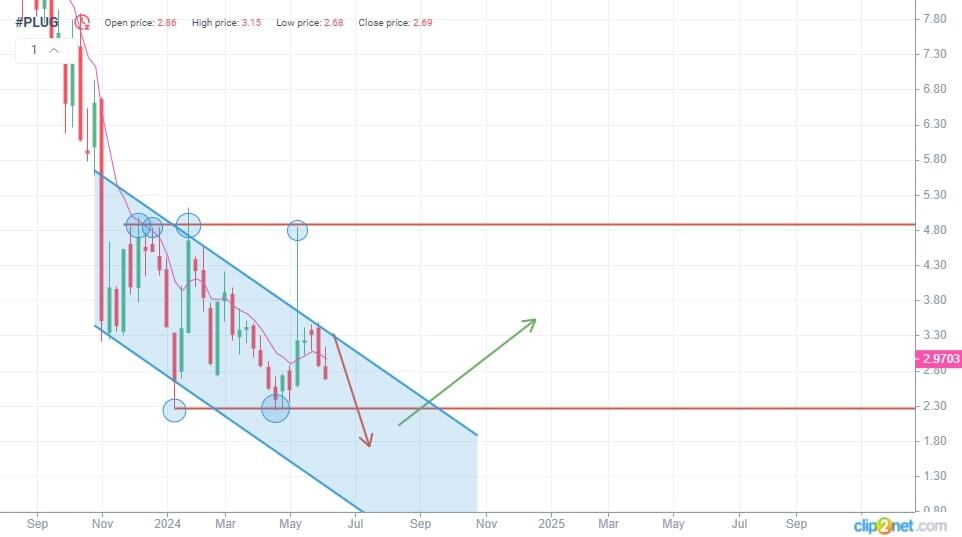
Long-Term Trading Plan for Plug Power Inc. (#PLUG)
A trading plan for 2024 considers various Buy and Sell scenarios:
1. Buy:
- Entry level: $2.30 (support);
- Signal: signs of a rebound or forming bullish signals;
- Take Profit: $2.50;
- Stop Loss: $2.08;
- Consider opening trades once growth is confirmed upon reaching support. The target is to lock in profit at $2.50 and avoid losses with a Stop Loss set at $2.08.
2. Sell:
- After a breakout of support at $2.30 with consolidation below that level;
- Take Profit: $1.80;
- Stop Loss: $2.67;
- Consider shorts if support is broken out and the price hits $2.30. The target is to lock in profit at $1.80 and avoid losses with a Stop Loss set at $2.67.
This plan helps outline trading positions in 2024 based on key entry/exit points and risk/profit management strategies. Please evaluate the current market situation before making important trading decisions and adapt your trading plan to market changes and financial goals.
Plug Power Stock Forecast for 2025
Let’s take a look at expert forecasts for the PLUG rate in 2025.
CoinPriceForecast
Price range for 2025: $2.91 – $3.30 (as of July 3, 2024).
According to CoinPriceForecast, Plug Power’s stock may grow significantly in 2025. The price is projected to rise to $3.77 in the first six months in a stable upward range. In the year’s second half, the growth is expected to continue, reaching $4.18 by year-end, a significant rise of 55% compared with the current value. These forecasts point out a positive outlook for investors, making Plug Power stock an attractive long-term investment.
| Year | Mid-Year, $ | Year-end, $ |
|---|---|---|
| 2025 | 2.91 | 3.30 |
PandaForecast
Price range for 2025: $1.94 – $2.92 (as of July 3, 2024).
Plug Power’s share price is expected to fluctuate dramatically in 2025, with an overall robust growth forecast. In January, the average price will reach $2.44, drop a bit in February, with a minimum of $2.12 and a maximum of $2.44. A downfall to $2.19 is forecast for March, followed by a small correction to $2.34 in April. An uprising is expected in May, but decline will continue. Despite fluctuations, the price will steady at $2.47 in December.
| Month | Average price, $ | Minimum, $ | Maximum, $ |
|---|---|---|---|
| January | 2.44 | 2.26 | 2.57 |
| February | 2.28 | 2.12 | 2.44 |
| March | 2.19 | 1.94 | 2.44 |
| April | 2.34 | 2.11 | 2.50 |
| May | 2.65 | 2.57 | 2.92 |
| June | 2.57 | 2.46 | 2.70 |
| July | 2.44 | 2.20 | 2.68 |
| August | 2.41 | 2.17 | 2.63 |
| September | 2.30 | 2.16 | 2.52 |
| October | 2.24 | 2.15 | 2.35 |
| November | 2.18 | 2.11 | 2.32 |
| December | 2.47 | 2.21 | 2.67 |
LongForecast
Price range for 2025: $1.10 – $2.16 (as of July 3, 2024).
According to LongForecast, Plug Power’s stock will fluctuate significantly throughout 2025, trending upwards overall. Opening at $1.16 in January, the stock will close at $1.20. In February, the price will range from $1.15 to $1.35, closing at $1.25 and remaining the same in March. The stock will grow to $1.30 in April. From May to July the price will be rising steadily from $1.35 to $1.44. A significant rise to $1.66 and then to 1.91 is expected in August and September respectively. From October to November shares will be climbing to $2, but December will see a correction to $1.70.
| Month | Opening, $ | Min.-Max.,$ | Closing, $ |
|---|---|---|---|
| January | 1.16 | 1.10-1.30 | 1.20 |
| February | 1.20 | 1.15-1.35 | 1.25 |
| March | 1.25 | 1.15-1.35 | 1.25 |
| April | 1.25 | 1.20-1.40 | 1.30 |
| May | 1.30 | 1.24-1.46 | 1.35 |
| June | 1.35 | 1.28-1.50 | 1.39 |
| July | 1.39 | 1.32-1.56 | 1.44 |
| August | 1.44 | 1.44-1.79 | 1.66 |
| September | 1.66 | 1.66-2.06 | 1.91 |
| October | 1.91 | 1.78-2.08 | 1.93 |
| November | 1.93 | 1.84-2.16 | 2.00 |
| December | 2.00 | 1.56-2.00 | 1.70 |
Long-Term Plug Power Stock Forecast for 2026
Let’s take a look at expert forecasts for the PLUG rate in 2026.
CoinPriceForecast
Price range for 2026: $3.42 – $4.04 (as of July 3, 2024).
Coin Price Forecast Center suggests an optimistic outlook for Plug Power’s stock in 2026, expecting a drastic rise in quotes. The year will start at $3.30; then, the price will grow to $3.42 during the first six months and close at $4.04 by year-end.
| Year | Mid-Year, $ | Year-end, $ |
|---|---|---|
| 2026 | 3.42 | 4.04 |
PandaForecast
Price range for 2026: $2.22 – $3.44 (as of July 3, 2024).
PandaForecast says Plug Power’s stock will see significant fluctuations in 2026. In January, the average price will reach $2.37, it will rise to $2.68 in February and to $2.76 in March. From April to July the price will decline to $2.45, but in August it will rise back again to $2.62. The stock will jump to $2.75 in September and to $3.09 in October, reaching the year’s highest. In November, the average price will drop to $2.74 and rise to $2.82 in December.
| Month | Average price, $ | Minimum, $ | Maximum, $ |
|---|---|---|---|
| January | 2.37 | 2.28 | 2.64 |
| February | 2.68 | 2.50 | 2.89 |
| March | 2.76 | 2.60 | 2.93 |
| April | 2.69 | 2.38 | 2.84 |
| May | 2.69 | 2.48 | 2.98 |
| June | 2.45 | 2.22 | 2.67 |
| July | 2.45 | 2.37 | 2.73 |
| August | 2.62 | 2.40 | 2.85 |
| September | 2.75 | 2.51 | 2.97 |
| October | 3.09 | 2.82 | 3.44 |
| November | 2.74 | 2.58 | 3.05 |
| December | 2.82 | 2.56 | 2.97 |
LongForecast
Price range for 2026: $0.96 – $1.80 (as of July 3, 2024).
LongForecast predicts drastic fluctuations for Plug Power’s stock in 2026, reflecting extreme market volatility. January will see opening and closing prices at $1.70 and $1.45. In February, the price will rise to $1.67 and March will see a new decline to $1.42. The price will drop to $1.22 in May and then to $1.04 in June. The price will rise temporarily to $1.59 in September, but the year will close at the decline to $1.32.
| Month | Opening, $ | Min.-Max.,$ | Closing, $ |
|---|---|---|---|
| January | 1.70 | 1.33-1.70 | 1.45 |
| February | 1.45 | 1.45-1.80 | 1.67 |
| March | 1.67 | 1.31-1.67 | 1.42 |
| April | 1.42 | 1.32-1.54 | 1.43 |
| May | 1.43 | 1.12-1.43 | 1.22 |
| June | 1.22 | 0.96-1.22 | 1.04 |
| July | 1.04 | 1.04-1.30 | 1.20 |
| August | 1.20 | 1.20-1.49 | 1.38 |
| September | 1.38 | 1.38-1.72 | 1.59 |
| October | 1.59 | 1.24-1.59 | 1.35 |
| November | 1.35 | 1.35-1.67 | 1.55 |
| December | 1.55 | 1.21-1.55 | 1.32 |
Long-Term Plug Power Stock Forecast for 2027–2030
CoinPriceForecast expects Plug Power’s stock to move in a stable upward range from 2027 to 2032. In early 2027, the price will reach $5.30 and grow to $7.45 by December. Further growth from $7.45 to $8.94 is projected for 2028. The year 2029 is expected to open at $8.94 and close at $10.40. In 2030, the opening and closing price estimations are $10.40 and $10.78, respectively, which confirms sustained optimism about the company’s prospects in the renewable energy sector.
| Year | Mid-Year, $ | Year-end, $ |
|---|---|---|
| 2027 | 4.65 | 5.25 |
| 2028 | 5.84 | 6.42 |
| 2029 | 7.00 | 7.57 |
| 2030 | 7.61 | 8.14 |
Recent Price History of the Plug Power Stock
Between 2021 and 2023, Plug Power Inc. (PLUG) experienced significant stock price fluctuations, reflecting the renewable energy sector’s volatility and changing investor sentiments. In 2021, fueled by enthusiasm for clean energy and the company’s expansion, the stock peaked at around $75, capturing investor optimism.
However, 2022 presented market conditions and competition challenges, leading to a more tempered stock price, oscillating between $20 and $30. Despite these hurdles, Plug Power continued its technological and infrastructural advancements. Into 2023, the stock began showing signs of stability around $30, still influenced by the sector’s rapid developments and economic factors, underscoring Plug Power’s ongoing relevance in the clean energy conversation.
Which Factors Impact Plug Power Stock Forecast?
The Plug Power stock Forecast is influenced by many factors, reflecting the dynamic nature of the stock market.
- Market Trends and Sentiment: The renewable energy sector’s overall market sentiment significantly impacts Plug Power’s stock.
- Technological Advancements: Innovations in hydrogen fuel cell technology or breakthroughs in cost reductions can significantly affect Plug Power’s market position and stock price.
- Regulatory Environment: Changes in government policies, subsidies, or regulations related to renewable energy can substantially impact Plug Power’s operations and profitability.
- Partnerships and Contracts: New deals or collaborations with other companies can provide access to new markets or technologies, influencing the stock’s prospects.
- Competitive Landscape: The actions of competitors, market share changes, or industry disruptions can impact Plug Power’s position and, consequently, its stock price.
- Macro-Economic Factors: Broader economic conditions, such as inflation rates, interest rates, and economic growth, can influence investor behavior and affect the stock market, including Plug Power shares.
Is Plug Power Stock Still a Good Investment?
In conclusion, the outlook for Plug Power stock remains uncertain, though not without potential. The divergent forecasts highlight the challenges in predicting growth for companies at the frontier of new technologies. Much depends on Plug Power’s ability to maintain its leadership in hydrogen fuel cells, strike key partnerships, and meet increasing demand as the world transitions to renewable energy. While optimism exists, risks around competition, regulations, and market sentiment persist.
While rewards may accrue long-term, uncertainty, and volatility remain inherent to its journey. Approached mindfully, Plug Power presents possibilities for those betting on the ascent of renewable energy.
FAQs on Plug Power Stock Forecast
The current price that #PLUG is trading at is around $2.39 per
share as of today 03.07.2024.
The decision to buy or sell Plug Power stock today is controversial: some analysts predict a lack of growth in the coming years due to current challenges, while others see potential growth based on the company’s leading position in hydrogen technology.
Projections for Plug Power’s stock price in 2025 vary widely. Some analysts expect the price to have reached a range between $1.67 and $3.53 by that time. Others take a more pessimistic view, predicting a possible price drop to bottom levels.
Optimistic forecasts suggest that Plug Power’s share price will rise to $7.32 by 2028, reflecting confidence in the company’s prospects. At the same time, more conservative projections indicate possible fluctuations and risks associated with future market changes.
Plug Power stock has potential based on the company’s leading role in developing hydrogen technologies and energy storage systems. However, success depends not only on technological innovation but also on market competitiveness and the company’s ability to adapt to changing market conditions and regulations.

The content of this article reflects the author’s opinion and does not necessarily reflect the official position of LiteFinance. The material published on this page is provided for informational purposes only and should not be considered as the provision of investment advice for the purposes of Directive 2004/39/EC.
{{value}} ( {{count}} {{title}} )
This post is originally published on LITEFINANCE.