The article covers the following subjects:
Major Takeaways
- Main scenario: Consider short positions from corrections below the level of 150.48 with a target of 142.50 – 138.65. A sell signal: the level of 150.48 is broken to the downside. Stop Loss: above 151.20, Take Profit: 142.50 – 138.65.
- Alternative scenario: Breakout and consolidation above the level of 150.48 will allow the pair to continue rising to the levels of 152.72 – 154.20. A buy signal: the level of 150.48 is broken to the upside. Stop Loss: below 149.80, Take Profit: 152.72 – 154.20.
Main Scenario
Consider short positions from corrections below the level of 150.48 with a target of 142.50 – 138.65.
Alternative Scenario
Breakout and consolidation above the level of 150.48 will allow the pair to continue rising to the levels of 152.72 – 154.20.
Analysis
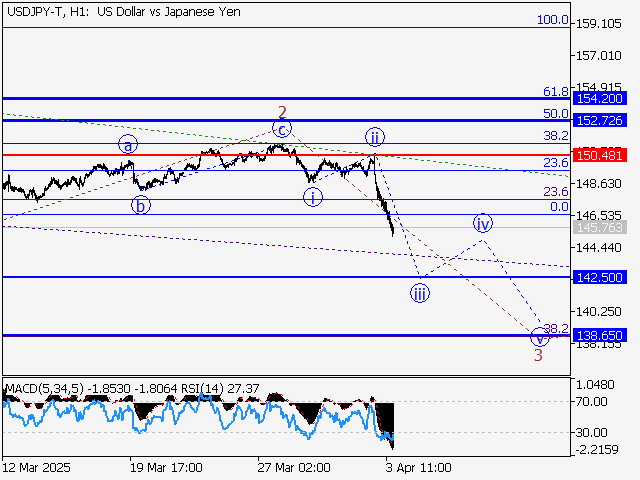
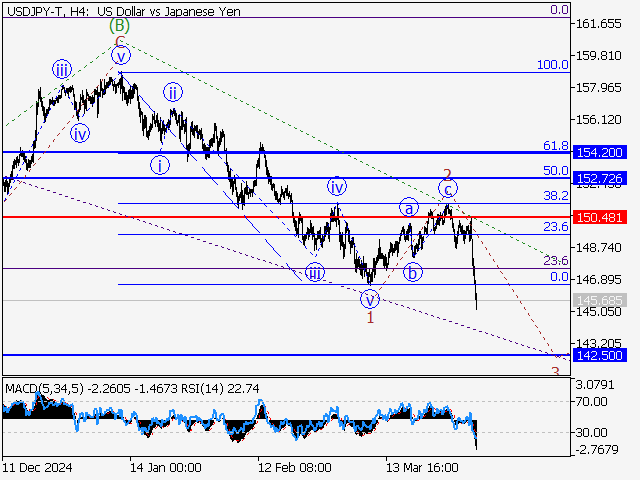
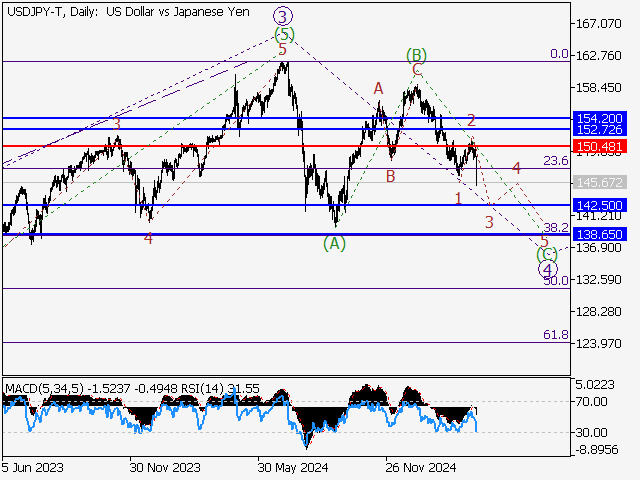
The daily time frame shows that the ascending wave of larger degree 3 is presumably formed, and the bearish correction continues developing as the fourth wave 4, within which wave (А) of 4 and the corrective wave (В) of 4 are completed. Wave (C) of 4 is developing on the H4 time frame, within which the first wave 1 of (C) is formed and a correction is completed as the second wave 2 of (C). Apparently, the third wave 3 of (C) is forming on the H1 chart, with wave iii of 3 developing as its part. If the presumption is correct, USD/JPY will continue to drop to the levels of 142.50 – 138.65. The level of 150.48 is critical in this scenario, as a breakout will enable the pair to continue rising to the levels of 152.72 – 154.20.
This forecast is based on the Elliott Wave Theory. When developing trading strategies, it is essential to consider fundamental factors, as the market situation can change at any time.
Price chart of USDJPY in real time mode

The content of this article reflects the author’s opinion and does not necessarily reflect the official position of LiteFinance broker. The material published on this page is provided for informational purposes only and should not be considered as the provision of investment advice for the purposes of Directive 2014/65/EU.
According to copyright law, this article is considered intellectual property, which includes a prohibition on copying and distributing it without consent.
{{value}} ( {{count}} {{title}} )
This post is originally published on LITEFINANCE.