SuperTrend is a well-known technical analysis indicator that empowers traders to identify market trends. Acting as a dynamic level of support or resistance, it helps identify potential entry and exit points. Developed by Olivier Seban in 2009, the SuperTrend indicator is a go-to choice for traders of all experience levels. It is based on the principles of the Average True Range (ATR) combined with a multiplier. On the chart, the indicator represents a line that changes color depending on the market trend.
The primary objective of the indicator is to identify the prevailing trend and its reversals. This article provides a comprehensive overview of the SuperTrend indicator, its settings, and its application in various strategies for trading stocks, currencies, and commodities.
The article covers the following subjects:
Major Takeaways
- SuperTrend is a technical indicator that identifies the current trend. In addition, the indicator generates buy and sell signals at the moment of a trend reversal.
- At its core, the indicator is a versatile tool that calculates an average true range to measure volatility, as well as highs and lows for the given period. The supertrend indicator uses a multiplier to plot the supertrend line above or below the price action.
- Basic parameters: 10 for periods and 3 for the multiplier. It is not recommended to reduce or increase the value of the multiplier considerably. The optimal setting ranges from 2.0 to 3.5.
- The most effective strategies are breakout trading and trend following, suitable for both intraday and medium-term trading.
- SuperTrend is most effective when combined with other momentum indicators to eliminate false patterns and identify more entry points.
- The indicator is not included in the MT4 platform’s standard toolbox. However, it can be downloaded from the MQL Market.
Understanding the SuperTrend Indicator
The SuperTrend indicator is a technical analysis tool designed to determine market trends in Forex trading.
Developed by Olivier Seban in 2009, it rapidly became a staple tool for many traders worldwide. What factors contributed to its widespread appeal among traders?
First, it is highly accessible and favored for its simplicity and ease of use. This lagging indicator helps traders swiftly identify uptrends and downtrends on the chart. Secondly, the SuperTrend model is straightforward. It is based on the speed of price changes, i.e., key support and resistance levels are determined by considering market volatility.
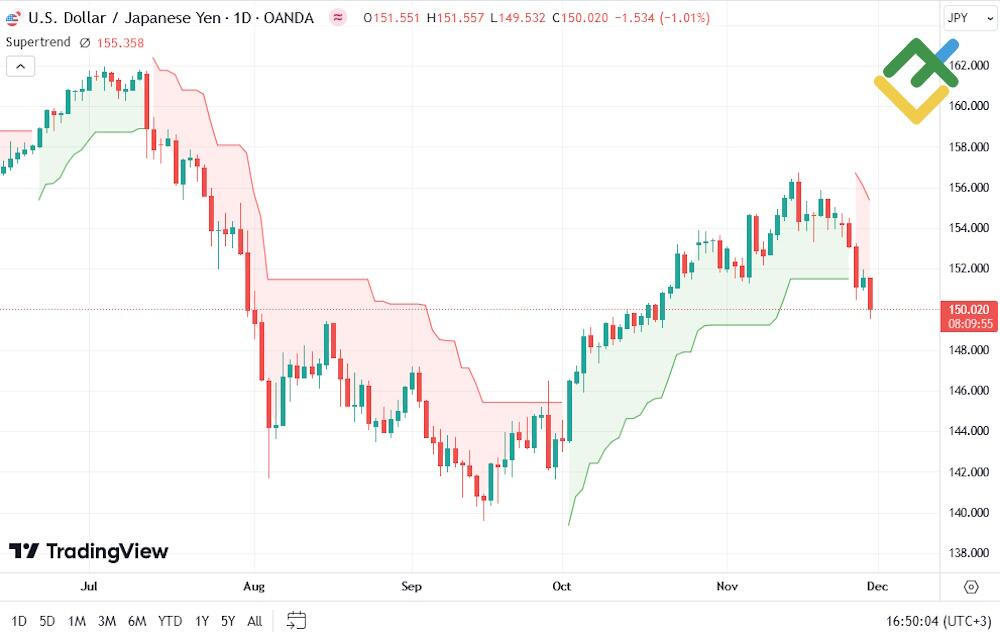
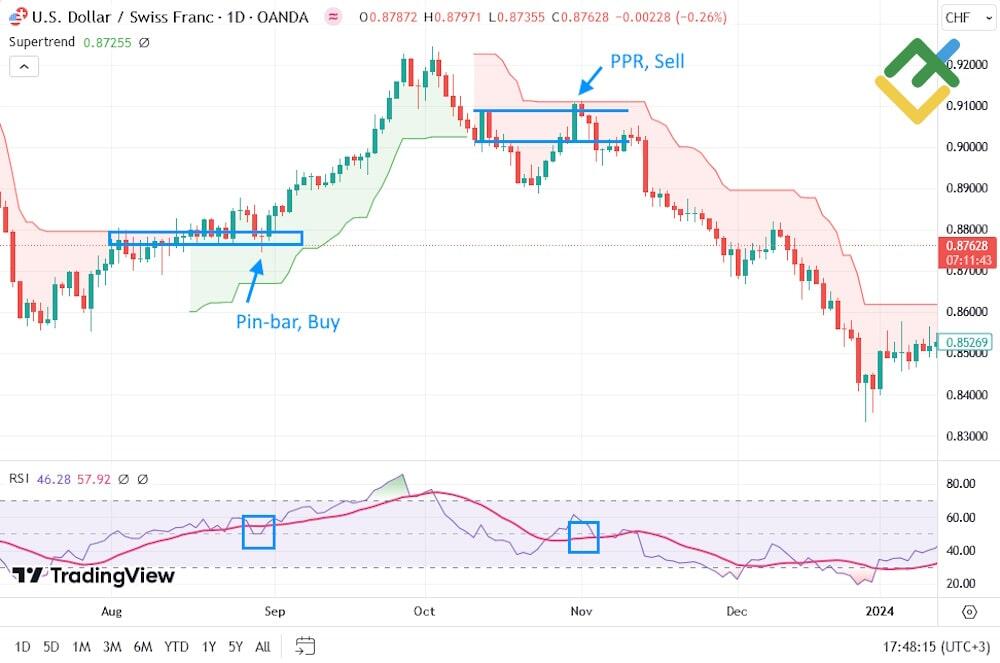
The following chart provides a clear illustration of how the SuperTrend indicator works.
The chart above shows that if the price price is above the supertrend line and the line is green, the bullish trend is present. When the price is below the supertrend line, and the line is red, it suggests a downtrend.
To interpret the signals, just look at the chart, and you will quickly identify trends on the time frame you are analyzing. As you can see, the indicator’s color-coded system offers a straightforward visual representation of market trends, appearing directly on price charts as a trend-following overlay.
Savvy traders may notice its similarity to moving averages. However, there is a key difference: the MA reflects the average price over a certain period, while the SuperTrend indicator shows investors the average range of price fluctuations over a certain period of time multiplied by a numerical value. In other words, these are two completely different indicators, even though they pursue one common goal.
The supertrend indicator’s value is based on the ATR and a multiplier. The ATR is the average true range, a measure of market volatility for the selected period. The multiplier is used to plot the supertrend line at a distance from the current price.
The indicator’s versatility encompasses a wide range of markets and time frames, making it a suitable tool for various investment scenarios. The underlying SuperTrend calculation method, which utilizes the average true range, ensures the indicator’s adaptability to changes in market trends. It can effectively handle increases in price volatility, as well as periods of market calm.
The indicator’s optimal performance is observed on higher time frames, where impulses are more pronounced and enduring. On lower time frames, market noise can be significant, and news releases can influence downtrends and uptrends, leading to frequent changes in the indicator signals. The optimal time frames for this indicator are H1, H4, and D1.
For users of the MetaTrader trading platform, the SuperTrend indicator should be downloaded. There is a version for both MetaTrader 4 and MetaTrader 5.
Components of the SuperTrend Indicator
The SuperTrend indicator is based on two components: the Average True Range and a multiplier. The Average True Range (ATR) measures market volatility based on price ranges over a certain period.
The multiplier is used to distance the indicator line from the current price. Notably, not every price fluctuation can be considered a trend reversal. As a rule, the price should form a strong impulse to signal a change in the price direction of an asset and establish a bullish or bearish trend.
These components create a powerful tool for identifying market trends and entry/exit points. The super trend indicator, represented as a red or green curved line, offers a clear visual representation of market trends.
Default Values and Customization
The default settings for the ATR and a multiplier are 10 and 3, respectively. If the first setting is increased, the indicator will consider more historical data in its calculations. Conversely, if the ATR is decreased, the indicator will rely solely on the most recent candlesticks. It is essential to identify an equilibrium and discern the scope of historical data necessary for analysis while recognizing when additional data becomes irrelevant.
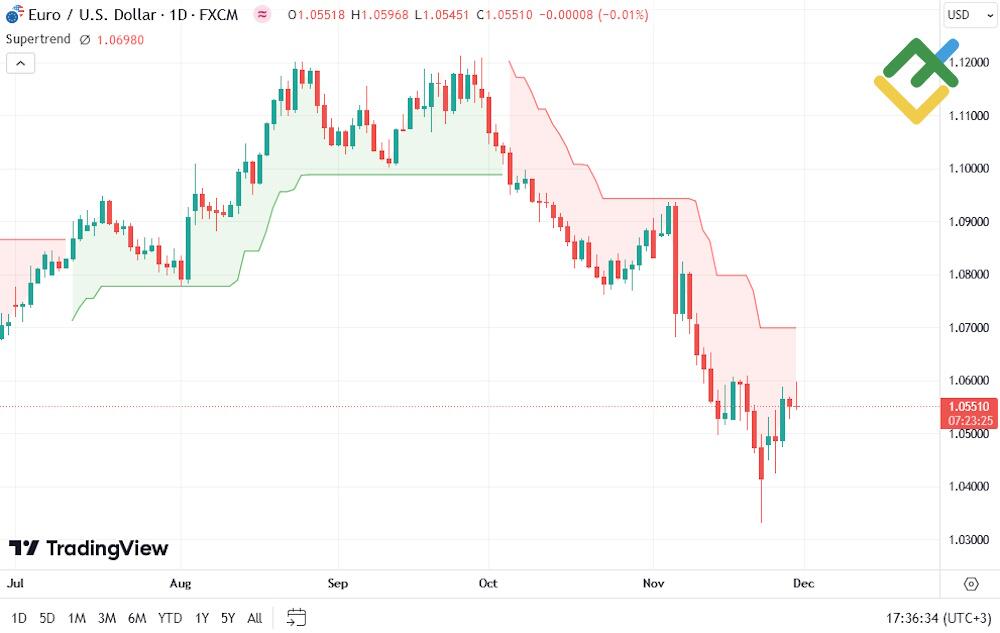
When the multiplier is set to a higher value, the indicator will generate fewer entry and exit signals, and the line will be positioned farther from closing prices. Conversely, when the multiplier is decreased, the indicator will respond more rapidly to changes in market volatility, though it may generate false signals. The following example illustrates the SuperTrend indicator with a standard multiplier value of 3.
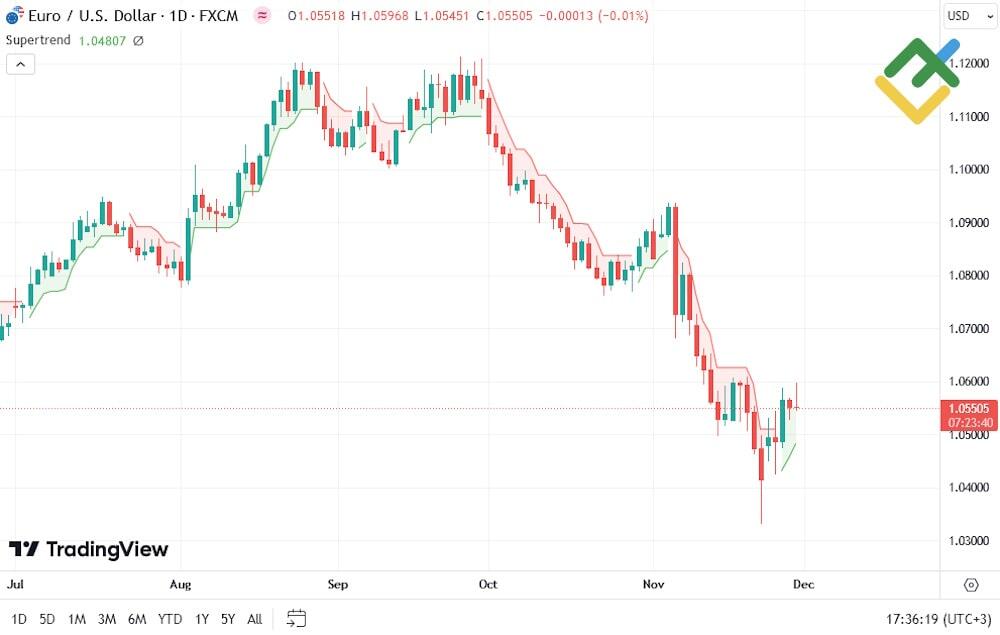
Here the multiplier is set to 1:
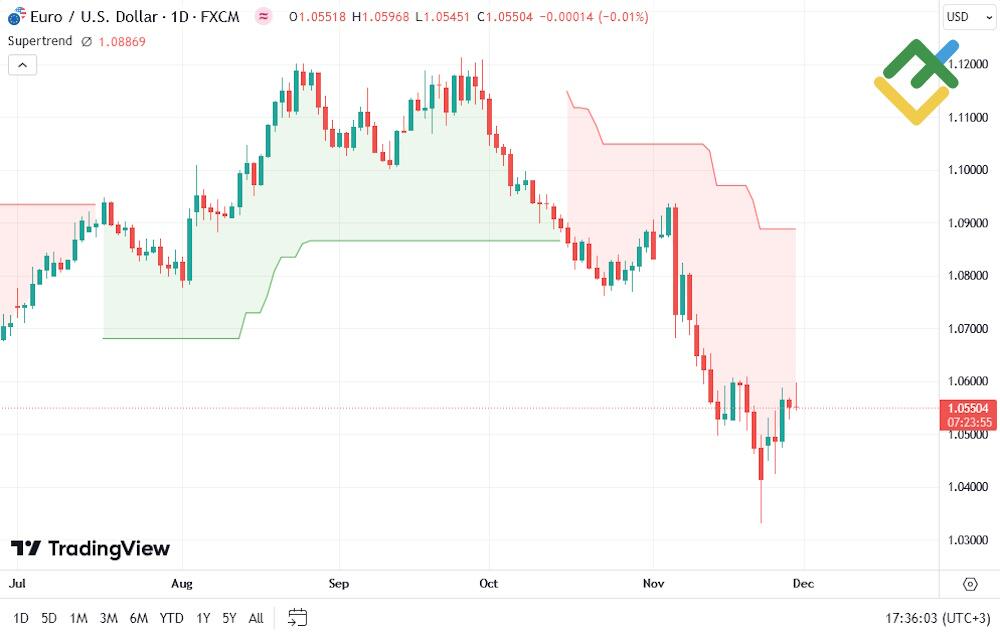
In this case, the multiplier has been changed to 5:
As you can see, the indicator perceives almost every fluctuation as a new trend when the multiplier is set to 1. When the multiplier value is increased to 5, it lags behind the price action.
The best settings are the default values of 10 and 3. If you are a beginner trader, it is better to leave them unchanged.
Calculating the SuperTrend Indicator
The SuperTrend indicator is typically calculated automatically by the platforms, so there is no need to calculate it manually. However, it is essential to understand how the indicator is calculated to comprehend the underlying patterns fully.
In addition, you will gain a comprehensive understanding of the best SuperTrend indicator settings, enabling you to deviate from the default settings and adjust the parameters to the selected financial instruments. The following section explores the SuperTrend indicator formula for calculating the ATR (average true range) value, along with the upper and lower bands of the SuperTrend indicator.
Average True Range (ATR) Formula
The formula to calculate ATR with a previous ATR calculation is:
ATR = (Previous ATR * (n – 1) + TR) / n
where:
-
n = number of periods or candlesticks;
-
TR = true range using one of the following values: today’s high minus its low, the absolute value of today’s high minus yesterday’s close, or the absolute value of today’s low minus yesterday’s close.
-
Previous ATR = the true range of the previous day or candlestick.
If you do not have a value for the ATR of the previous day or candlestick, it can be calculated using the formula:
Calculating Supertrend’s Upper and Lower Bands
After calculating the average true range, we can calculate the upper and lower bands of the Supertrend indicator. The indicator plots a line above or below the price, necessitating a calculation for both scenarios to determine the appropriate line value. Use the following formulas:
Upperband = (High + Low) / 2 + (Multiplier * ATR)
Lowerband = (High + Low) / 2 – (Multiplier * ATR)
where:
- High = the highest price of the asset during a specific period.
- Low = the lowest price of the asset during a specific period.
- ATR = the average true range we obtained.
- Multiplier = a constant value that you use to make the indicator more or less sensitive to price movements. Usually, integers are used, though other values can also be employed. It is recommended to use a default multiplier of 3.
Calculation Example
Suppose the asset has a price high of $77.40 and a low of $73.62. A multiplier is set to 3, and the ATR is $2.22.
Now, let’s calculate the upper band:
(77.40 + 73.62) / 2 + (3 * 2.22)
151.02 / 2 + 6.66
75.51 + 6.66 = $82.17
Accordingly, the lower band will be:
(77.40 + 73.62) / 2 – (3 * 2.22)
151.02 / 2 – 6.66
75.51 – 6.66 = $68.85.
The upper and lower bands are displayed on the chart. After that, the value of the last closed candlestick is taken. If this value is higher than the upper band, we leave only the lower band on the chart and consider the asset to trade in an upward trend. The opposite is true; if the price of the last candlestick is below the lower band, then we leave only the upper band and assume that the asset is maintaining a downtrend.
The principle is the need to shift the indicator from the average price. At the moment when the price touches the line, the curve reverses.
The final formula looks like this:
SuperTrend = Average price ± (Multiplier × ATR)
Why Is the SuperTrend Indicator Important?
Traders favor the SuperTrend indicator for several reasons:
- The SuperTrend indicator is a popular technical indicator. It is user-friendly and straightforward to interpret. The indicator changes color and position relative to the price.
- It is versatile and compatible with a wide range of assets, including currencies, stocks, and commodities.
- It serves as a reliable trend indicator, offering a clear and consistent view of market movements. It swiftly identifies trend direction (bullish or bearish)
- The indicator automatically adjusts for market fluctuations, ensuring accuracy and reliability. It adjusts the key level depending on volatility.
- It eliminates false signals almost completely. The ATR (Average True Range) enables the indicator to take into account market volatility and filter out market noise.
- It offers a reference level for setting stop-loss orders. Traders often use the indicator lines to place protective orders.
- It generates trading signals. The indicator is a valuable tool that clearly indicates the optimal timing to enter the market, such as when the price crosses the SuperTrend line.
- It also features a built-in filter. It functions as an additional filter, excluding countertrend trades.
- It is highly adaptable, allowing traders to customize the multiplier and the ATR period to modify the sensitivity to market shifts.
- The interface is compact, ensuring minimal overlap with other elements on the chart, enhancing visibility and clarity.
Limitations of the SuperTrend Indicator
Now let’s review the drawbacks of the indicator.
- The tool’s dependence on trends can result in poor performance in a flat market, leading to false signals.
- The indicator may generate signals with a delay, as it is based on average values.
- The sensitivity to settings can be a source of inconsistencies, as an incorrect choice of a period or a multiplier can lead to errors in analysis.
- It may give false signals, particularly in volatile markets where sudden fluctuations can result in false trend changes.
- The tool displays only the trend direction and does not offer insight into the magnitude of price movements.
- It does not display overbought and oversold zones. Unlike oscillators, the supertrend indicator does not determine market extremes, making it difficult to ascertain the duration of a trend. As a result, this increases the risk of entering a trade at the very end of a trend.
- It does not take into account fundamental factors, considering solely price changes.
- It often requires other indicators to filter false signals and enhance accuracy.
- Its adaptability is limited, even with optimized settings, which may not perform well in rapidly changing market conditions.
- The indicator is unavailable on MetaTrader 4 and MetaTrader 5 trading platforms by default.
These drawbacks underscore that the SuperTrend indicator is best implemented as a component of a sophisticated trading system rather than as the sole instrument for decision-making.
How to use SuperTrend Indicator
The indicator is user-friendly and easy to use. When the indicator displays a green line, it suggests an upward trend. Consequently, it may be advantageous to consider buying the trading instrument. Conversely, if the indicator draws a red line, it signals a downward trend.
The primary signal is generated during a trend reversal. A trend reversal is confirmed when the candlestick closes above or below the indicator line. At this juncture, the indicator line’s color changes.
Subsequent signals emerge as the price tests the super trend line during corrections. The key condition is that the candlestick should not close beyond the line, thereby maintaining the trend. Notably, the indicator line offers a strong support or resistance level, depending on the prevailing trend.
When a bearish or bullish signal appears, a trader should open a trade immediately, placing a stop-loss order at the most recent low if a downtrend reverses to the upside or at the most recent high if the uptrend reverses.
Notably, additional trading prospects emerge during corrections to the indicator line. The price may not reach the bands immediately, so a trade is opened at a slight distance from the indicator line. In the above example, buy and sell signals are marked with blue arrows.
It is better to avoid entering the market on the news. After significant reports, the price may fluctuate widely, creating more favorable entry points. At the same time, a trade may result in unintended losses during important news releases.
There are three options for closing a position. The price can trigger stop-loss or take-profit orders, or you can close your trade manually in case of a trend reversal.
You can set a take-profit order near a price high or low, at a strong resistance or support level, at a distance greater than the stop distance by 2–3 times, or lock in profits after the opposite signal appears.
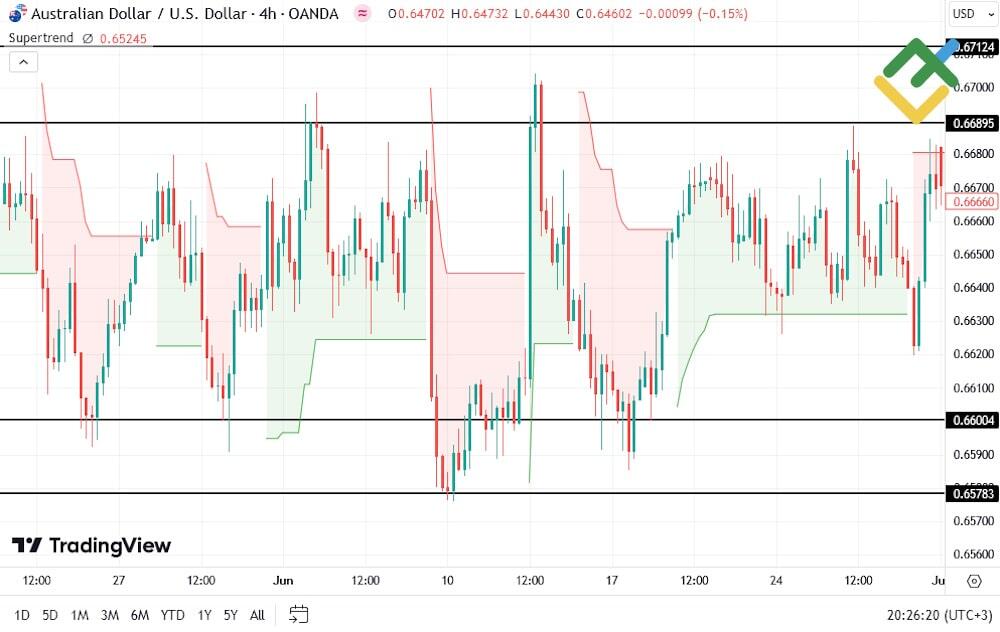
The SuperTrend indicator is most effective in trending markets. As the illustration below demonstrates, the SuperTrend indicator should be used with caution in flat markets.
On the 4-hour chart, the AUDUSD pair is moving sideways in a flat market. The price has formed the upper boundary at 0.6712–0.6689 and the lower boundary at 0.6600–0.6578. The pair has been rebounding from the upper and lower boundaries. As a result, the Supertrend indicator has generated a lot of false signals.
To avoid this pitfall, use other technical analysis tools along with the Supertrend indicator, such as oscillators, moving averages, or the same SuperTrend on a higher time frame.
Best Timeframe to Use the SuperTrend Indicator
Olivier Seban did not propose a concrete time frame for the SuperTrend indicator. This versatile tool can be applied to different time frames and markets. However, its efficiency increases with higher time frames. The indicator filters out market noise and gives more reliable signals on a 15-minute time frame and higher.
Traders commonly employ the indicator on daily charts, as they facilitate the identification of predominant trends. On such charts, the trend is usually clearly visible and easy to analyze.
When selecting a time frame, consider the asset’s volatility and adjust the indicator settings to align with your trading strategy. Backtesting your strategy on different time frames will help you determine the optimal parameters.
An Example of Using the SuperTrend Indicator
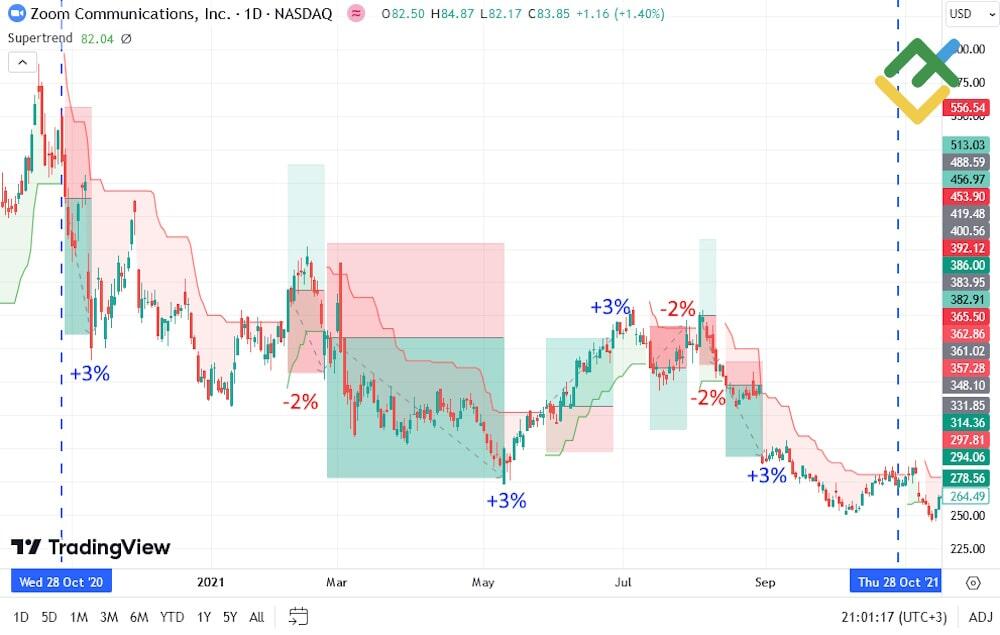
Let’s examine the use of the Supertrend indicator for trading Zoom stocks (#ZM) conducted between October 28, 2020 and October 28, 2021.
- A position is opened when the trend reverses;
- A stop-loss order is placed behind the previous high/low;
- A take-profit order is set at a distance greater than the stop distance by 1.5 times;
- Build-up of positions is not applied;
- Commissions and slippages are disregarded;
- Period = 10;
- Multiplier = 3;
- Risk per transaction = 2% of the deposit amount;
- Compound interest is not taken into account.
As illustrated in the above chart, there are seven trades, each yielding or erasing a percentage of the deposit amount. The final return was 6%.
While the earnings may seem modest, the approach was straightforward and uncomplicated. The trades were opened immediately following a trend reversal. A build-up of positions was not utilized, and a single trading instrument was used.
To avoid false signals, it is best to use the SuperTrend indicator with other technical indicators to confirm and better understand the market situation.
It is recommended to trade multiple assets to improve performance, and you can increase the reward/risk ratio by opening positions at key levels of the indicator, as well as monitoring news.
Try to install the indicator and try it on a demo account on the MetaTrader trading platform, and then add other technical indicators to see how your trading results may change.
Get access to a demo account on an easy-to-use Forex platform without registration
SuperTrend Indicator for Intraday Trading
Although most traders use SuperTrend on higher H4 or D1 time frames, it is an indicator for day trading. Let’s consider several strategies that have proven effective when using the SuperTrend indicator on M5 to M15 time frames.
Trading Strategy 1: Breakout
Let’s explore the simplest interpretation of the indicator patterns based on a breakout. A breakout occurs when an asset’s price breaks through a key level, triggering a trend reversal.
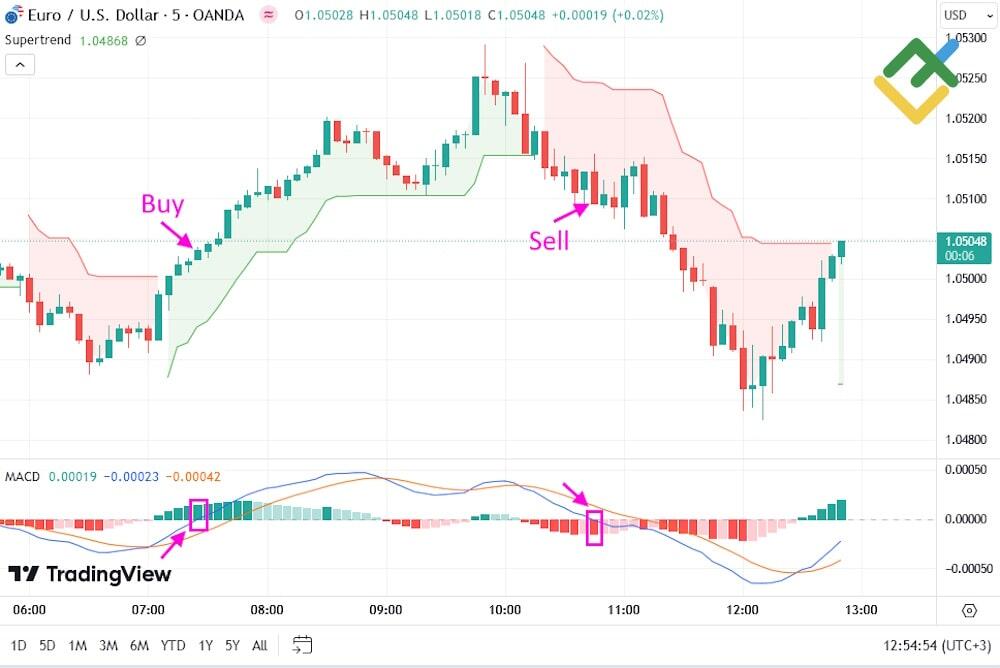
Setup: use the 5-minute or 15-minute time frames. The bearish or bullish trend can be determined by the color of the line.
Opening a trade:
- When SuperTrend changes direction, consider opening a position in the direction of the new trend.
- Confirm the entry point. You can use various momentum indicators such as Momentum, the RSI, MACD, the commodity channel index (CCI), and others.
Closing a trade:
- Place take-profit orders at key highs/lows.
- Use a trailing stop.
- Close a position when the indicator line changes direction.
Trading Strategy 2: Pullback
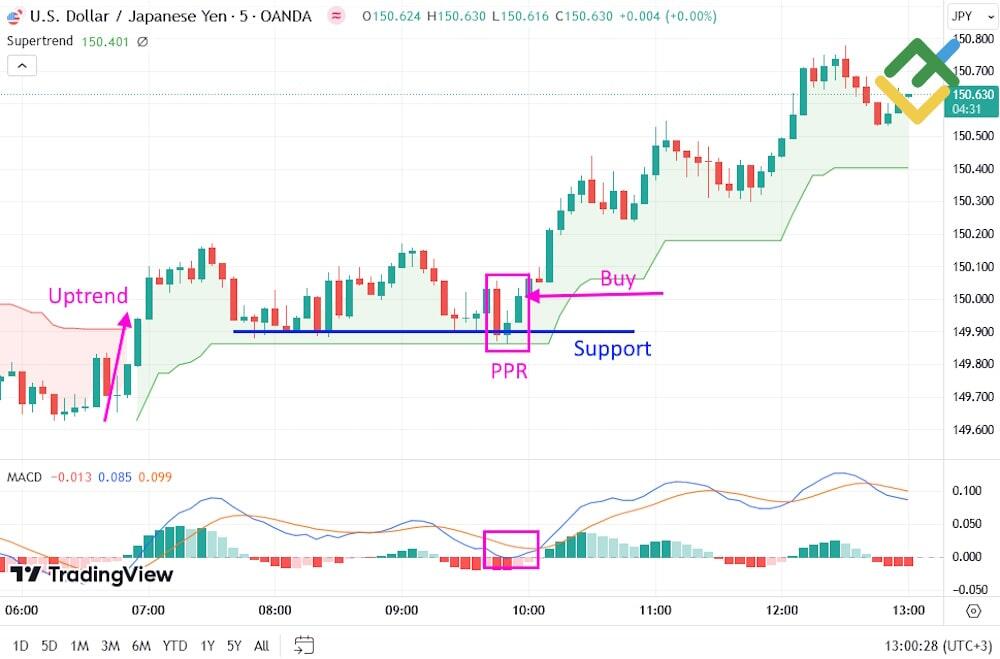
Identify the trend and wait for a pullback. Look for signals during a correction within the trend.
Setup: switch to a 5-minute or 15-minute time frame. Determine the trend with SuperTrend.
Opening a trade:
- Pinpoint key support and resistance levels.
- Wait for the price to correct to the key levels.
- Look for a candlestick pattern near the key level or use other indicators such as MACD, Stochastic, the RSI, etc.
Closing a trade:
- Set a take-profit order at key levels identified on a higher time frame.
- Use a trailing stop.
- Close positions on oscillator signals when the price hits overbought/oversold areas.
Trading Strategy 3: Range Breakout
Although the SuperTrend indicator strategy is not designed for flat trading, its readings can be relied upon to confirm a true range breakout.
Setup: using technical analysis, determine the asset‘s trading range. Identify key levels. Switch to a 5-minute or 15-minute time frame.
Opening a trade:
- Mark the range boundaries. Make sure the price is moving sideways.
- Wait for a breakout. Do not open a trade immediately. Pay attention to the subsequent candlesticks: if they close above/below the key level of the range, the breakout may be true.
- Use the SuperTrend indicator to confirm the entry: if the subsequent candlesticks close beyond the key level after the breakout, and the indicator confirms the emerging trend, you can open a trade.
Closing a trade:
- Close your trade at the end of the trading day.
- Use a trailing stop.
- A take-profit level is determined by recent price fluctuations or the width of the trading range.
Trading Strategy 4: Reversal
In the market, the price often grows impulsively and then reverses, entering a correction phase. In such cases, it is essential to monitor significant price divergences from the SuperTrend line closely. In other words, when the price deviates significantly from the indicator line, it may signal a reversal, suggesting that the price may start moving against the prevailing trend.
Setup: Watch for signs of a waning trend or strong deviation from the main trend. Look for candlestick patterns that may indicate a potential reversal.
Opening a trade:
- When the price drifts too far from the SuperTrend line, look for a Price Action pattern below or above the closing price, depending on the prevailing trend.
- To confirm the signal, oscillators should indicate an overbought or oversold market condition. Divergence will be the strongest signal.
Closing a trade:
- Set your profit targets based on the Supertrend line. This line is a strong level from which an impulse may extend.
- Place a stop-loss order close to the entry point to mitigate risks if the trend does not reverse.
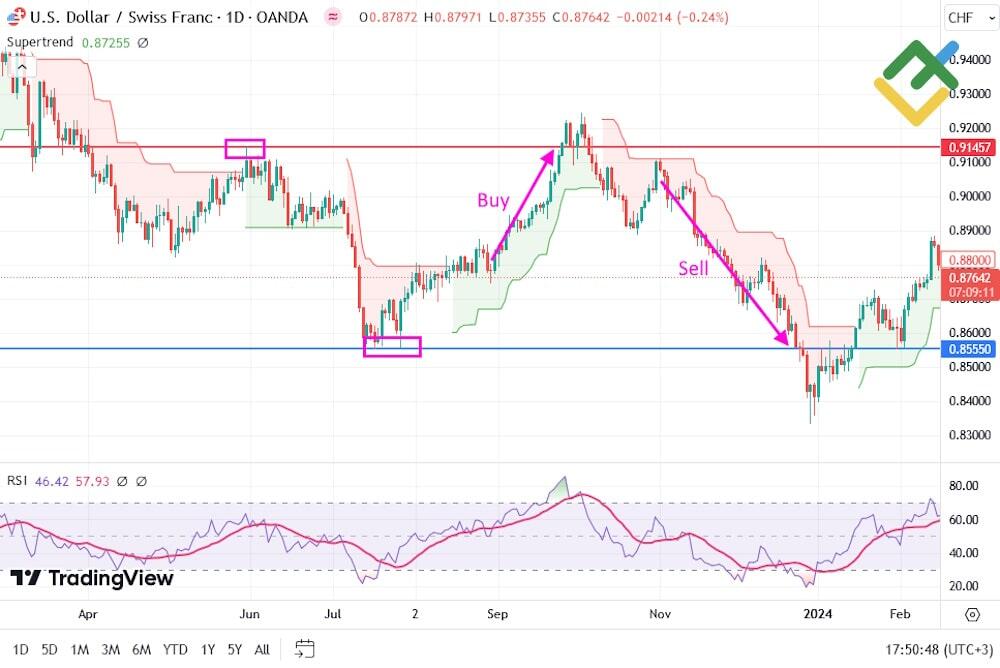
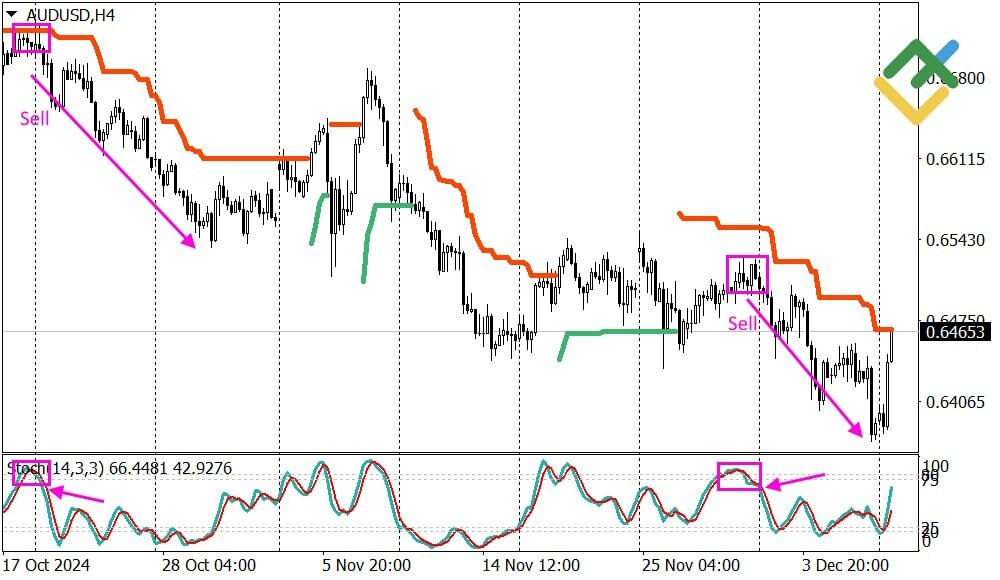
In the example above, price deviations are indicated by pink arrows. In the second case, we can observe a significant price deviation, and the RSI indicator is located in the overbought area marked by a pink rectangle on the chart. The entry point is marked by a pink dotted rectangle. A trade was opened using an Inside bar (IB), a Price Action pattern. Once the price reached the SuperTrend line, the trade was closed in a blue rectangle.
Long-Term Strategies with SuperTrend
Many professional traders use the SuperTrend indicator on various time frames, from H4 to W1, to identify the primary trend. This approach enables them to conduct long-term trades.
This approach helps to filter out market noise and minimize the impact of news on trend identification, which is especially pronounced on lower time frames. Let’s explore the key strategies employed in long-term trading.
Trend Following Strategy Using SuperTrend
This SuperTrend strategy is easy to use and suitable for experienced and novice traders. All that matters is to choose the right direction for opening a trade, and SuperTrend will give us a hand with this. All that remains is to look for entry points near strong support or resistance levels.
Setup: Use the SuperTrend indicator to track trends and identify medium—and long-term patterns on the H4–W1 time frames.
Opening a trade:
- Identify the trend using the SuperTrend indicator.
- Determine the key support and resistance levels.
- Wait for the price to correct to these levels or the SuperTrend line.
- Look for the signal and confirm it with a Price Action pattern or with other indicators: Moving Averages, the RSI, the Stochastic oscillator, and others.
Closing a trade:
- Place a take-profit at the support/resistance level.
- Close the trade if the SuperTrend line’s direction changes.
- Use a trailing stop if necessary.
As illustrated above, support and resistance levels are marked by blue lines on the price chart. Once the price reaches these levels, Price Action signals are generated, confirming the trend direction. The SMA (14; 2) line on the RSI can give an additional signal. The MA should be above 50 for buying and below 50 for selling.
The screenshot below displays the levels where the trades can be closed. These levels are based on the previous key highs and lows.
SuperTrend Line Breakout for Swing Trading
You can catch breakouts and generate profits with this swing trading strategy using SuperTrend. As soon as the trend reverses, open a trade in the direction of a new impulse. Swing trading involves keeping positions open from a few days to several weeks.
Setup: use other technical indicators to confirm market entry signals on the H4–W1 time frames.
Opening a trade:
- Wait for the price to break through the SuperTrend line. The line should change its color.
- Use momentum and volume indicators to confirm the breakout.
- Open a trade following the emerging trend. In this strategy, a stop-loss order can be placed a few pips below or above the indicator line.
Closing a trade:
- Set a take-profit order at the most recent high/low.
- Use key support/resistance levels for locking in profits.
- In case of strong trend movements, it is better to use a trailing stop.
SuperTrend True Breakout of Flat Range
As you know, the SuperTrend indicator is mainly used for determining the trend, and it does not perform during range-bound market circumstances. So, how to turn this disadvantage into an advantage? You can use SuperTrend to determine the true breakouts of a trading range, which can be a profitable strategy.
Setup: plot SuperTrend to H4–W1 charts and look for long-term consolidation periods. The longer the consolidation lasts, the stronger the subsequent movement will be when the price breaks out of the range. In this strategy, SuperTrend confirms that the range breakout is true.
Opening a trade:
- Mark the range boundaries.
- If the indicator line goes above the upper boundary, open a buy trade.
- If the indicator line falls below the sideways channel, open a sell trade.
Closing a trade:
- Close the trade at the previous key extremum.
- Use Reward/Risk ratio = 3/1 to get more profits.
- When the SuperTrend line changes its color, move the trade to a breakeven point. You can take profits partially.
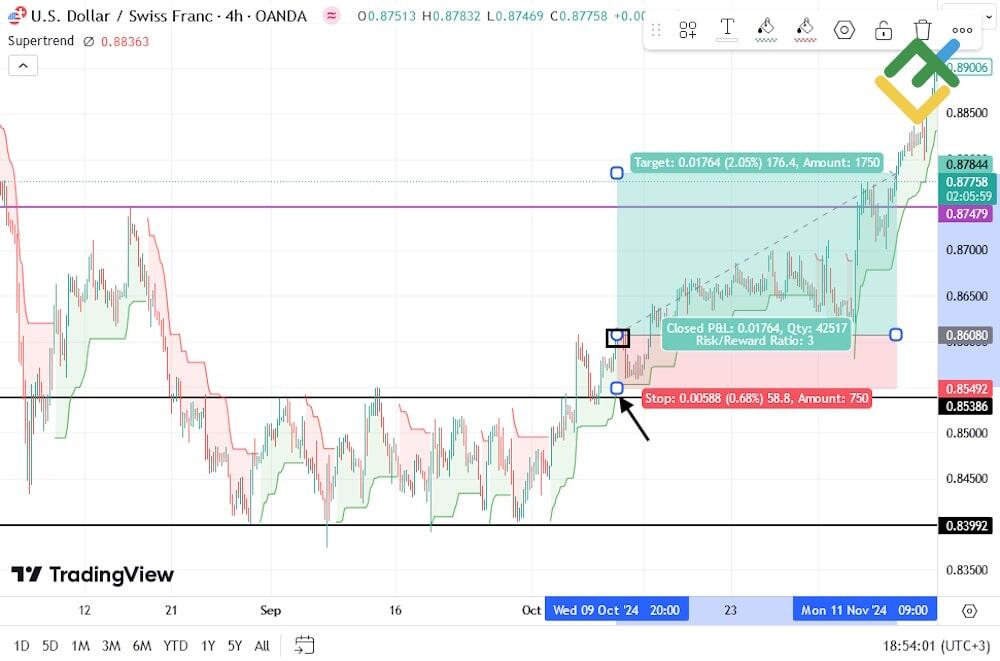
As illustrated above, the USD/CHF pair is trading sideways. Two black horizontal lines mark the consolidation boundaries. The black arrow indicates the point at which the SuperTrend line has breached the flat range, and the black square marks the entry point.
Combining SuperTrend with Other Indicators
Using the SuperTrend as a standalone indicator is insufficient to build a profitable trading system. You can significantly improve your trading results if you use other technical analysis tools. They will provide additional entry points, as well as filter out false signals.
SuperTrend and Moving Average
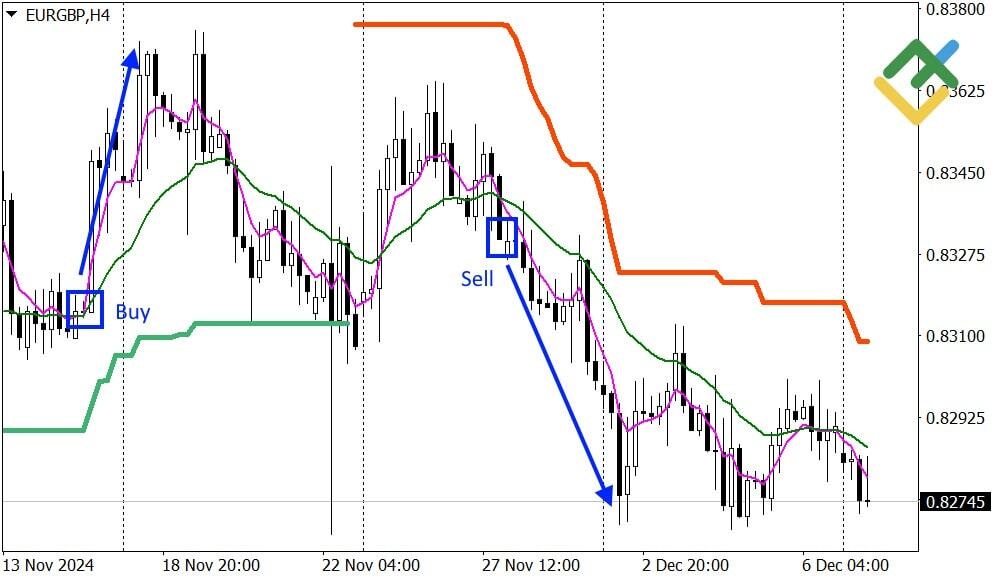
The most popular combination is SuperTrend and moving averages. MAs can be either simple (SMA) or exponential (EMA). Let’s consider such a combination in the example of two EMAs with periods of 5 and 20.
Description:
Setup: Add the SuperTrend indicator to the chart. Then, add an EMA (moving average) with a period of 5 and another EMA with a period of 20. This strategy works on any time frame.
Opening a trade:
- Wait for a trend reversal to occur.
- You should wait for the EMA5 to cross the slower EMA20.
- Open the trade and place a stop-loss order at the most recent high/low.
Closing a trade:
- Close your trade once the price reaches the profit target set at a distance exceeding the distance to your stop-loss order by at least twice.
- Place a take-profit order at the swing high/low or a strong support/resistance level.
- Use a trailing stop.
In this strategy, the EMA acts as a confirmation filter, which often offers a more favorable reward-to-risk ratio compared to entering immediately after the SuperTrend line changes color. The screenshot above shows the SuperTrend MT4 indicator.
SuperTrend and Stochastic Oscillator
An oscillator can serve as an additional indicator. One particularly effective option is the stochastic oscillator with standard parameters. Traders use this indicator to eliminate false signals, thereby facilitating more accurate market entries in accordance with the trend.
Description:
Setup: Apply the SuperTrend with standard parameters to any time frame. Add the stochastic oscillator with standard settings to the chart. The strategy implies opening trades in the direction of the trend during corrections, while the stochastic points to an overbought or oversold market condition.
Opening a trade:
- You need to wait for the SuperTrend line to change color.
- Wait for the price to start a correction and for the stochastic to enter the overbought or oversold zone.
- Wait for the stochastic lines to move out of the overbought/oversold zone.
- Open a trade in the direction of the trend.
Closing a trade:
- Use a Reward/Risk ratio > 2 to close your trade.
- Place a take-profit order at a strong support level.
- Use a trailing stop.
- Exit the market when the divergence between the price and the stochastic emerges.
In this strategy, the stochastic oscillator shows an imbalance in the market at the moment of the end of the corrective movement against the prevailing trend. As a rule, such moments are followed by a strong movement in the direction of the trend.
SuperTrend and MTF SuperTrend
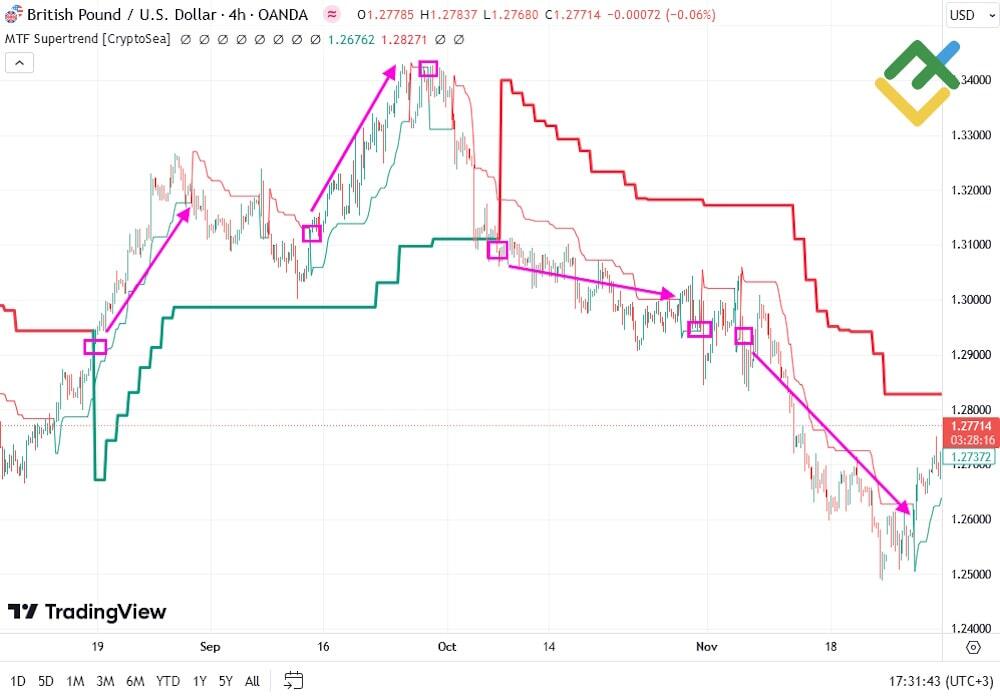
When exploring a super trend strategy involving the combination of indicators with SuperTrend, it is essential to mention the modification of this indicator, known as MTF SuperTrend. MTF stands for Multi Time Frame, indicating the ability to install the MTF SuperTrend auxiliary indicator and use it to analyze trends on other time frames, particularly higher ones.
A trend on a higher time frame generally takes priority over a trend on a lower time frame. By combining these indicators, traders can make more informed decisions and execute trades that align with the predominant trend.
Description:
Setup: add the MTF SuperTrend indicator to the chart. Plot the MTF indicator to a higher time frame. For example, if you trade on a H4 time frame, you should apply the MTF indicator to the D1 time frame.
Opening a trade:
- Wait for a trend reversal on a higher time frame.
- The MTF SuperTrend indicator line should change its color.
- Open a trade if the SuperTrend indicator also changes its color on a lower time frame.
- If the SuperTrend contradicts the MTF SuperTrend, wait for the base indicator to change color to the identical color. It is necessary that the two indicators indicate the same direction for trading.
- Place a stop-loss order behind the line of the base SuperTrend.
Closing a trade:
- Close the position if the underlying SuperTrend changes direction.
- Set a take-profit at a distance 2 or 3 times greater than your stop-loss distance.
- Use a trailing stop.
The system is straightforward and involves following a trend on a higher time frame. If the MTF indicates a specific trend, and the trend is opposite on your main time frame, then wait for it to change to the same trend on the higher time frame. This approach allows you to open multiple trades using the MTF as a filter.
Conclusion
SuperTrend is a trend indicator known for its simplicity and accuracy. It has a limited number of settings, including the period and multiplier, which can be adjusted to suit different currency pairs. The indicator’s curve clearly shows the current price movement direction, offering a strong dynamic support or resistance.
This technical indicator is versatile and can be applied to any time frame or a trading asset, though successful Forex traders use it on an H4 or higher time frame.
There are several trading techniques, which are categorized into intraday and medium-term. To achieve optimal trading results and mitigate losses, add momentum indicators to your system. These indicators can serve as filters or generate additional entry points.
The SuperTrend signals are the most profitable when a trend changes or the price corrects to the SuperTrend line.
SuperTrend Indicator FAQs
SuperTrend is a good trend indicator, which clearly indicates the main direction of a trading instrument’s price, adjusting to volatility. In addition, it shows the trend boundary, which serves as a strong dynamic level.
The default period value is 10, and the multiplier is 3. It is generally advisable to avoid using multiplier values below 1 and above 4. The optimal range for this parameter is typically between 2.0 and 3.5, although this can vary based on market conditions.
There is no perfect setup. Everything depends on the specific trading instrument and market conditions. However, the optimal settings are considered to be 10;3.
If you use SuperTrend on the D1 chart with standard settings, you can achieve a 6%–10% return on a yearly basis. If you add momentum indicators to SuperTrend, you can increase your performance by 2–3 times.
It is recommended to use additional momentum indicators such as the RSI, Stochastic, MACD, CCI and similar indicators together with SuperTrend to avoid false signals. They can help set stop-loss orders properly and provide more entry points according to the prevailing trend.
Yes, the super trend indicator can be used for scalping, but some limitations exist. It is widely used by scalpers because of its simplicity and clarity. However, to effectively use SuperTrend for scalping, you need to consider volatility and choose the right settings.
SuperTrend relies on the Average True Range (ATR) to generate its signals. Utilizing a multiplier and the highest or lowest price for the specified period, it plots the line. The indicator first assesses volatility and then extrema, subsequently informing about the dominant trend and key levels.
This strategy implies using the SuperTrend indicator on the 1-minute time frame (M1) to determine when to open and close trades. It is particularly well-suited for scalpers and day traders, as it enables them to respond swiftly to price fluctuations.
One method is to identify the trend using SuperTrend and then look for an entry point on a correction using the RSI. When the RSI reaches an overbought or oversold area during a correction phase, it will signal the optimal time to open a position in the early stages of a trend.
The content of this article reflects the author’s opinion and does not necessarily reflect the official position of LiteFinance. The material published on this page is provided for informational purposes only and should not be considered as the provision of investment advice for the purposes of Directive 2004/39/EC.
{{value}} ( {{count}} {{title}} )
This post is originally published on LITEFINANCE.

