
Dear readers,
I’ve prepared a short-term forecast for Bitcoin, Ripple, and Ethereum based on the Elliott wave analysis.
The article covers the following subjects:
Major Takeaways
- BTCUSD: The price may decline in a bearish correction. Consider opening short positions from the current level with Take Profit at 92,820.00.
- XRPUSD: A sideways correction is likely unfolding. Consider short positions with Take Profit at 2.160.
- ETHUSD: A bearish correction 4 has presumably started. Consider selling from the current level with Take Profit at 3,683.00.
Elliott Wave Analysis for Bitcoin
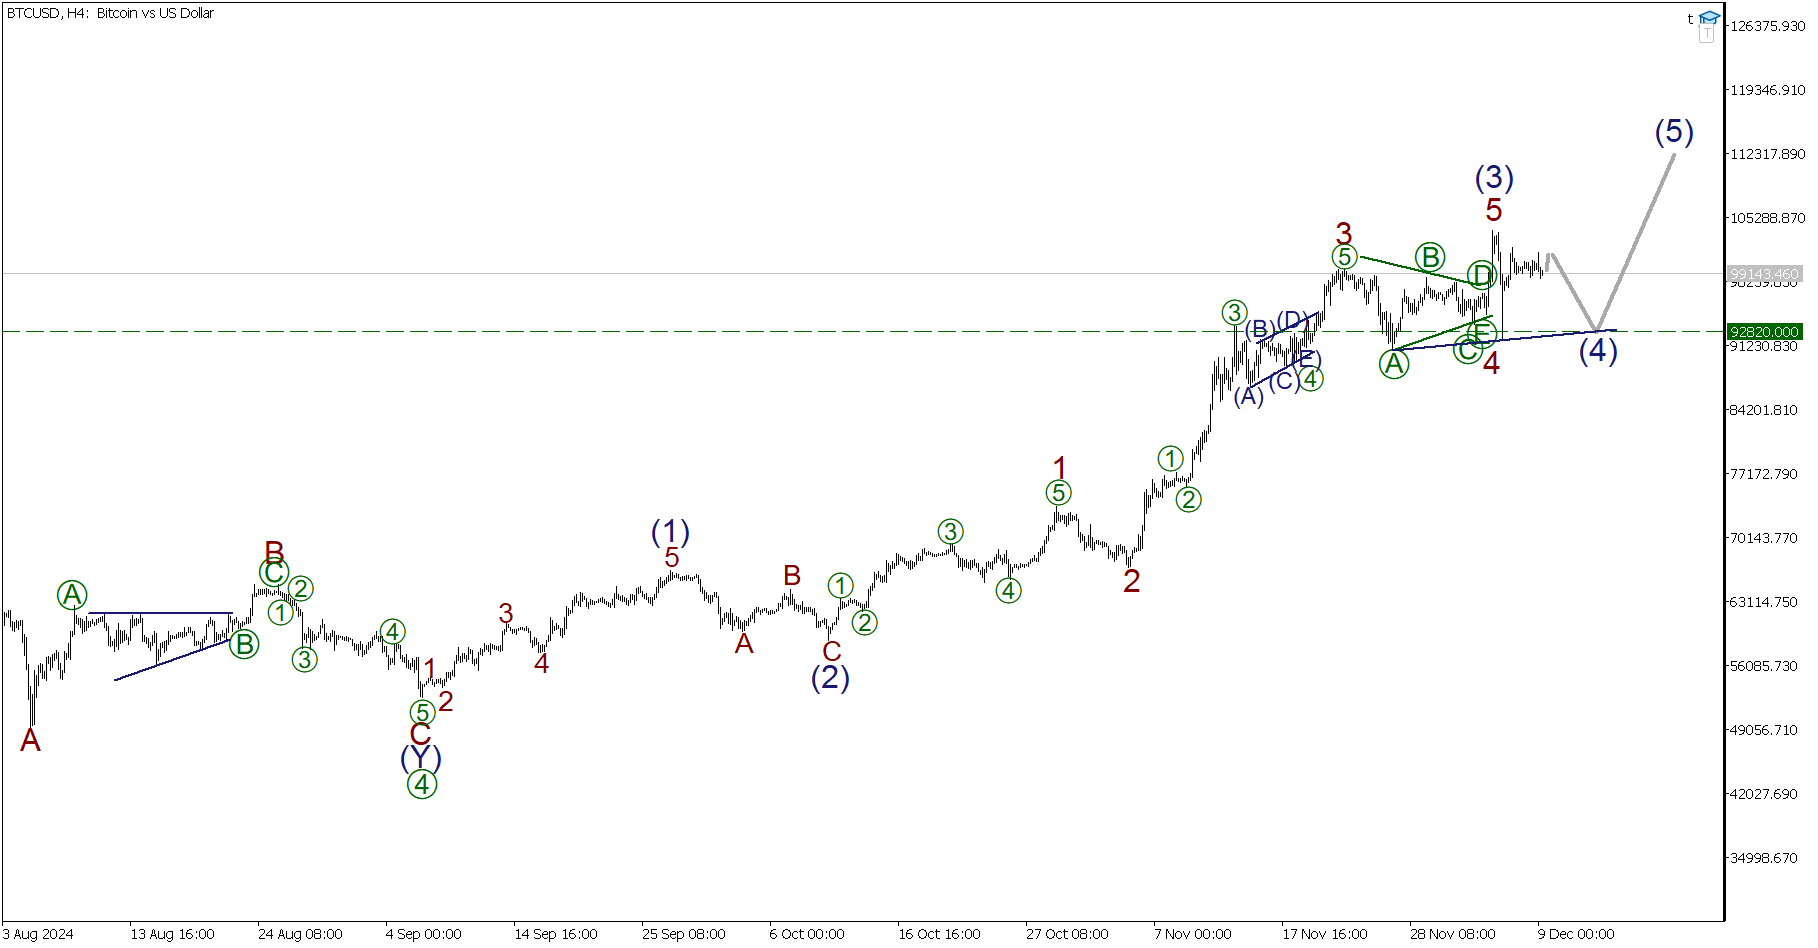
BTCUSD‘s chart shows that a correction [4] has presumably formed as a double zigzag (W)-(X)-(Y). A new bullish wave is developing in the last segment of the chart, potentially as an impulse (1)-(2)-(3)-(4)-(5). Impulse (1) and correction (2) have formed. An impulse wave (3) also looks completed. The price is currently falling in correction (4), which will likely become a zigzag. A correction is presumably nearing completion as part of the potential zigzag, and the price may decline soon in the final impulse wave to a level of 92,820.00, located on the support line.
Trading Plan for BTCUSD for Today:
Sell 99,143.46, Take profit: 92,820.00
Elliott Wave Analysis for Ripple
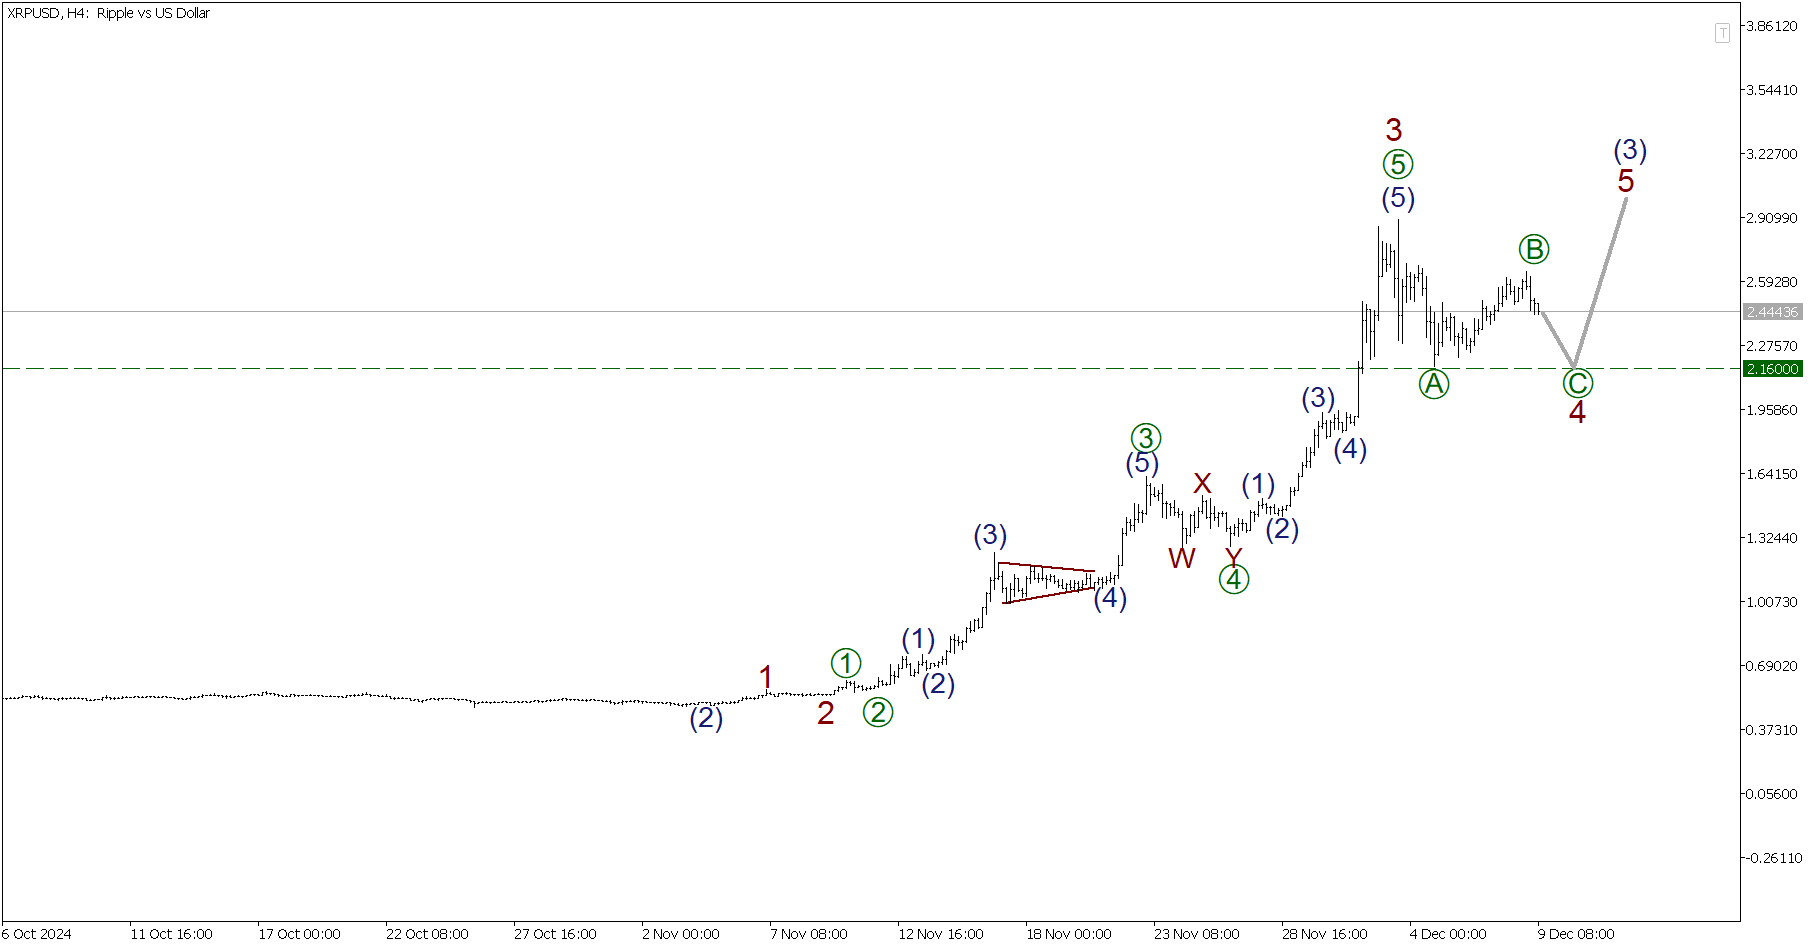
The XRPUSD chart shows a bullish impulse (1)-(2)-(3)-(4)-(5). Its powerful impulse subwave (3) is presumably unfolding, with subwaves 1-2-3 potentially completed as its parts. The price has likely started declining in correction 4, which is presumably developing as flat [A]-[B]-[C]. Its first two waves, [A] and [B], have already formed, so the asset is projected to fall soon in the final impulse subwave [C] to a low of 2.160.
Trading Plan for XRPUSD for Today:
Sell 2.444, Take profit: 2.160
Elliott Wave Analysis for Ethereum
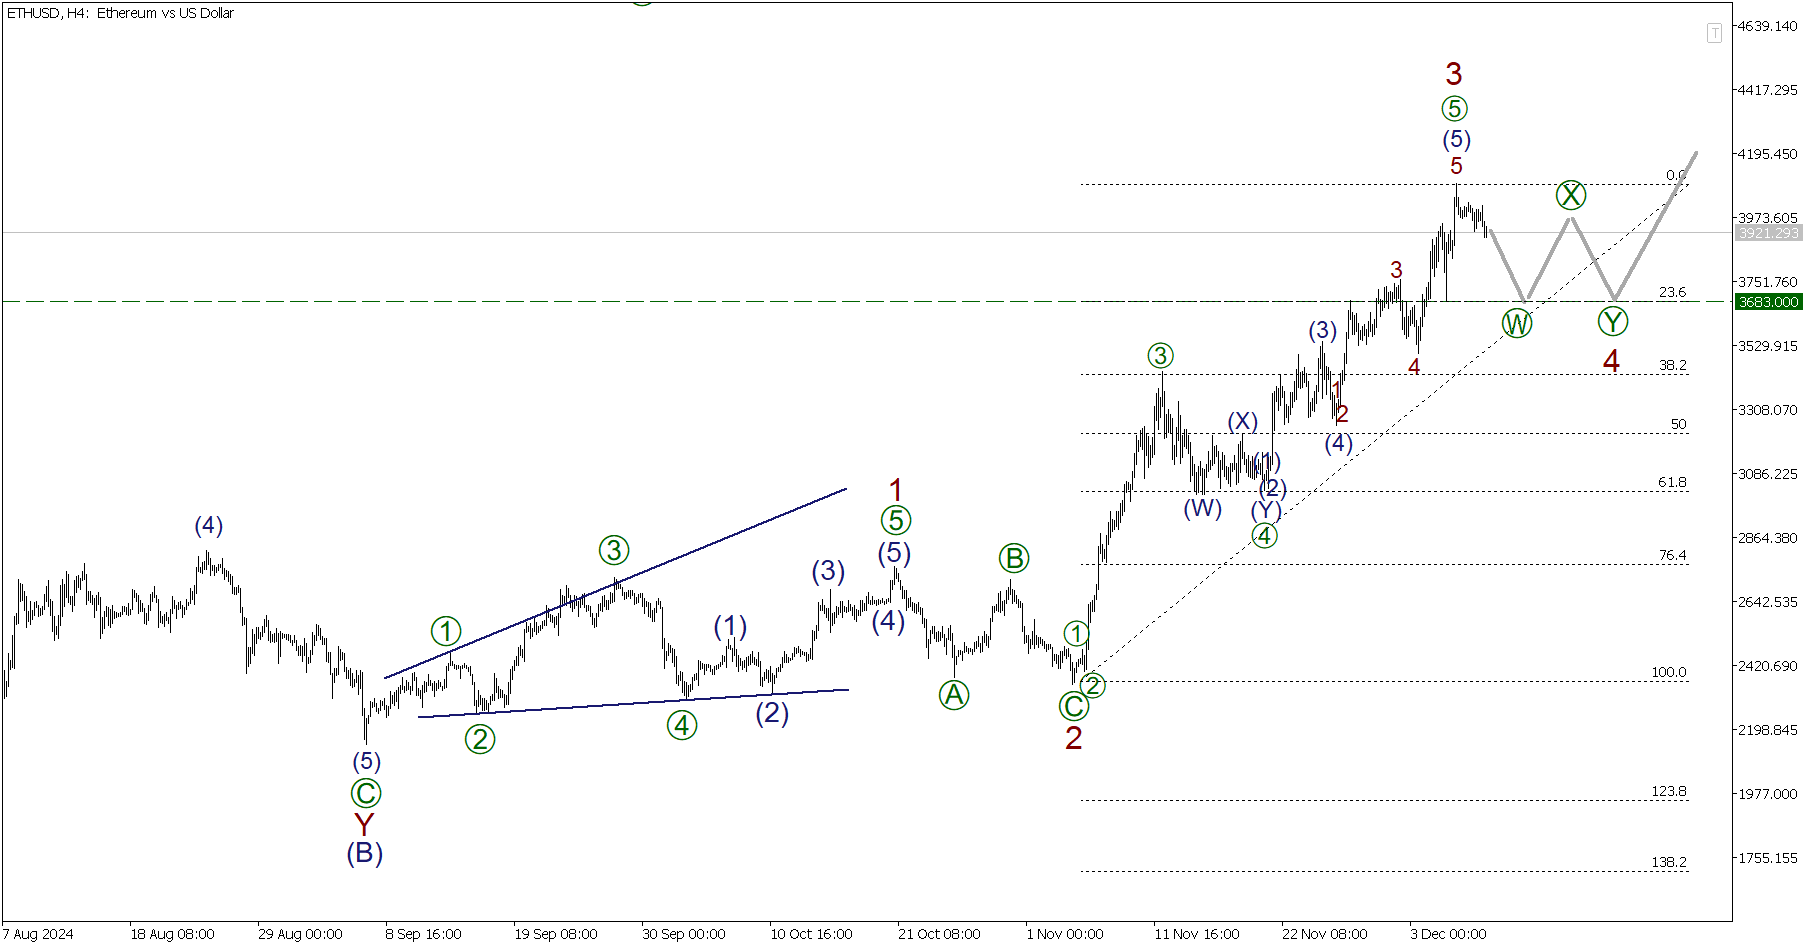
Ethereum has presumably formed a complex correction (B) as a double zigzag W-X-Y. Wave (C) is currently developing as an impulse 1-2-3-4-5. Its subwaves 1 and 2 – a leading diagonal and a zigzag – have formed. An impulse wave 3 also appears to be completed, and the first part of correction 4 is unfolding at the moment. Correction 4 will likely form as a double zigzag [W]-[X]-[Y], as shown in the chart. Its size may reach 23.6% of impulse 3 as per Fibonacci lines. The probability of reaching that ratio is high. The first actionary wave [W] may end at 3,683.00.
Trading Plan for ETHUSD for Today:
Sell 3,921.29, Take profit: 3,683.00
P.S. Did you like my article? Share it in social networks: it will be the best “thank you” 🙂
Ask me questions and comment below. I’ll be glad to answer your questions and give necessary explanations.
Useful links:
- I recommend trying to trade with a reliable broker here. The system allows you to trade by yourself or copy successful traders from all across the globe.
- Use my promo code BLOG for getting deposit bonus 50% on LiteFinance platform. Just enter this code in the appropriate field while depositing your trading account.
- Telegram chat for traders: https://t.me/litefinancebrokerchat. We are sharing the signals and trading experience.
- Telegram channel with high-quality analytics, Forex reviews, training articles, and other useful things for traders https://t.me/litefinance
Price chart of BTCUSD in real time mode

The content of this article reflects the author’s opinion and does not necessarily reflect the official position of LiteFinance. The material published on this page is provided for informational purposes only and should not be considered as the provision of investment advice for the purposes of Directive 2004/39/EC.
{{value}} ( {{count}} {{title}} )
This post is originally published on LITEFINANCE.


