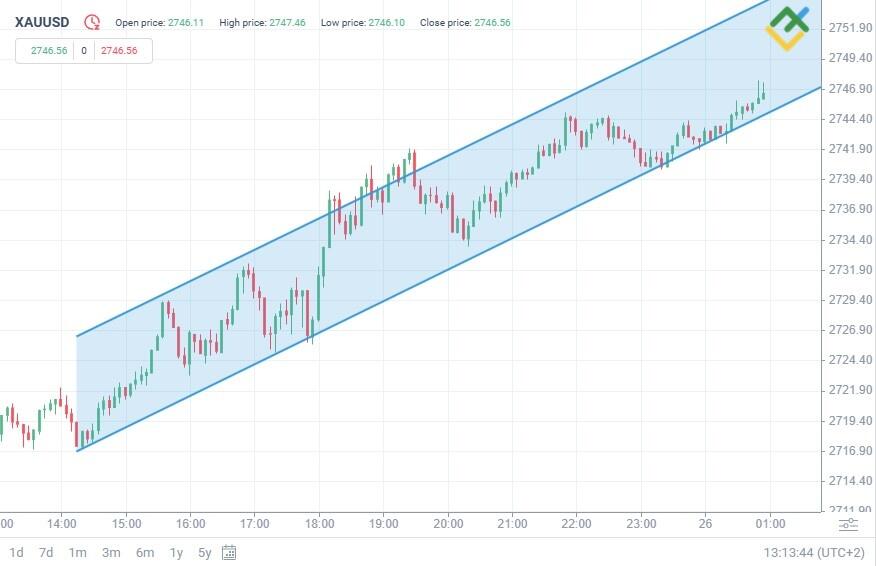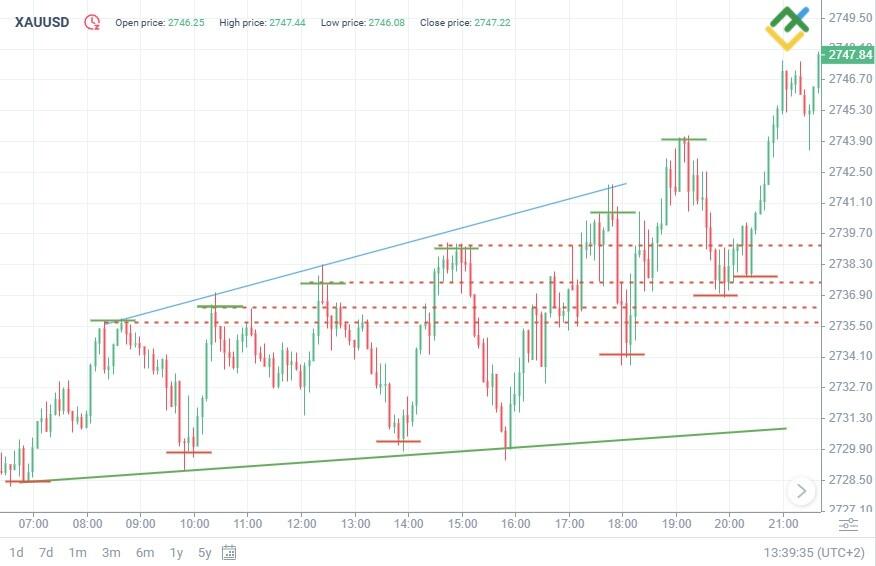
Understanding higher highs and lower lows is crucial for trend prediction in technical analysis and trading. These chart patterns help identify and use ongoing market movements in trading strategies.
This article will explain how to spot highs and lows in the world of trading, why they are key market indicators, and how to use them to improve your trading strategy.
The article covers the following subjects:
Key Takeaways
-
Higher Highs (HH) and Lower Lows (LL) help spot market trends.
-
Higher Lows (HL) signal a potential trend reversal to the upside when highs finish higher.
-
A Lower High concept (LH) indicates weakening buying pressure and a bearish trend.
-
LL, HH, LH, and HL patterns are used to spot entry and exit market points.
-
Fibonacci ratios serve to identify more accurately trend support and resistance.
-
Countertrend strategies help profit from short-term corrections but require some experience.
-
Timeframes are key in interpreting these patterns correctly.
-
To use these patterns more efficiently, you can combine them with RSI and MACD indicators.
Understanding Highs and Lows in Trading
Highs and lows are essential elements in technical analysis that identify the direction of market trends.
A high is a point at which the price has reached its local peak before correcting down. A low point is a point at which the price has hit its local trough before pulling back to the upside. These key levels help traders understand current market sentiment.
Using higher highs and lows helps identify a trend reversal or continuation pattern, which is particularly important while mapping out trading strategies. For instance, a series of higher lows indicates an upward trend, suggesting a good trading opportunity to open a long position. Analyzing these patterns allows making trading decisions and exploiting the current market situation.
Higher Highs (HH)
“Higher Highs represent a series of progressively higher prices where each new high is higher than the preceding high.”
This pattern is usually associated with higher lows and indicates an uptrend or a bullish market. The higher the price rises, the more determined traders and investors become to buy the asset, increasing buying pressure and driving the upward movement. A new higher high is a pronounced signal of bullish sentiment, confirming increased buying interest.
This pattern’s psychology is based on the growing confidence of market participants. Investors believe that the uptrend will continue and buy an asset, hoping to make profits, which further drives the asset’s growth. Concerningly, higher highs and higher lows continue forming.
Lower Lows (LL)
“Lower Lows represent a range of lower prices where each new low is even lower than the preceding low.”
Lower highs and lows often indicate a downtrend and a bearish market. This pattern signals a sustained price fall and growing selling pressure. Buying interest decreases, boosting bearish sentiment in the market.
This pattern clearly signals weakening demand, suggesting short positions or exiting long-term positions to minimize potential losses.
Higher Lows (HL)
“Higher Lows (HL) represent a pattern where each subsequent price low is higher than the previous low.”
This signals weakening selling pressure and growing odds of a market reversal to the upside. Higher lows and highs indicate increasing bullish sentiment: investors are poised to buy an asset on rising levels, additionally supporting a bullish market.
This pattern signals an increase in buying interest, a rise in trading volumes, and the market’s support. Volumes generally stabilize and show positive dynamics. The pattern often points to an upcoming uptrend, suggesting long positions.
Lower Highs (LH)
“Lower Highs (LH) represent a series of descending peaks, with each peak being lower than the previous high.”
The lower highs pattern suggests diminishing buying pressure and an eventual start of a bearish trend. Making lower highs and lows indicates a bearish market, which must be considered in trading strategies.
Decreasing volumes and support breakouts help spot the pattern on the chart, signaling weakening buying interest and declining trading activity.
How to Identify Higher Highs and Lower Lows on a Chart
We must carefully analyze the price chart to identify higher highs (HH) and lower lows (LL). These patterns are characterized by successive peaks and troughs: each successive high is higher than the previous one, and each successive low is lower than the previous low. They visualize clear levels of price movement, helping the trader better understand the current trend’s direction.
Using indicators such as trend lines simplifies recognizing these patterns further. For example, a trend line connecting higher lows confirms an upward movement, while a line connecting lower highs indicates the continuation of a downward trend. Trading volume analysis can also confirm price movements.
Patterns for identifying HH, LL, HL, and LH
Trendlines, ascending and descending symmetrical triangles, and price channels are instrumental in identifying higher highs (HH), lower lows (LL), higher lows (HL), and lower highs (LH) patterns.
For example, the ascending triangle pattern formation often accompanies a series of higher lows, while a descending triangle forms amid lower highs. Candlestick patterns like Hammer or Hanging Man help traders better understand market sentiment and confirm trading signals.
Indicators for identifying HH, LL, HL, and LH
Various indicators can be used to spot HH, LL, HL, and LH patterns. Trend lines are some of the most popular as they easily visualize highs and lows. Moving Averages smooth price movements and identify trends. RSI measures a trend’s strength, while MACD confirms potential reversals.
Significance of These Patterns in Market Trends
These patterns help traders thoroughly assess the current market situation and make informed decisions. Lower Highs (LH) and Higher Lows (HL) are key indicators that signal potential reversals or trend continuation. They help predict changes in direction and confirm the strength and sustainability of current market moves.
-
Lower Highs often precede bearish reversals or a downtrend’s continuation
-
Higher Lows Pattern generally signals a potential bullish reversal or the current uptrend’s strengthening.
These patterns play a crucial role in developing trading strategies, helping traders determine entry and exit points with greater accuracy. Using candlestick patterns helps better understand market sentiment and confirm trend directions, according to Timothy Sykes’ 7-step framework:
“By understanding candlestick patterns, traders gain a better sense of control over their decisions, making them invaluable in the dynamic environment of stock trading.”
Importance of Time Frames in Analyzing Lower Highs and Higher Lows
Lower highs and higher lows can appear differently across various time frames, giving traders more flexibility in their trend analysis. For example, a lower high in an uptrend may indicate a short-term reversal on a daily chart, while on a monthly chart, it may signal a significant bearish move.
A trader’s strategy will define the choice of a time frame:
-
Day traders use shorter time frames within a trading day, such as 1-minute or 5-minute candles, to capture quick market moves.
-
In swing trading, hourly or daily charts are used to identify and track short- and medium-term trends.
-
Longer-term investors use monthly or weekly charts to understand broader market directions and reduce market noise.
Using Higher Highs and Lower Lows in Trading Strategies
Using higher highs (HH) and lower lows (LL) is a powerful tool in developing trading strategies. These patterns help identify optimal entry and exit points and improve risk management. For example, identifying a higher low allows you to properly set a stop loss, helping to minimize potential losses. Similarly, recognizing a lower high can signal a good exit point, allowing a trader to exit the market immediately and avoid large losses.
Determining Entry and Exit Points
Higher highs (HH) and lower lows (LL) can be useful in identifying the best entry and exit points.
In an uptrend, traders look for a new series of higher price levels to determine the best time to enter a long position. For example, if a new low formed higher, it likely signals that an uptrend has begun.
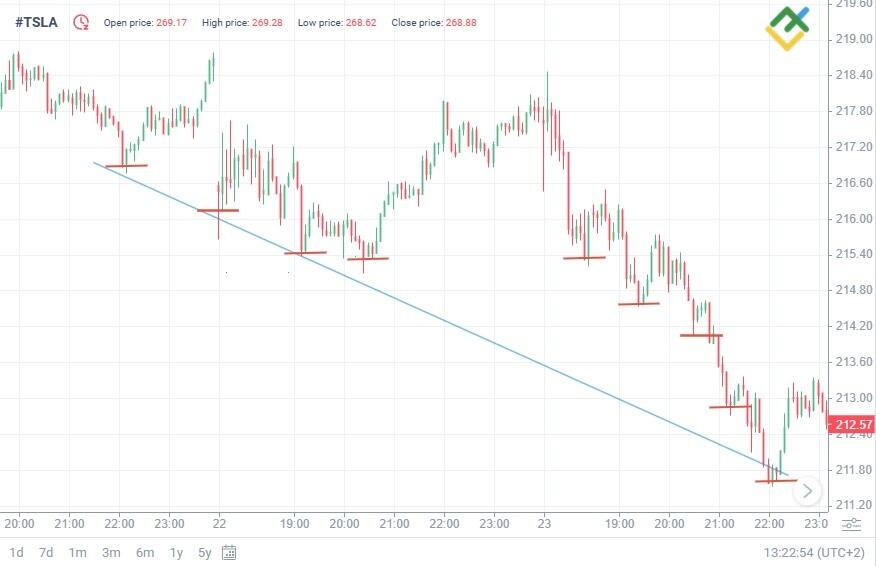
In a downtrend, when a lower high is formed after a short-term correction, a trader can enter a short position, expecting a further decline.
Let’s look at what the #TSLA stock price chart shows.
To increase the accuracy of your forecast, you should combine chart patterns with other technical indicators, such as moving averages, RSI, or MACD. These tools help confirm trends and provide more reliable signals for opening and closing trades.
Risk Management
Using high or low patterns in trading strategies can improve trading efficiency and risk management with the help of stop-loss and take-profit levels.
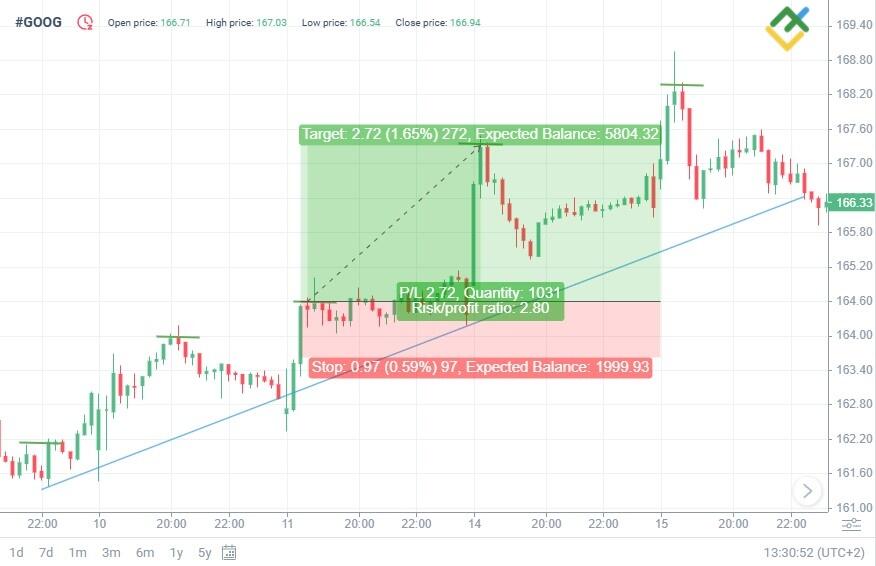
For example, in an uptrend, traders can place a stop loss below the recent higher low (HL) to bring the position to breakeven. If the uptrend continues, a take-profit order can be set above the latest higher high (HH) to lock in profits.
Let’s take the #GOOG chart as an example.
In a downtrend, a stop loss order is placed above the lower high (LH), and a take profit order is placed below the latest lower low (LL). This approach enhances capital protection and boosts trading performance.
Advanced Applications of Highs and Lows
Advanced applications of highs and lows involve combining these patterns with other technical analysis tools to determine market sentiment and predict possible reversals more accurately. Experienced traders can use these tools in complex trading systems and advanced strategies like breakout trading and countertrend strategies. These approaches allow you to adapt your strategy better to market conditions and increase its effectiveness.
Amazon and Apple stocks can be particularly suited for countertrend strategies due to their relatively high volatility.
Trading Breakouts and Reversals
The strategy of trading breakouts and reversals uses highs and lows to spot trend peaks and troughs. For example, a higher high (HH) breakout signals a new uptrend’s start, suggesting long positions.
Conversely, a breakout of a lower low (LL) indicates a possible continuation of the downtrend, suggesting a short position. These breakout points signal strong trend momentum. Higher lows and lower highs can reflect a potential trend change and may provide an opportunity to enter the market during a breakout or reversal.
Using Fibonacci Retracements
Fibonacci levels can be successfully combined with higher highs (HH), higher lows (HL), and lower lows (LL) to identify potential support and resistance levels. In an uptrend, traders often plot Fibonacci levels from the most recent higher low (HL) to a higher high (HH) to find optimal entry points for a long position.
In a downtrend, Fibonacci levels are plotted from a lower high (LH) to a lower low (LL) to identify where the market will pause before continuing downwards.
Countertrend Strategies
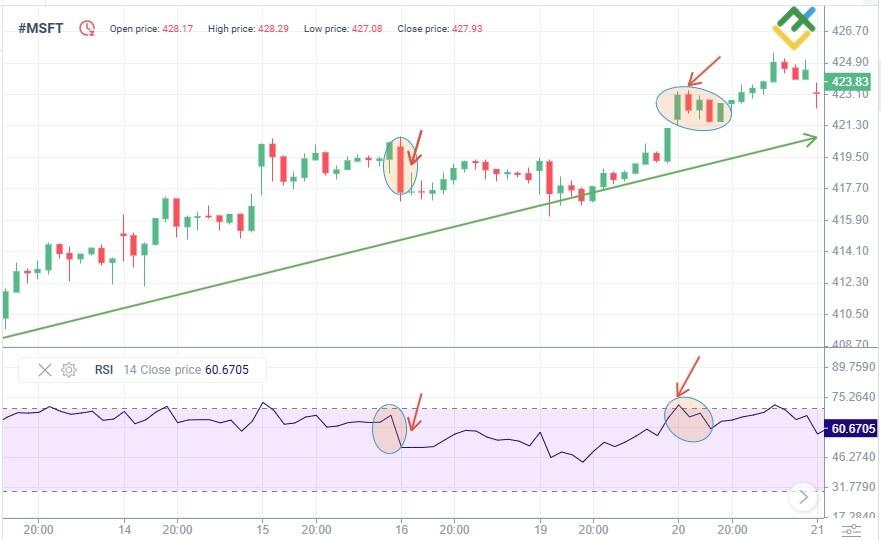
Countertrend strategies involve trading against the current trend to profit from short-term corrections. Traders use lower highs (LH) and higher lows (HL) to identify temporary reversals within a trend. For example, a lower high is a potential correction signal in an uptrend, suggesting a short-term sell trade. For example, take a look at the #MSFT stock chart.
Still, this approach carries certain risks: an attempt to trade against the main trend can often result in losses if the main trend continues.
The advantage of this strategy is the opportunity to generate profit even during a short market pullback. However, it is necessary to understand the market well, assess risks correctly, and use protective stop orders. Countertrend strategies are, therefore, often used by more experienced traders who can react quickly and use technical tools, such as the RSI indicator, to confirm possible reversal signals.
Conclusion
Highs and Lows are important elements of technical analysis that help traders identify market trends more accurately, spot entry and exit points, and boost their risk management efficiency. Using additional tools, such as Fibonacci levels and RSI indicators, allows you to increase the accuracy of your analysis, make more informed trading decisions, and minimize risks. Countertrend trading strategies can be effective during short-term reversals but demand extensive training and trading experience. Market success and trading performance rely on effective analysis and adapting strategies to current conditions.
Higher Highs and Lower Lows FAQs
A higher high pattern indicates a rising trading range and a strengthening uptrend, while a new lower low signals falling prices and the continuation of a bearish trend. After spotting these patterns, traders often open positions in the current price direction.
Lower highs indicate a bearish trend, while higher lows indicate a bullish trend. The formation of lower lows and lower highs on the chart confirms a continued bearish trend.
Equal lows indicate consistent support levels, while lower highs suggest weakening buying activity and a potential continuation of the bearish trend. A combination of a low and lower high confirms buying weakness.
Higher highs and higher lows are generally represented as a series of points, each higher than the preceding one. The formation of such patterns indicates a stable upward trend, suggesting long positions.
A downtrend with lower lows and lower highs indicates a sustained price decline and increasing bearish sentiment. This pattern reflects sellers’ control, with buyers unable to halt the drop. Consequently, the downtrend continues.
The content of this article reflects the author’s opinion and does not necessarily reflect the official position of LiteFinance. The material published on this page is provided for informational purposes only and should not be considered as the provision of investment advice for the purposes of Directive 2004/39/EC.
{{value}} ( {{count}} {{title}} )
This post is originally published on LITEFINANCE.

