
The advance/decline line (A/D) is a valuable technical indicator for analyzing the stock market. The A/D line indicator is used to analyze the overall stock market and indexes, enabling traders to ascertain the prevailing trend direction and gauge market breadth. This article examines how the advance/decline line can assist in evaluating the market situation.
It will also delineate the methodology for analyzing trend strength. A firm grasp of the operational principles and appropriate use of the A/D indicator can facilitate more informed trading decisions.
The article covers the following subjects:
Key Takeaways
|
Term |
Description |
|
The A/D Line indicator definition |
This market breadth indicator can signal significant market purchases or sales and reflects changes in the balance of orders placed by major market participants, used to show market sentiment and confirm price trends in major indexes. |
|
Market impact |
When the A/D line rises or falls, it can signal the influence of major players on overall market performance and gauge the strength of the trend. |
|
How to trade using the advance/decline line |
The line provides insight into the distribution of large volumes across a stock market index and indicates the ratio between buyers and sellers. |
|
Identification of pivot points using the advance/decline line |
The advance/decline line pinpoints periods of accumulation or distribution of stocks by large market participants on the chart and identifies support and resistance areas, from which one can open profitable trades. |
|
Features of the A/D line indicator |
Significant shifts in the A/D indicator may signal the emergence of new market trends, driven by the actions of major market participants at key points. |
|
Why the A/D line changes |
Changes in the A/D line can be caused by institutional traders, when they make high-volume trades. This affects the overall market trend. |
|
Trading strategies using the A/D line |
Analyzing the difference between the index and the line helps to find points where positions can be opened and closed. |
|
Pros and cons |
The A/D line provides an insightful snapshot of the overall market trend. However, it is essential to supplement it with additional indicators to gain a more comprehensive understanding of short-term market fluctuations. |
|
Time frames |
The advance/decline line reflects long-term market trends on higher time frames. On lower time frames, it displays small price changes. |
|
Rules for placing stop-loss orders |
It is important to monitor changes in the A/D line indicator to properly place stop-loss orders near key support and resistance levels. |
Definition and Understanding of the Advance/Decline Line
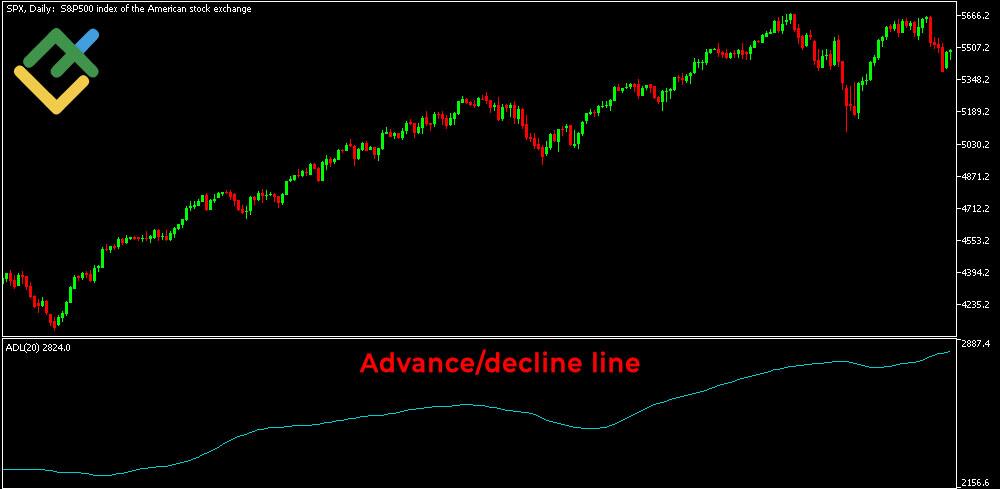
The advance/decline line is a technical indicator that plots the difference between the number of advancing stocks and declining stocks in an index on a daily basis, providing valuable data on the breadth of the market. This A/D line indicator assesses the overall market health and shows how widespread market movements are and whether stocks are participating in a trend. The A/D line is particularly useful when analyzing capitalization-weighted indices, such as the S&P 500, as it helps determine the strength of price movements and evaluate the stability of the trend.
History of the Advance/Decline Line
The Advance Decline Line was first introduced in the 1930s to perform research analysis of the New York Stock Exchange (NYSE). In the 1960s, Richard Russell made this indicator widely known by including it in his renowned “Dow Theory Letters.” Russell demonstrated how the A/D line helped determine the market’s strength and health and confirm existing trends. Since then, it has become a crucial technical analysis tool to assess market trends in various stock markets, including NASDAQ, FDAX, and others.
Formula and Calculation of the Advance/Decline Line
You can calculate the A/D line by following the steps described below.
1. Determine the number of ascending stocks and declining stocks on a daily basis.
2. Calculate Net Advances.
Use the formula:
Net Advances = Number of daily ascending stocks − Number of daily descending stocks
Here you should subtract the number of stocks that finished lower on the day from the number of stocks that finished higher on the day. The result shows the Net Advances, the difference between rising stocks and those that have dropped in value.
3. Write down the value of the previous day’s A/D line. It will be used to calculate the current indicator value.
4. Calculate the current A/D line value using the following formula:
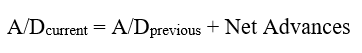
Here you should add the Net Advances to the Previous Advances.
5. Example:
If there are 450 ascending stocks and 350 declining stocks during the day, the net advances will be 100 (450-350). If the previous day’s A/D line value was 1,200, the new value will be: 1,200 + 100 = 1,300.
This calculation is done daily to track changes in the market trend. This cumulative calculation creates a line that represents the market breadth.
Practical Example
Suppose the following changes occurred in the S&P 500 Index over a five-day period:
|
Day |
Number of Advancing Stocks |
Number of Declining Stocks |
Net Advance |
A/D Line |
|
1 |
300 |
200 |
100 |
100 |
|
2 |
250 |
300 |
-50 |
50 |
|
3 |
350 |
150 |
200 |
250 |
|
4 |
400 |
100 |
300 |
550 |
|
5 |
200 |
300 |
-100 |
450 |
-
Day 1: 300 advancing stocks and 200 declining stocks, Net Advance = 100. Initial A/D Line value = 100.
-
Day 2: 250 advancing stocks and 300 declining stocks, Net Advance = -50. A/D Line value = 100 (previous) + (-50) = 50.
-
Day 3: 350 advancing stocks and 150 declining stocks, Net Advance = 200. A/D Line value = 50 (previous) + 200 = 250.
-
Day 4: 400 advancing stocks and 100 declining stocks, Net Advance = 300. A/D Line value = 250 (previous) + 300 = 550.
-
Day 5: 200 advancing stocks and 300 declining stocks, Net Advance = -100. A/D Line value = 550 (previous) + (-100) = 450.
This ADL calculation shows how the advance-decline line changes depending on the daily data on rising and falling stocks. Investors use this data to analyze market trends and identify possible points to open/close positions.
Platform where traders earn more

Trade on LiteFinance’s high-tech ECN platform and open an account so that beginner traders can copy you. Earn a commission for copy trading and boost your income.
Interpreting the Advance-Decline Line
The advance/decline line is used to show market sentiment, confirm trend strength, and assess market breadth. When the A/D line rises, this means that ascending stocks prevail, confirming the bullish trend. If the line is declining, this points to bearish sentiment or a weakening uptrend.
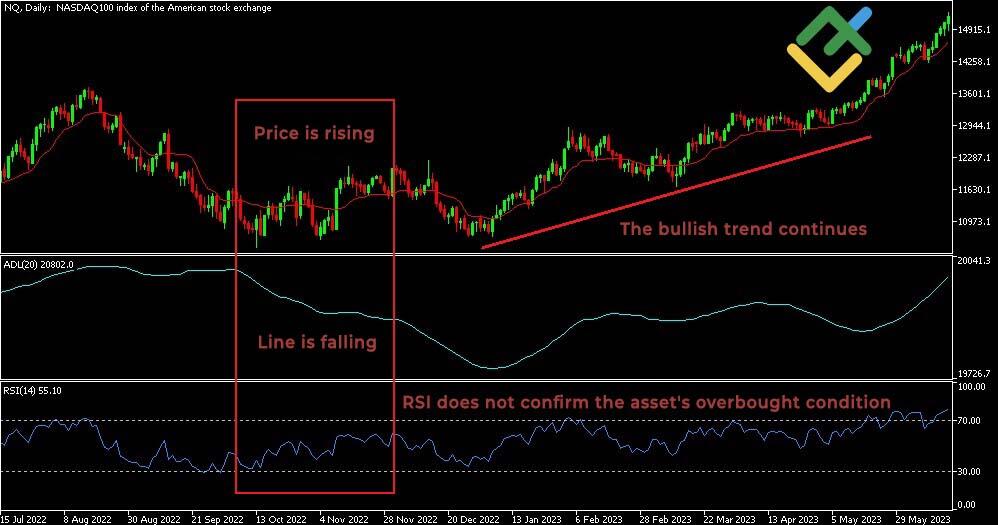
A divergence between the A/D line indicator and the price of an index, such as the S&P 500, indicate a possible trend reversal. For example, if the price of a trading instrument is rising and the line is falling, the bullish trend is weakening. Conversely, when the price is falling, and the line is growing, the bearish trend may reverse.
For more accurate market analysis and trend validation, the A/D line is often combined with other indicators, such as the RSI or MACD.
Scenarios of A/D Line and Index Movements
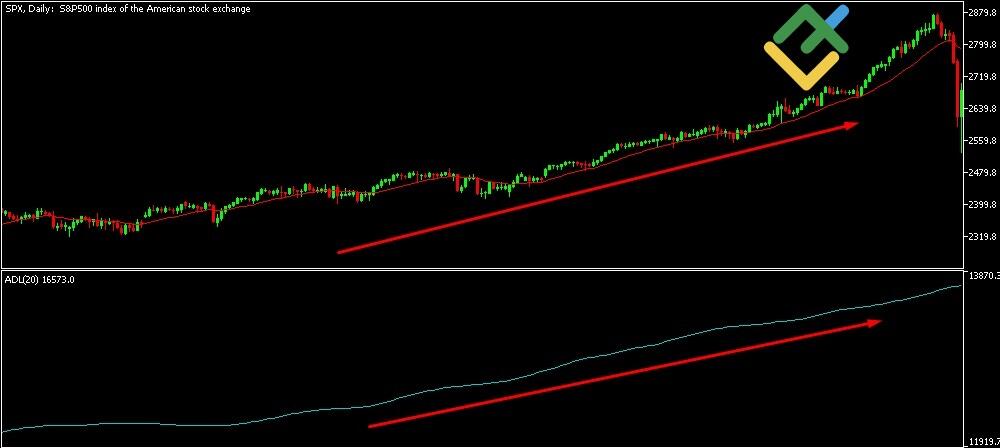
1. The A/D line and the index value are trending upward. If both the index price and the A/D line are rising, this is a signal of a bull market. The majority of stocks are growing, it is possible to consider buy trades due to strengthening of the uptrend.
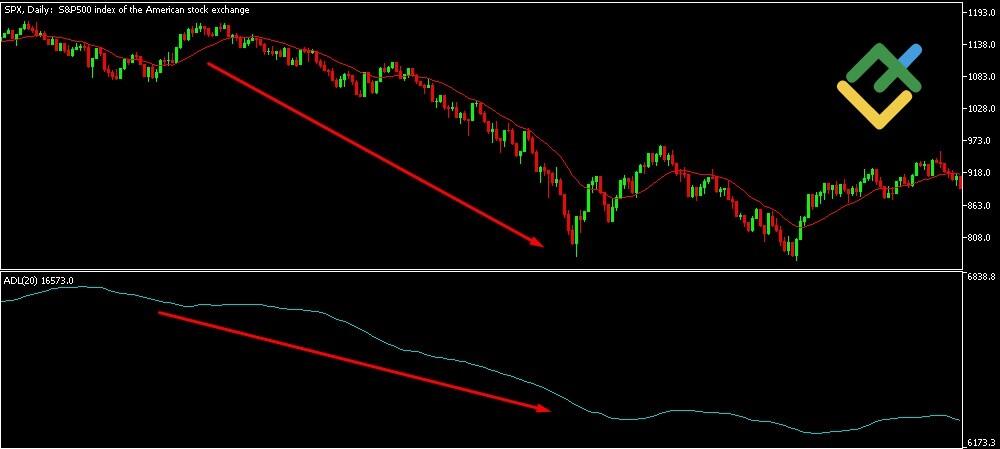
2. The A/D line and the markets are trending downward. If the index price and A/D line are declining, it indicates a bear market. In this case, most securities are falling, which confirms the weakness of the market. Traders can use this signal as a confirmation of a bearish trend and consider short positions.
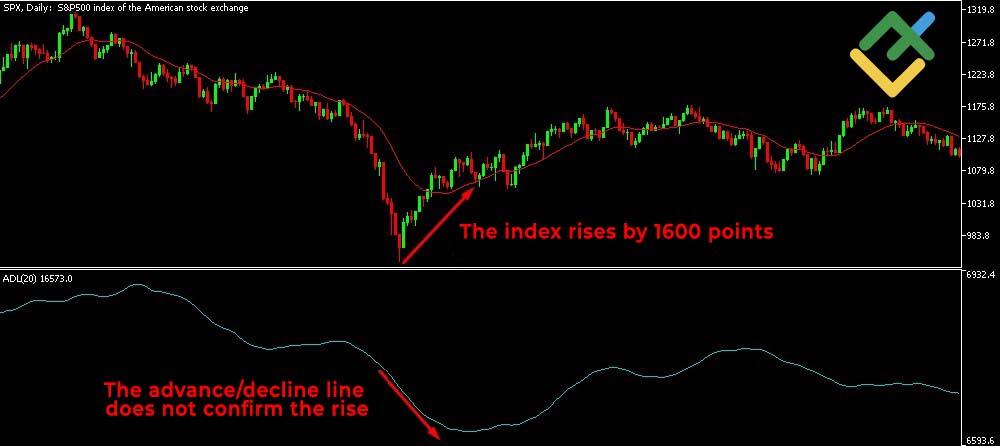
3. The A/D indicator is trending upward, while the index is moving in the opposite direction. This represents a bullish divergence, assuming that sellers are losing their conviction. The index is declining, but the rising A/D line indicates an increase in the number of rising stocks, suggesting that fewer stocks are declining over time and the downward trend may reverse as more stocks in the index are beginning to rise, thereby the index may be near the end of its decline.
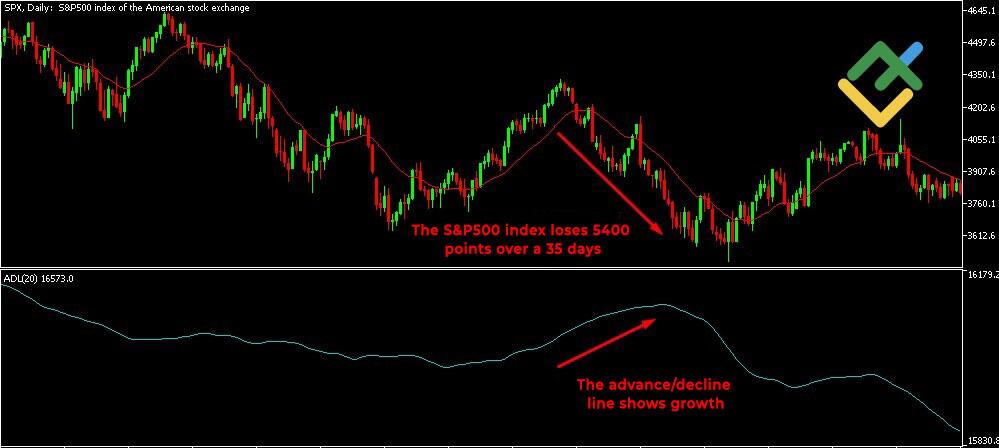
4. The A/D line is sloping downwards while the index is increasing in value, indicating a bearish divergence. Despite the index price rising, the Advance-Decline line shows that an increasing number of stocks are falling. This could be an indication of a weakening in the current trend, suggesting a potential reversal to the downside. Thus, traders may consider locking in profits or opening short positions.
Difference Between the A/D Line and Arms Index (TRIN)
The A/D line and the Arms Index (TRIN) are two distinct indicators of market breadth.
-
Tracked Parameters:
-
The A/D line is a long-term indicator that tracks the difference between the number of advancing stocks and declining stocks.
-
The TRIN is a short-term indicator that measures the ratio of the number of advancing and declining stocks (AD Ratio) to declining and advancing volume (AD volume).
-
-
Purpose:
-
The rising line shows the general direction of the market – bullish or bearish trend.
-
The TRIN helps determine market liquidity and trend strength.
-
-
Trading Volume:
-
The ADL only takes into account the number of stocks that rise or fall.
-
The TRIN takes into account trading volume, which makes the indicator more sensitive to changes in market sentiment.
-
Limitations of the Advance/Decline Line
The Advance/Decline index is a market breadth indicator used to show how many stocks are participating in a stock market rally or decline. However, it is not without some shortcomings. Firstly, the A/D line does not take into account stocks that are not included in the index calculation. Furthermore, the exclusion of stocks from the index can impede the accuracy of the A/D line indicator, as the indicator may not fully reflect the actual market conditions. If there is a significant number of delisted companies with performance that differs from the market average, the resulting analysis may be less accurate.
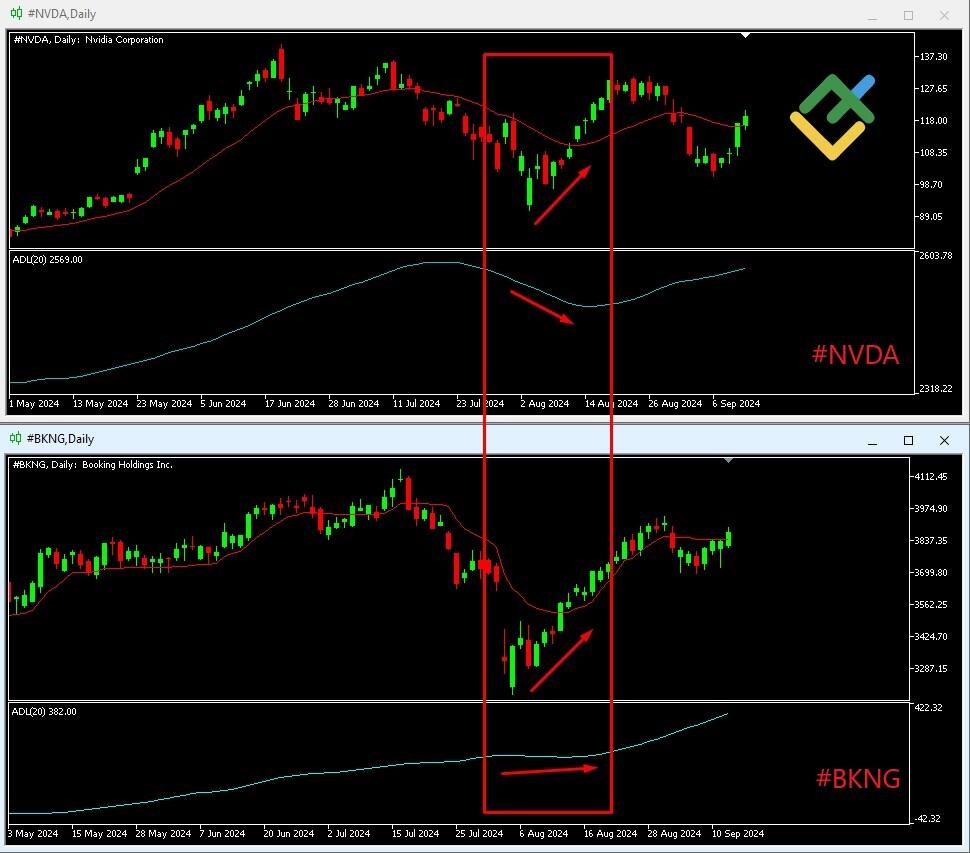
Another drawback is that the AD line assigns equal weight to all companies, regardless of their market capitalization. This results in a reduction in the indicator’s sensitivity to changes in the shares of large companies.
For instance, major NASDAQ stocks such as #AAPL (Apple Inc.) and #NVDA (Nvidia Corp.) exert a considerable influence on the index. However, their contribution is not always accurately reflected in the A/D line. Conversely, shares of small to mid-cap companies, such as #BKNG (Booking Holdings Inc.), can have a more pronounced impact on the A/D indicator, which occasionally distorts the actual market situation.
Summary
The advance decline line is used to confirm market trends, representing a powerful tool for analyzing market breadth. However, it is essential to confirm the obtained readings. Traders frequently utilize it in conjunction with other technical analysis tools to enhance the precision of forecasts. For instance, the Relative Strength Index (RSI) assesses the magnitude of recent price changes and assists in identifying overbought or oversold conditions. If the line diverges from the stock index values, and the RSI validates the extremes, this points to potential trend reversals.
When used in conjunction with other indicators, the A/D breadth indicator can provide more precise insights into the current market condition, confirming market uptrends and downtrends and enabling informed trading decisions.
Advance/Decline (A/D) Line FAQs
The Advance-Decline Line tracks rising and falling stocks in real time during the trading day. Thus, traders can quickly assess the current market sentiment.
The S&P 500 A/D Line shows the difference between the number of rising and falling stocks that make up the S&P 500 Index, allowing traders to gauge the strength and direction of the trend.
The A/D ratio is the correlation between ascending and descending stocks. When trading using this indicator, traders observe its readings for a particular index. A significant change in the ratio can serve as a signal to open positions.
The 10-day Advance Decline ratio is the average of the ratio over the last 10 days, the main function of this indicator is to smooth out short-term fluctuations. Traders use it to identify more stable market trends.
You can use the advance decline line to identify advancing and declining stocks and find out the number of rising and falling stocks over a certain period. This data is often provided by exchanges or financial platforms in real time.

The content of this article reflects the author’s opinion and does not necessarily reflect the official position of LiteFinance. The material published on this page is provided for informational purposes only and should not be considered as the provision of investment advice for the purposes of Directive 2004/39/EC.
{{value}} ( {{count}} {{title}} )
This post is originally published on LITEFINANCE.


