Like any other financial instrument, the EURINR currency pair is sensitive to various fundamental factors, so it is sometimes difficult to predict its evolution. To make a reliable forecast for EURINR, one must thoroughly analyze macroeconomic, geopolitical, and statistical data that affect the value of this currency pair.
In this regard, many traders and investors wonder how the EURINR rate will change.
This forecast aims to decode the patterns and tendencies of this exchange rate, considering various influencing factors such as economic policies, trade relations, and regional stability. As readers embark on this exploration, they can anticipate a detailed and insightful analysis that answers this pivotal question and provides a comprehensive outlook on the future trajectory of the EURINR exchange rate, considering all possible risks surrounding this currency pair.
The article covers the following subjects:
Highlights and Key Points: EUR to INR Forecast for 2024–2030
-
Most analysts predict that the European currency will strengthen against the Indian rupee by the end of 2024, reaching the value of ₹96.3300-₹97.3000. Some experts expect the pair to trade in the range of ₹93.2950-₹93.8451. According to more pessimistic forecasts, EURINR quotes may fall to ₹90.5000-₹91.8763.
-
For 2025, many experts project the price to continue to rise in the global upward range to ₹94.5560-₹96.6300 by the end of the year. According to the most optimistic expectations, the rate may reach ₹115.0100-₹135.0100. More conservative estimates suggest the EURINR price will vary from ₹90.0774 to ₹95.5453 by the end of 2025.
-
Most experts predict a bullish trend throughout 2026, up to ₹95.8090-₹102.3600 by the end of December. Some experts say the price may reach ₹117.6100-₹148.8500. More conservative forecasts project the EURINR pair to trade in the range of ₹87.4700-₹103.5000.
-
In 2027-2030, the EURINR rate may grow to ₹97.8300-₹99.5510. Based on the most optimistic forecasts, quotes may reach the area of ₹115.7200-₹171.4700.
EUR INR Price Today Coming Days and Week
When forecasting the EUR/INR exchange rate in the near term, focus on key factors. Monitor economic indicators from the eurozone and India, such as GDP growth, inflation rates, and employment data, as these influence currency strength. Pay attention to central bank policies, particularly the European Central Bank and the Reserve Bank of India, as interest rate decisions and monetary policy changes affect exchange rates. Stay updated on geopolitical events and trade relations between Europe and India, which can affect investor sentiment. Additionally, consider broader market trends and global economic conditions, as they significantly influence currency fluctuations.
Analysts’ EUR INR Projections for 2024
Let’s take a look at EURINR’s expert forecasts for 2024. Most analysts do not expect the quotes to rise fast.
Predict-Price
Price range for 2024: ₹ 90.5000 – ₹ 121.1800 (estimated as of 30.09.2024).
According to Predict-Price, the rate will continue growing until the end of the year with a probability of 59.56%, potentially reaching ₹121.1800. If a bearish trend comes into play, the pair may decline to ₹90.5000.
Trading Economics
Price range for 2024: ₹91.8763 – ₹92.4555 (estimated as of 30.09.2024).
Based on Trading Economics‘ estimates and global macro models, the asset’s quotes will climb to ₹91.8763 by year-end.
ExchangeRates
Price range for 2024: ₹87.4027 – ₹93.4808 (estimated as of 30.09.2024).
Analysts at ExchangeRates expect EURINR to trade between ₹87.4027 and ₹93.4808 in the next three months, the average price hitting ₹90.9969.
|
Month |
Average price, ₹ |
Low, ₹ |
High, ₹ |
|
October |
93.4696 |
93.3923 |
93.4808 |
|
92.6272 |
91.3519 |
92.8132 |
|
|
November |
92.5185 |
91.0886 |
92.7270 |
|
91.8664 |
89.5089 |
92.2101 |
|
|
December |
91.7577 |
89.2457 |
92.1240 |
|
90.9969 |
87.4027 |
91.5209 |
Coincodex
Price range for 2024: ₹93.3900 – ₹100.8900 (estimated as of 30.09.2024).
Experts at Coincodex expect the price to range from ₹93.3900 to ₹100.8900.
|
Year |
Average price, ₹ |
Tod/End |
|
2024 |
97.3000 |
4.55% |
Gov Capital
Price range for 2024: ₹91.4400 – ₹99.9400 (estimated as of 30.09.2024).
Analysts at Gov Capital also project price growth to ₹96.3300 by the end of 2024. The minimum and the maximum values will reach ₹91.4400 and ₹99.9400, respectively.
|
Date |
Average price, ₹ |
Lowest possible price, ₹ |
Highest possible price, ₹ |
|
01.10.2024 |
94.2700 |
91.4400 |
97.1000 |
|
31.10.2024 |
96.3000 |
93.4100 |
99.1900 |
|
01.11.2024 |
96.7700 |
93.8700 |
99.6700 |
|
30.11.2024 |
97.0300 |
94.1200 |
99.9400 |
|
01.12.2024 |
96.9100 |
94.0000 |
99.8100 |
|
31.12.2024 |
96.3300 |
93.4400 |
99.2200 |
Longforecast
Price range for 2024: ₹91.5900 – ₹98.1100 (estimated as of 30.09.2024).
Based on Longforecast‘s expectations, EURINR quotes may grow to ₹96.6600 by the end of 2024. The maximum value will presumably equal ₹98.1100.
|
Month |
Opening price, ₹ |
Low/ High, ₹ |
Closing price, ₹ |
Tod/End |
|
October |
93.4000 |
91.5900-95.8100 |
93.3800 |
0.8% |
|
November |
93.3800 |
93.3800-96.9200 |
95.4900 |
3.0% |
|
December |
95.4900 |
95.2100-98.1100 |
96.6600 |
4.3% |
Walletinvestor
Price range for 2024: ₹92.8500 – ₹93.5750 (estimated as of 30.09.2024).
Analysts at Walletinvestor project the price to fluctuate between ₹92.8500 and ₹93.5750 in the next three months and hit ₹93.2950 in December.
|
Month |
Opening price, ₹ |
Closing price, ₹ |
Minimum price, ₹ |
Maximum price, ₹ |
Tod/End |
|
November |
92.9520 |
93.1560 |
92.8500 |
93.1560 |
0.22 % |
|
December |
93.1450 |
93.2950 |
93.1450 |
93.5750 |
0.16 % |
Panda Forecast
Price range for 2024: ₹93.0568 – ₹95.7734 (estimated as of 30.09.2024).
Based on Panda Forecast‘s estimates, the EURINR pair will trade between ₹93.0568 and ₹95.7734 up to the end of 2024.
The average price in December is projected to reach ₹93.8451.
|
Month |
Average price, ₹ |
Minimum, ₹ |
Maximum, ₹ |
|
October |
94.4418 |
93.1952 |
95.7734 |
|
November |
94.6401 |
93.5896 |
95.5487 |
|
December |
93.8451 |
93.0568 |
95.3091 |
EURINR Technical Analysis
To predict EURINR’s future trends, we will analyze the price chart on H4, D1, W1, and MN time frames. We will use MACD, RSI, MA Cross, and tick volumes for more accurate analysis.
Combining these technical tools will help determine the current trend and its strength. The indicators also help determine overbought and oversold zones for an asset to spot optimal entry and exit points.
It’s also recommended that candlestick and chart pattern analysis be conducted. Candlestick and large chart patterns will help determine liquid support and resistance levels and, therefore, more profitable entry points.
The most popular chart patterns include Engulfing, such reversal patterns as Hammer and Hanging man, star pattern varieties (Evening, Morning, Shooting stars), Head and Shoulders, and others.
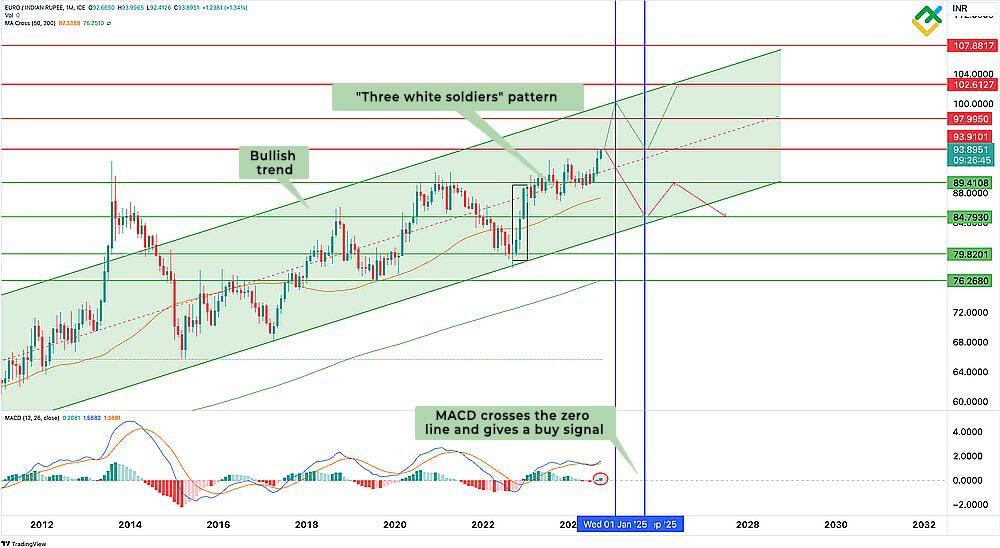
First, we’ll analyze the one-month chart to determine the market’s current state.
The EURINR quotes have been in the upward range for a long time. The price has successfully broken and consolidated above the key resistance level of ₹89.4108.
Note the three white soldiers pattern formed in the range of ₹79.8201-₹89.4108, warning market participants of a continued bullish rally in the asset.
Simple moving averages MA-50 and MA-200 are below the market price at ₹87.3302 and ₹76.2488, respectively. These are dynamic support levels. The MACD values have broken through the zero border upwards and continue to grow actively in the positive zone, a signal to open long positions.
This preliminary analysis of the monthly chart shows that EURINR is in an upward range, with the price holding near the key resistance level of ₹93.9101, which it may break soon.
The EURINR rate will likely continue to grow to a new high of ₹97.9950 until the end of 2024.
Get access to a demo account on an easy-to-use Forex platform without registration
EURINR Forecast For Next Three Months
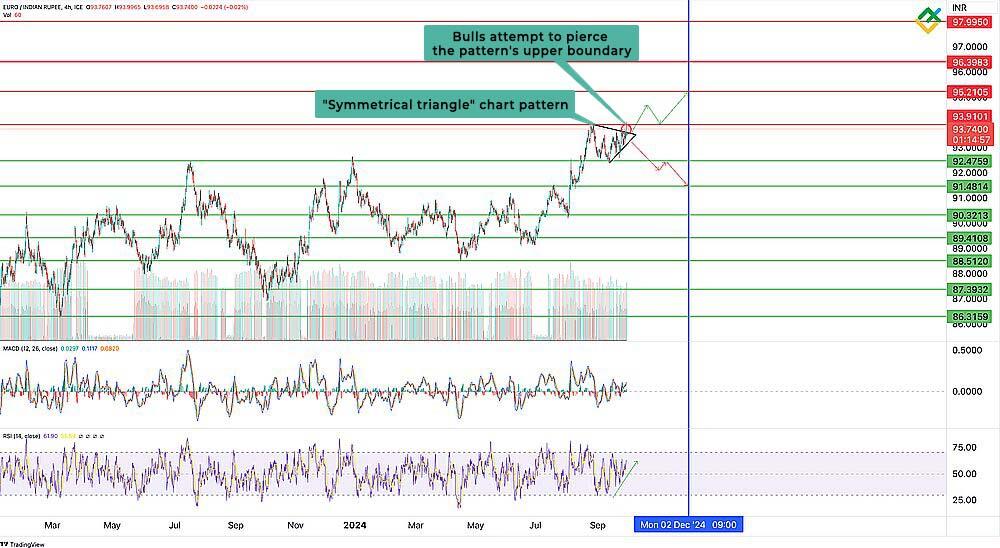
To determine the short-term trend for EURINR in the next few months, we must conduct a technical analysis of the H4 and D1 charts.
On the four-hour chart, we can see a large symmetrical triangle that the price can break both up and down.
The values of the MACD indicator steadily increase in the positive zone, giving a buy signal.
The values of the RSI indicator are located at 54 in a bullish trend, suggesting potential for further growth.
In case of a breakout of the upper or lower border of the symmetrical triangle, potential targets will be located at ₹95.2105 and ₹91.4814, respectively.
The daily chart of EURINR provides a clearer image of the symmetrical triangle pattern, within which bearish reversal patterns – a dark cloud and a series of bearish harami – are forming.
Also, pay attention to the doji pattern, which indicates market uncertainty and gives a bearish signal on tops.
However, the MACD indicator values gradually increase in the negative zone to the zero border, making the bears wary.
The RSI values are held above 50, which characterizes the bullish trend.
Currently, the forces of the bulls and bears are approximately equal. So, to make more informed trading decisions in the next three months, it is necessary to receive additional signals, such as a breakout of the symmetrical triangle.
If the price breaks through the pattern’s upper border and consolidates above the key resistance of ₹93.9101, expect further growth to ₹95.2105-₹97.9950 in the coming months.
If the pair’s quotes break the lower boundary of the triangle and consolidate below the support of ₹92.4759 amid increased volumes, a bearish reversal will occur with targets of around ₹91.4814-₹89.4108.
Long-Term EURINR Analysis for 2024–2025
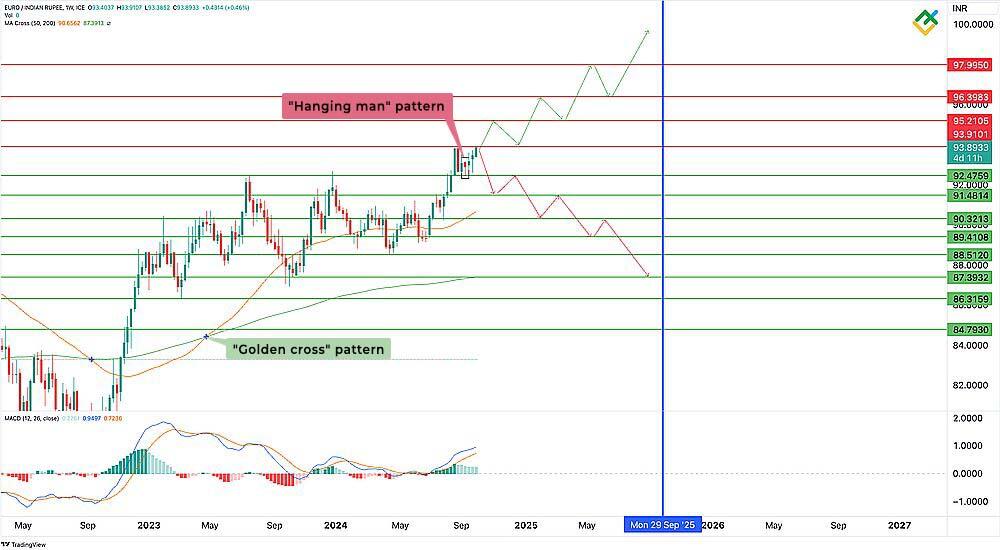
We need to analyze the weekly time frame to determine the medium-term prospects of the EURINR rate.
After the price reached a new historical maximum of ₹93.9160, the hanging man reversal pattern started forming. This pattern indicates that the asset has reached a high-price area, signaling a potential downward price reversal.
Despite this, the quotes continue to move within the ascending channel, as suggested by the golden cross pattern, whose lines are widening.
The MACD indicator gradually declines in the positive zone, signaling the weakening bullish momentum.
In case of price consolidation above the resistance of ₹93.9101, expect the uptrend to continue to ₹95.2105-₹97.9950 in the next 12 months.
An alternative scenario will play out if the bears break the key support level of ₹92.4759, driving market participants to open short positions with targets at around ₹91.4814-₹84.7930.
|
Month |
EURINR projected values |
|
|
Minimum, ₹ |
Maximum, ₹ |
|
|
October 2024 |
93.1187 |
94.1869 |
|
November 2024 |
92.6891 |
93.4786 |
|
December 2024 |
92.0156 |
93.0490 |
|
January 2025 |
91.4118 |
92.3988 |
|
February 2025 |
91.6092 |
92.5730 |
|
March 2025 |
90.8429 |
91.9576 |
|
April 2025 |
90.7152 |
91.3886 |
|
May 2025 |
91.2144 |
92.3407 |
|
June 2025 |
91.3178 |
92.4452 |
|
July 2025 |
90.2159 |
91.4002 |
|
August 2025 |
89.6353 |
90.4249 |
|
September 2025 |
89.3566 |
90.7384 |
EURINR Long-Term Trading Plan
Indicators and candlestick patterns do not provide clear signals for opening short or long positions. However, the asset is within a large ascending channel and has the potential for further growth in the next 12 months.
The technical analysis of the EURINR pair allowed us to identify key support and resistance levels that can be used in your trading strategy.
Trading Strategy for the next three months
-
The EURINR quotes are currently in a large symmetrical triangle, which they can exit both up and down. Potential buy and sell targets for the pattern in case of a breakout are located at ₹95.2105 and ₹91.4814, respectively.
-
Note the formation of bearish patterns, such as a dark cloud, bearish harami, and doji, near the all-time high. They signal an eventual trend reversal.
-
Consider long positions above ₹93.9101 with targets around ₹95.2105-₹97.9950.
-
Short positions could be opened below ₹92.4759 with targets at around ₹91.4814-₹89.4108.
-
The key support levels: ₹92.4759, ₹91.4814, ₹90.3213, ₹89.4108.
-
The key resistance levels: ₹93.9101, ₹95.2105, ₹96.3983, ₹97.9950.
One-year trading plan
-
EURINR’s weekly time frame shows the Hanging Man reversal pattern forming at around ₹92.4759, which indicates weakening bullish momentum. Indicators give mixed signals about the further dynamics of the EURINR rate.
-
For the bullish momentum to resume, the price must break resistance of ₹93.9101 amid increased volumes to head for new historical highs of ₹95.2105-₹97.9950. However, such a scenario is questionable due to the Hanging man pattern.
-
The key support levels: ₹92.4759, ₹91.4814, ₹90.3213, ₹89.4108, ₹88.5120, ₹87.3932, ₹86.3159, ₹84.7930.
-
The key resistance levels: ₹93.9101, ₹95.2105, ₹96.3983, ₹97.9950.
Analysts’ EUR INR Projections for 2025
What will the EURINR rate be in 2025? Let’s explore expert forecasts. Most analysts expect the pair to grow.
Gov Capital
Price range for 2025: ₹93.6700 – ₹119.5300 (estimated as of 30.09.2024).
Analysts at Gov Capital provide a positive outlook for the EURINR rate in 2025. The average price may climb to ₹109.0700 by the end of the first six months. In the second half of the year, a bullish rally is expected to continue, with the price reaching ₹118.4600 by year-end.
|
Date |
Average price, ₹ |
Lowest possible price, ₹ |
Highest possible price, ₹ |
|
01.01.2025 |
96.5700 |
93.6700 |
99.4700 |
|
31.01.2025 |
100.3100 |
97.3000 |
103.3200 |
|
01.02.2025 |
99.6400 |
96.6500 |
102.6200 |
|
28.02.2025 |
102.8700 |
99.7900 |
105.9600 |
|
01.03.2025 |
102.1500 |
99.0900 |
105.2200 |
|
31.03.2025 |
107.6700 |
104.4400 |
110.9000 |
|
01.04.2025 |
107.6600 |
104.4300 |
110.8900 |
|
30.04.2025 |
108.5400 |
105.2800 |
111.8000 |
|
01.05.2025 |
109.1500 |
105.8700 |
112.4200 |
|
31.05.2025 |
109.9700 |
106.6700 |
113.2700 |
|
01.06.2025 |
109.3600 |
106.0800 |
112.6400 |
|
30.06.2025 |
109.0700 |
105.8000 |
112.3400 |
|
01.07.2025 |
108.9900 |
105.7200 |
112.2600 |
|
31.07.2025 |
112.6500 |
109.2700 |
116.0300 |
|
01.08.2025 |
112.5000 |
109.1200 |
115.8700 |
|
31.08.2025 |
114.7800 |
111.3300 |
118.2200 |
|
01.09.2025 |
114.6700 |
111.2300 |
118.1100 |
|
30.09.2025 |
113.3100 |
109.9100 |
116.7100 |
|
01.10.2025 |
113.0700 |
109.6800 |
116.4700 |
|
31.10.2025 |
112.7300 |
109.3500 |
116.1200 |
|
01.11.2025 |
114.1200 |
110.6900 |
117.5400 |
|
30.11.2025 |
116.0500 |
112.5700 |
119.5300 |
|
01.12.2025 |
115.7100 |
112.2400 |
119.1800 |
|
31.12.2025 |
115.0100 |
111.5600 |
118.4600 |
Predict-Price
Price range for 2025: ₹89.0000 – ₹135.0100 (estimated as of 30.09.2024).
Predict-Price, an agency that provides AI-powered estimates and statistical data analysis, predicts a rise to ₹135.01 with a 53.03% probability. However, the price may as well drop to ₹89.0000 per euro.
Longforecast
Price range for 2025: ₹92.8300 – ₹100.0000 (estimated as of 30.09.2024).
Based on Longforecast‘s estimates, the pair will trade at around ₹96.6600 in early 2025, dropping to ₹95.5900 by the end of January. Afterward, EURINR is expected to fluctuate between ₹92.8300 and ₹100.0000. The price may hit ₹96.6300 by year-end.
|
Month |
Opening price, ₹ |
Low/ High, ₹ |
Closing price, ₹ |
|
January |
96.6600 |
94.1600-97.0200 |
95.5900 |
|
February |
95.5900 |
95.5900-98.6300 |
97.1700 |
|
March |
97.1700 |
94.7800-97.6600 |
96.2200 |
|
April |
96.2200 |
95.1700-98.0700 |
96.6200 |
|
May |
96.6200 |
94.8600-97.7400 |
96.3000 |
|
June |
96.3000 |
92.8300-96.3000 |
94.2400 |
|
July |
94.2400 |
93.9200-96.7800 |
95.3500 |
|
August |
95.3500 |
95.3500-99.6800 |
98.2100 |
|
September |
98.2100 |
97.0400-100.0000 |
98.5200 |
|
October |
98.5200 |
95.0000-98.5200 |
96.4500 |
|
November |
96.4500 |
94.2100-97.0700 |
95.6400 |
|
December |
95.6400 |
95.1800-98.0800 |
96.6300 |
Coincodex
Price range for 2025: ₹91.1600 – ₹106.9400 (estimated as of 30.09.2024).
For 2025, Coincodex predicts an average price of ₹103.7500, with annual lows and highs of ₹91.1600 and ₹106.9400, respectively.
|
Year |
Annual low, ₹ |
Annual high, ₹ |
|
2025 |
91.1600 |
106.9400 |
ExchangeRates
Price range for 2025: ₹86.3000 – ₹94.9000 (estimated as of 30.09.2024).
Analysts at ExchangeRates anticipate that the price will vary from ₹86.3000 to ₹94.9000, expecting an average price of ₹90.0000. The rate is projected to reach around ₹90.0774 by the end of June.
|
Month |
Average price, ₹ |
Low, ₹ |
High, ₹ |
|
January |
90.9741 |
87.3755 |
91.5951 |
|
90.6703 |
87.0332 |
92.6472 |
|
|
February |
90.6269 |
86.9843 |
92.7975 |
|
90.3665 |
86.6908 |
93.6992 |
|
|
March |
90.3231 |
86.6419 |
93.8495 |
|
90.0198 |
86.3000 |
94.9000 |
|
|
April |
90.0218 |
86.3297 |
94.8360 |
|
90.0383 |
86.5769 |
94.3031 |
|
|
May |
90.0403 |
86.6066 |
94.2391 |
|
90.0588 |
86.8835 |
93.6422 |
|
|
June |
90.0615 |
86.9231 |
93.5569 |
|
90.0774 |
87.1604 |
93.0453 |
Panda Forecast
Price range for 2025: ₹90.5601 – ₹98.8518 (estimated as of 30.09.2024).
Experts at Panda Forecast project the average price to reach ₹93.1976 per euro in 2025. The quotes will rise throughout the year within a wide range of ₹90.5601-₹98.8518, up to ₹95.5453 by the end of December.
|
Month |
Average price, ₹ |
Minimum, ₹ |
Maximum, ₹ |
|
January |
93.1976 |
92.0233 |
93.9805 |
|
February |
92.0513 |
90.5601 |
93.2111 |
|
March |
94.6747 |
92.6298 |
96.2937 |
|
April |
94.0499 |
93.2034 |
95.0938 |
|
May |
92.9777 |
90.9136 |
94.9303 |
|
June |
93.0893 |
92.2794 |
95.1559 |
|
July |
94.8208 |
93.0855 |
95.8733 |
|
August |
96.0155 |
94.5177 |
97.7438 |
|
September |
96.5916 |
94.9399 |
98.8518 |
|
October |
95.4904 |
94.8029 |
97.6390 |
|
November |
95.0321 |
94.4334 |
96.4291 |
|
December |
95.5453 |
94.9720 |
97.2937 |
Walletinvestor
Price range for 2025: ₹92.3440 – ₹94.9690 (estimated as of 30.09.2024).
Based on Walletinvestor‘s forecasts, the EURINR average price will reach ₹93.7200 by the end of the first half of 2025.
In the second half of the year, the quotes will remain in the range of ₹93.6080-₹94.9690 and reach ₹94.5560 by the end of the year.
|
Month |
Opening price, ₹ |
Closing price, ₹ |
Minimum price, ₹ |
Maximum price, ₹ |
|
January |
93.2510 |
92.5690 |
92.4750 |
93.2510 |
|
February |
92.5880 |
92.4090 |
92.3440 |
92.6140 |
|
March |
92.4390 |
92.4620 |
92.4240 |
92.6910 |
|
April |
92.4680 |
92.9770 |
92.4130 |
92.9770 |
|
May |
92.9770 |
93.0890 |
92.8350 |
93.0890 |
|
June |
93.0840 |
93.7200 |
93.0840 |
93.7440 |
|
July |
93.7310 |
93.9790 |
93.6080 |
93.9790 |
|
August |
93.9780 |
94.8740 |
93.9780 |
94.8900 |
|
September |
94.9240 |
94.4140 |
94.3870 |
94.9690 |
|
October |
94.4120 |
94.2180 |
94.2180 |
94.4490 |
|
November |
94.2130 |
94.3600 |
94.0960 |
94.3730 |
|
December |
94.4170 |
94.5560 |
94.4170 |
94.8120 |
Analysts’ EUR INR Projections for 2026
Most experts predict an upward trend for the EURINR currency pair during 2026.
Predict-Price
Price range for 2026: ₹ 87.1000 – ₹ 148.8500 (estimated as of 30.09.2024).
In 2026, Predict-Price expects a neutral trajectory for EURINR with a 4-5% likelihood.
If the bullish trend develops, the price may jump to ₹148.8500. In an alternative scenario, the rate will decline to ₹87.1000.
WalletInvestor
Price range for 2026: ₹ 93.5890 – ₹ 96.2060 (estimated as of 30.09.2024).
Walletinvestor anticipates a narrow range of ₹93.5890-₹96.2060 in 2026, with the closing price of ₹94.9810 in late June.
By the end of the year, quotes may rise to ₹95.8090.
|
Month |
Opening price, ₹ |
Closing price, ₹ |
Minimum price, ₹ |
Maximum price, ₹ |
|
January |
94.5050 |
93.8230 |
93.7280 |
94.5050 |
|
February |
93.7960 |
93.6620 |
93.5890 |
93.8610 |
|
March |
93.6440 |
93.7260 |
93.6440 |
93.9420 |
|
April |
93.7200 |
94.2180 |
93.6500 |
94.2180 |
|
May |
94.1890 |
94.2910 |
94.0770 |
94.2980 |
|
June |
94.3550 |
94.9810 |
94.3550 |
94.9830 |
|
July |
94.9820 |
95.1840 |
94.8530 |
95.1860 |
|
August |
95.2270 |
96.1480 |
95.2220 |
96.1480 |
|
September |
96.1810 |
95.6660 |
95.6510 |
96.2060 |
|
October |
95.6550 |
95.4790 |
95.4790 |
95.6910 |
|
November |
95.4270 |
95.6330 |
95.3450 |
95.6330 |
|
December |
95.6720 |
95.8090 |
95.6720 |
96.0560 |
Gov Capital
Price range for 2026: ₹106.1200 – ₹121.1400 (estimated as of 30.09.2024).
Analysts at Gov Capital predict that the average price of the trading asset will vary from ₹111.8600 to ₹115.2300 in the first six months, hitting ₹112.8500 by the end of June.
In the second half of the year, the price is expected to decline to ₹109.4000 by the beginning of November and rise to ₹117.6100 by the end of December.
|
Date |
Average price, ₹ |
Lowest possible price, ₹ |
Highest possible price, ₹ |
|
01.01.2026 |
115.2300 |
111.7800 |
118.6900 |
|
31.01.2026 |
114.2500 |
110.8300 |
117.6800 |
|
01.02.2026 |
114.7900 |
111.3500 |
118.2300 |
|
28.02.2026 |
113.9500 |
110.5300 |
117.3700 |
|
01.03.2026 |
113.7300 |
110.3200 |
117.1400 |
|
31.03.2026 |
114.4300 |
110.9900 |
117.8600 |
|
01.04.2026 |
113.9300 |
110.5100 |
117.3500 |
|
30.04.2026 |
114.4500 |
111.0200 |
117.8900 |
|
01.05.2026 |
114.8300 |
111.3900 |
118.2800 |
|
31.05.2026 |
112.0300 |
108.6700 |
115.3900 |
|
01.06.2026 |
111.8600 |
108.5100 |
115.2200 |
|
30.06.2026 |
112.8500 |
109.4600 |
116.2300 |
|
01.07.2026 |
112.7100 |
109.3300 |
116.0900 |
|
31.07.2026 |
111.5600 |
108.2200 |
114.9100 |
|
01.08.2026 |
110.6800 |
107.3600 |
114.0000 |
|
31.08.2026 |
112.8500 |
109.4600 |
116.2300 |
|
01.09.2026 |
112.7200 |
109.3400 |
116.1100 |
|
30.09.2026 |
110.6500 |
107.3300 |
113.9700 |
|
01.10.2026 |
111.3700 |
108.0300 |
114.7100 |
|
31.10.2026 |
109.4100 |
106.1300 |
112.6900 |
|
01.11.2026 |
109.4000 |
106.1200 |
112.6800 |
|
30.11.2026 |
109.8400 |
106.5400 |
113.1300 |
|
01.12.2026 |
109.8400 |
106.5500 |
113.1400 |
|
31.12.2026 |
117.6100 |
114.0800 |
121.1400 |
Coincodex
Price range for 2026: ₹87.4700 – ₹103.5000 (estimated as of 30.09.2024).
Based on Coincodex‘s data, the annual 2026 low and high will be ₹87.4700 and around ₹103.5000.
|
Year |
Annual low, ₹ |
Annual high, ₹ |
|
2026 |
87.4700 |
103.5000 |
Panda Forecast
Price range for 2026: ₹94.3472 – ₹103.9690 (estimated as of 30.09.2024).
Analysts at Panda Forecast expect EURINR quotes to vary from ₹94.3472 to ₹103.9690 throughout 2026, with the average rate amounting to ₹98.2173. By the end of the year, the price is projected to rise to ₹100.2770.
|
Month |
Average price, ₹ |
Minimum, ₹ |
Maximum, ₹ |
|
January |
96.5485 |
94.3472 |
97.2726 |
|
February |
98.3443 |
96.7216 |
99.9670 |
|
March |
100.4390 |
98.9023 |
101.8850 |
|
April |
101.8850 |
100.1740 |
103.5660 |
|
May |
99.4707 |
97.8891 |
101.6790 |
|
June |
98.2173 |
96.5673 |
99.3665 |
|
July |
99.0718 |
97.4966 |
99.9635 |
|
August |
100.1720 |
99.3000 |
101.1330 |
|
September |
100.8030 |
98.4438 |
101.9820 |
|
October |
101.7700 |
100.6710 |
103.9690 |
|
November |
100.4570 |
99.7342 |
101.1810 |
|
December |
100.2770 |
98.0806 |
102.5930 |
LongForecast
Price range for 2026: ₹94.6200 – ₹107.6500 (estimated as of 30.09.2024).
Longforecast projects the pair’s price to range from ₹94.6200 to ₹100.4000 in the first half of the year and close at ₹97.6400 by the end of June.
In the second half of the year, the asset is expected to continue trending up in the ₹97.6400-₹107.650 range and hit ₹102.3600 by year-end.
|
Month |
Opening price, ₹ |
Low/ High, ₹ |
Closing price, ₹ |
|
January |
96.6300 |
96.4200-99.3600 |
97.8900 |
|
February |
97.8900 |
94.6200-97.8900 |
96.0600 |
|
March |
96.0600 |
95.6200-98.5400 |
97.0800 |
|
April |
97.0800 |
97.0800-100.4000 |
98.9200 |
|
May |
98.9200 |
95.8700-98.9200 |
97.3300 |
|
June |
97.3300 |
96.1800-99.1000 |
97.6400 |
|
July |
97.6400 |
97.6400-102.0800 |
100.5700 |
|
August |
100.5700 |
100.5700-105.1400 |
103.5900 |
|
September |
103.5900 |
103.5900-107.6500 |
106.0600 |
|
October |
106.0600 |
104.3500-107.5300 |
105.9400 |
|
November |
105.9400 |
102.8800-106.0200 |
104.4500 |
|
December |
104.4500 |
100.8200-104.4500 |
102.3600 |
Recent Price History of the EURINR Pair
In recent years, the EURINR exchange rate has seen noticeable fluctuations. In 2022, it started at 89.6250, dropped to a low of 77.8459, and closed around 88.5660. Following this, a long-term upward trend began, which continues today.
A completely different situation occurred in 2021 when the currency pair fell by 5.07% to 84.7075. In 2020, there was a significant increase of 11.52%, with the pair closing at 89.2290.
However, in 2019 and 2018, the changes were more modest, with a slight rise of 0.47% and 3.79%, respectively. In 2017, the trend was upward, with an increase of 7.28%, whereas in 2016, there was a slight decline of 0.66%.
Long-Term EUR to INR Forecast for 2027-2030
Many analytical agencies and experts agree that the EURINR exchange rate is expected to rise from 2027 to 2030.
Walletinvestor
Price range: ₹94.8390 – ₹99.9500 (estimated as of 30.09.2024).
Walletinvestor predicts that the EURINR rate will trade at around ₹95.7300 in early 2027. The price will range from ₹94.8390 to ₹97.4520 throughout the year and close at ₹97.0330.
In 2028-2029, quotes will continue to grow, and the pair will trade at ₹96.0940-₹98.9530. By the end of 2028, the price will reach ₹98.2200. By the end of September 2029, the rate is expected to grow to ₹99.5510.
|
Date |
Opening price, ₹ |
Closing price, ₹ |
Minimum price, ₹ |
Maximum price, ₹ |
|
2027 |
||||
|
January |
95.7300 |
95.0310 |
94.9630 |
95.7300 |
|
February |
95.0730 |
94.8680 |
94.8390 |
95.1040 |
|
March |
94.9180 |
94.9790 |
94.9180 |
95.1920 |
|
April |
94.9640 |
95.4300 |
94.8920 |
95.4550 |
|
May |
95.4450 |
95.5620 |
95.3230 |
95.5620 |
|
June |
95.6080 |
96.2320 |
95.6080 |
96.2320 |
|
July |
96.2250 |
96.4330 |
96.1010 |
96.4330 |
|
August |
96.4290 |
97.4040 |
96.4290 |
97.4040 |
|
September |
97.4270 |
96.9100 |
96.9100 |
97.4520 |
|
October |
96.8690 |
96.6930 |
96.6930 |
96.9320 |
|
November |
96.7090 |
96.8880 |
96.5920 |
96.8880 |
|
December |
96.9160 |
97.0330 |
96.9160 |
97.3070 |
|
2028 |
||||
|
January |
96.9990 |
96.3070 |
96.2000 |
96.9990 |
|
February |
96.3310 |
96.1740 |
96.0940 |
96.3450 |
|
March |
96.1970 |
96.1790 |
96.1790 |
96.4360 |
|
April |
96.1820 |
96.6540 |
96.1400 |
96.688 |
|
May |
96.6900 |
96.8500 |
96.5710 |
96.8500 |
|
June |
96.8770 |
97.4390 |
96.8770 |
97.4790 |
|
July |
97.4450 |
97.7000 |
97.3510 |
97.7000 |
|
August |
97.7460 |
98.6640 |
97.7460 |
98.6640 |
|
September |
98.6470 |
98.1280 |
98.1250 |
98.7020 |
|
October |
98.0860 |
97.9740 |
97.9590 |
98.1730 |
|
November |
97.9630 |
98.1520 |
97.8300 |
98.1520 |
|
December |
98.1430 |
98.2200 |
98.1430 |
98.5560 |
|
2029 |
||||
|
January |
98.2060 |
97.5790 |
97.4430 |
98.2060 |
|
February |
97.5830 |
97.4200 |
97.3280 |
97.5830 |
|
March |
97.4340 |
97.4390 |
97.4220 |
97.6770 |
|
April |
97.3940 |
97.9320 |
97.3940 |
97.9320 |
|
May |
97.9500 |
98.0840 |
97.8210 |
98.0840 |
|
June |
98.0830 |
98.6960 |
98.0830 |
98.7240 |
|
July |
98.6560 |
98.9530 |
98.5880 |
98.9530 |
|
August |
98.9880 |
99.8730 |
98.9880 |
99.8860 |
|
September |
99.9010 |
99.5510 |
99.5510 |
99.9500 |
Coincodex
Price range: ₹90.7600 – ₹115.7200 (estimated as of 30.09.2024).
Analysts at Coincodex also anticipate a strengthening bullish trend in EURINR in 2027-2030. The asset is projected to range from ₹90.7600 to ₹104.2400 in 2027-2028. In 2029-2030, the growth will continue, with quotes varying widely from ₹101.0500 to₹115.7200.
|
Year |
Annual low, ₹ |
Annual high, ₹ |
|
2027 |
93.8200 |
103.7700 |
|
2028 |
90.7600 |
104.2400 |
|
2029 |
101.0500 |
115.7200 |
|
2030 |
101.7700 |
109.9500 |
Longforecast
Price range: ₹94.4200 – ₹106.3300 (estimated as of 30.09.2024).
Longforecast expects EURINR’s uptrend to continue in 2027-2028. The exchange rate will rise to ₹96.8900 by the end of 2027; the minimum price will be ₹95.2800 and the maximum – ₹106.3300.
During 2028, the price will range from ₹94.4200 to ₹100.8200, reaching ₹97.8300 by the end of October.
|
Month |
Opening price, ₹ |
Low/ High, ₹ |
Closing price, ₹ |
|
2027 |
|||
|
January |
102.3600 |
100.1800-103.2400 |
101.7100 |
|
February |
101.7100 |
101.7100-106.3300 |
104.7600 |
|
March |
104.7600 |
100.1000-104.7600 |
101.6200 |
|
April |
101.6200 |
99.3300-102.3500 |
100.8400 |
|
May |
100.8400 |
100.5300-103.5900 |
102.0600 |
|
June |
102.0600 |
99.3800-102.4000 |
100.8900 |
|
July |
100.8900 |
99.1300-102.1500 |
100.6400 |
|
August |
100.6400 |
97.1600-100.6400 |
98.6400 |
|
September |
98.6400 |
97.9500-100.9300 |
99.4400 |
|
October |
99.4400 |
97.6700-100.6500 |
99.1600 |
|
November |
99.1600 |
95.2800-99.1600 |
96.7300 |
|
December |
96.7300 |
95.4400-98.3400 |
96.8900 |
|
2028 |
|||
|
January |
96.8900 |
94.8900-97.7900 |
96.3400 |
|
February |
96.3400 |
94.5500-97.4300 |
95.9900 |
|
March |
95.9900 |
95.9900-100.3500 |
98.8700 |
|
April |
98.8700 |
94.4600-98.8700 |
95.9000 |
|
May |
95.9000 |
95.3200-98.2200 |
96.7700 |
|
June |
96.7700 |
94.4200-97.3000 |
95.8600 |
|
July |
95.8600 |
95.5200-98.4200 |
96.9700 |
|
August |
96.9700 |
96.9700-100.1700 |
98.6900 |
|
September |
98.6900 |
97.8400-100.8200 |
99.3300 |
|
October |
99.3300 |
96.3600-99.3300 |
97.8300 |
Gov Capital
Price range: ₹114.0400 – ₹176.6200 (estimated as of 30.09.2024).
Experts at Gov Capital provide the most optimistic outlook. The average price of EURINR will reach ₹130.8000 by the end of 2027. By the end of September 2029, the asset is projected to trade at ₹171.4700.
|
Date |
Average price, ₹ |
Lowest possible price, ₹ |
Highest possible price, ₹ |
|
01.01.2027 |
117.5700 |
114.0400 |
121.0900 |
|
31.12.2027 |
130.8000 |
126.8800 |
134.7300 |
|
01.01.2028 |
130.4300 |
126.5200 |
134.3500 |
|
31.12.2028 |
162.6400 |
157.7600 |
167.5100 |
|
01.01.2029 |
161.6600 |
156.8100 |
166.5100 |
|
28.09.2029 |
171.4700 |
166.3300 |
176.6200 |
Which Factors Impact EUR INR Price?
Several factors, including the eurozone and India’s macroeconomic indicators, influence the EURINR exchange rate. GDP, inflation, unemployment, and central bank policies significantly determine the exchange rate. Political stability, geopolitical conflicts, and trade relations between the regions can also notably impact the currency pair. The supply and demand dynamics in the currency markets, which are shaped by trade and investment flows between the eurozone and India, are also crucial factors.
-
Inflation Differentials. Lower inflation in the Eurozone compared to India can strengthen the Euro, resulting in a higher EUR to INR rate.
-
Current Account Balance. India’s trade deficit can devalue the Rupee, enhancing the EUR-INR exchange.
-
Public Debt Levels. Higher debt in either region, especially India, may devalue its currency, affecting the EUR-INR forecast.
-
Terms of Trade Shifts. Improved Indian export prices could strengthen the Rupee, impacting the EUR to INR exchange.
-
Economic Performance. Stronger economic indicators in the Eurozone can lead to a higher EUR-INR rate, influenced by investor confidence.
-
Political Stability. Political uncertainty in India can weaken the Rupee, affecting the EUR to INR exchange.
-
Global Market Sentiment. Global economic trends and crises can unpredictably sway the EUR-INR rate.
Is EUR/INR Still a Good Investment?
The forecasts from analytical agencies regarding the EUR/INR rate for 2024-2030 are optimistic.
Many experts anticipate a further strengthening of the euro against the Indian rupee by the end of 2024, up to ₹96.3300-₹97.3000. Between 2025 and 2030, analysts also predict an upward trend for EUR/INR towards ₹96.6300-₹115.7200.
However, there are geopolitical and macroeconomic risks associated with global uncertainty in the financial markets.
The EUR/INR currency pair can be considered a long-term investment for diversifying an investment portfolio and minimizing risks, as further euro strengthening is expected.
For more effective investment decisions on EUR/INR, it is recommended to thoroughly study analytical forecasts, identify factors affecting the pair’s quotes, and conduct technical analysis to determine the current market conditions.
EURINR Forecast FAQ
Long-term forecasts for the EURINR rate in 2024-2030 are optimistic. The pair is expected to grow to ₹96.3300-₹115.7200.
Most experts agree that EURINR will evolve upward until the end of 2024. The price is expected to rise to ₹96.3300-₹97.3000 by the end of the year.
According to forecasts from various analytical agencies, the euro to rupee rate may continue to grow. Experts expect to see the price at around ₹96.3300-₹97.3000 by the end of 2024.
The value of EURINR is affected by changes in the import/export balance, political stability in the region, global economic trends, macroeconomic indicators, the level of public debt, and the inverse correlation in the countries’ inflation rates.
The content of this article reflects the author’s opinion and does not necessarily reflect the official position of LiteFinance. The material published on this page is provided for informational purposes only and should not be considered as the provision of investment advice for the purposes of Directive 2004/39/EC.
{{value}} ( {{count}} {{title}} )
This post is originally published on LITEFINANCE.

