جفت Eur/Usd: تحلیل موج الیوت و پیش‌بینی برای بازه ی 12.07.24 – 19.07.24

The article covers the following subjects:

نکات کلیدی

  •  سناریوی اصلی: موقعیت‌های خرید از اصلاحات بالای سطح 1.0665 با هدف 1.1141 – 1.1273 را در نظر بگیرید. سیگنال خرید: پس از شکسته شدن سطح 1.0665. حد ضرر: 1.0600، حد سود: 1.1273.

  •  سناریوی جایگزین: شکست و تثبیت زیر سطح 1.0665 به جفت ارز اجازه می‌دهد تا حرکت خود را به سطوح 1.0450 – 1.0217 ادامه دهد. سیگنال فروش: پس از شکسته شدن سطح 1.0665. حد ضرر: 1.0750، حد سود: 1.0217.

سناریوی اصلی

موقعیت‌های خرید از اصلاح بالای سطح 1.0665 با هدف 1.1141 – 1.1273 را در نظر بگیرید.

سناریوی جایگزین

شکست و تثبیت زیر سطح 1.0665 به جفت ارز اجازه می‌دهد تا به سطوح 1.0450 – 1.0217 ادامه دهد.

 تحلیل

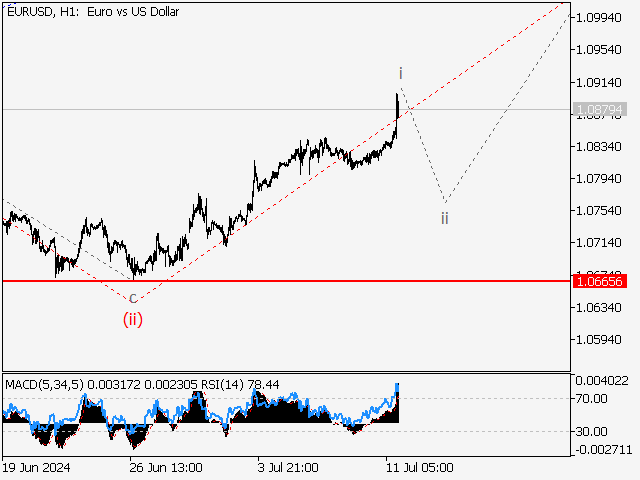
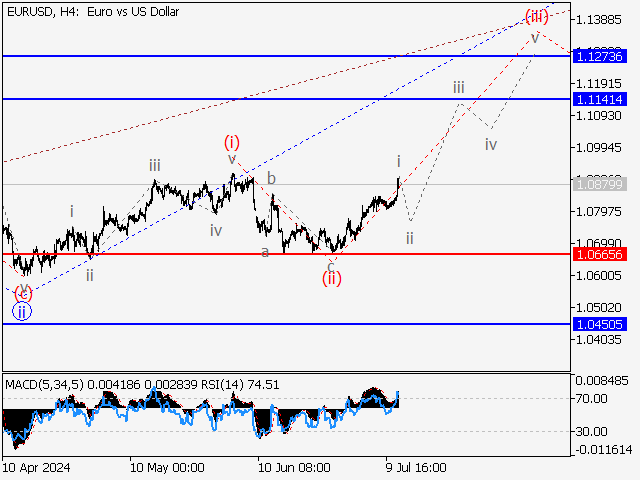
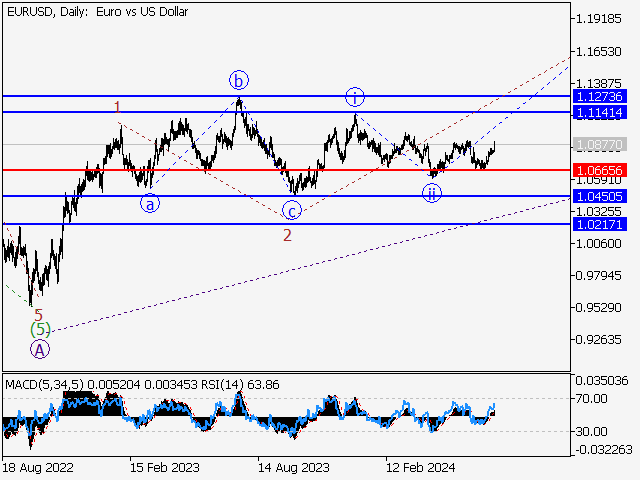
موج صعودی B احتمالاً در نمودار روزانه در حال توسعه است، به شکلی که موج اول 1 از (A) از B و موج اصلاحی دوم 2 از (A) از B به عنوان بخش‌های آن شکل گرفته‌اند. به نظر می‌رسد موج سوم 3 از (A) از B در چارچوب زمانی H4 در حال شکل گیری است که در آن موج اصلاحی نزولی ii از 3 تکمیل شده و موج iii از 3 از (A) در حال شکل‌گیری است. موج سوم درجه کوچکتر (iii) از iii در نمودار H1 در حال رشد است و موج i از (iii) به عنوان بخشی از آن شکل گرفته است. پس از اینکه اصلاح محلی ii از (iii) شکل گرفت و اگر این فرض صحیح باشد، جفت ارز EURUSD همچنان به سطوح 1.1141 – 1.1273 افزایش خواهد یافت. سطح 1.0665 در این سناریو حیاتی است. شکست این سطح به جفت ارز اجازه می‌دهد تا به سطوح 1.0450 – 1.0217 ادامه دهد.


Price chart of EURUSD in real time mode

The content of this article reflects the author’s opinion and does not necessarily reflect the official position of LiteFinance. The material published on this page is provided for informational purposes only and should not be considered as the provision of investment advice for the purposes of Directive 2004/39/EC.

Rate this article:

{{value}} ( {{count}} {{title}} )

This post is originally published on LITEFINANCE.

  • Related Posts

    Rising Wedge: What Is It & How Does It Work?

    Technical analysis encompasses various chart and candlestick patterns that reflect traders’ sentiment and behavior in financial markets. These chart patterns, in combination with technical indicators, help traders make more informed…

    XAU/USD: Elliott wave analysis and forecast for 20.09.24 – 27.09.24

    The article covers the following subjects: Highlights and key points Main scenario: consider long positions from corrections above the level of 2472.80 with a growth target of 2700.00 – 2800.00.…

    Leave a Reply

    Your email address will not be published. Required fields are marked *

    You Missed

    Oil ends week higher as investors take stock of Fed rate cuts

    • September 20, 2024
    Oil ends week higher as investors take stock of Fed rate cuts

    Oil flat, poised to end week higher on Fed rate cuts, lower US supply

    • September 20, 2024
    Oil flat, poised to end week higher on Fed rate cuts, lower US supply

    Oil prices cut losses to remain on track for weekly gains after hefty Fed cut

    • September 20, 2024
    Oil prices cut losses to remain on track for weekly gains after hefty Fed cut

    At United Steelworkers conference, members and leaders play down election divide

    • September 20, 2024
    At United Steelworkers conference, members and leaders play down election divide

    Oil dips but poised to end week higher on Fed rate cuts, lower US crude stocks

    • September 20, 2024
    Oil dips but poised to end week higher on Fed rate cuts, lower US crude stocks

    Rising Wedge: What Is It & How Does It Work?

    • September 20, 2024
    Rising Wedge: What Is It & How Does It Work?